How to Map a Cannabis Garden Microclimate
A weather app can tell you what is happening across your town. It cannot tell you that the back-left corner of your garden stays four degrees colder before sunrise, that a west-facing wall turns one container row into a heat trap after 3 p.m., or that a solid fence keeps the center of the canopy wet long after the rest of the yard has dried.
Those differences are the garden’s microclimate, and they are often where outdoor cannabis problems begin. The plant does not experience a regional average. It experiences the exact combination of sunlight, reflected heat, wind, humidity, soil moisture, drainage, nighttime cooling, and nearby structures around its own canopy and roots.
The good news is that you do not need a professional weather station to build a useful map. A few repeatable observations, one or more temperature and humidity loggers, a simple drainage test, a wind check, and a notebook can reveal most of the differences that matter. The important part is measuring several places the same way instead of taking one reading and calling it the climate.
This resource focuses only on mapping that local environment and turning the map into planting and management decisions. It does not repeat the entire outdoor growing process. For the larger sequence of site selection, soil preparation, plant development, flowering, weather management, and harvest, use the complete outdoor cannabis growing guide as the parent resource.
Resource Navigation
In This Resource
- Define the outdoor decision in terms of site, season, climate, legal access, and plant risk
- Measure the site: sun path, shade, temperature, humidity, wind, drainage, water access, cold pockets, or contamination as relevant
- Seasonal timing: latitude, photoperiod, weather windows, and cultivar behavior
- Practical setup/response plan with materials, placement, inspection points, and a backup option
- Failure modes: stagnant air, trapped moisture, heat load, frost, wind damage, water shortage, security, or neighbor impact
- Legal/safety boundary without guessing local rules or recommending dangerous traps
- Pre-season and weekly checklist that turns the article into a repeatable field procedure
Define the outdoor decision in terms of site, season, climate, legal access, and plant risk
A useful microclimate map starts with a decision. You are not collecting weather data because graphs look interesting. You are trying to answer practical questions such as: Which part of the garden should hold the plants? Which zone needs more water? Where will late-season moisture linger? Which corner becomes dangerous in a heatwave? Where will a privacy fence create shade? Where does cold air settle on a clear autumn night?
If you know the decision you are trying to make, you can measure the variables that actually change it. If you do not, it is easy to collect a week of numbers that never tell you where to place a plant.
Garden microclimate
A garden microclimate is the local environmental pattern around a specific part of the growing site. It can differ from the regional weather because of slope, walls, paving, shade, vegetation, soil moisture, wind exposure, elevation, buildings, fences, and the plant canopy itself. A useful microclimate map records those differences spatially and tracks how they change through time.
Start with zones, not individual plants
Walk the site before setting out a single sensor. Most gardens naturally break into a few environmental zones. You may have an open sunny center, a west wall that heats strongly in the afternoon, a shaded fence line, a low damp corner, and an exposed edge that catches the prevailing wind.
Give those zones simple names such as A, B, C, and D. You are not trying to draw a perfect scientific grid at this stage. You are identifying places that are likely to behave differently.
Then choose one reference point. This should be the most open, representative part of the site you can reasonably monitor. Every other location will be compared with it. If Zone C reaches 34°C while the reference reaches 30°C during the same afternoon, that four-degree difference is more useful than either number alone. It tells you Zone C is behaving differently from the site around it.
Field Advice: Microclimate mapping works best as a comparison exercise. A single sensor can tell you that the garden reached 31°C. Three sensors can tell you which part of the garden reached 31°C first, which stayed cooler, and which remained warm after sunset.
Define the risk before you define the equipment
For outdoor cannabis, the highest-value microclimate risks usually fall into a few groups. There is light availability, including direct sun and seasonal shade. There is heat load from solar exposure, paving, walls, and containers. There is moisture behavior, including humidity, dew, rain drying, and root-zone drainage. There is mechanical exposure from wind. There is cold-air drainage and frost risk. There is water access. And there may be contamination, security, or neighbor constraints that make an otherwise excellent horticultural position unusable.
You do not need to measure every variable with laboratory precision. What you need is enough information to separate a manageable site from a site that will keep creating the same problem.
Do not let one good feature hide three bad ones
A warm south-facing wall may look perfect because it receives excellent sun. But if the wall also reflects afternoon heat onto black containers, prevents air movement behind the canopy, and keeps the root zone several degrees warmer than the rest of the garden, the same feature that helps early in the season can become a midsummer stress amplifier.
The opposite can happen in a low corner. It may be protected from wind and hold moisture well, which looks convenient in early summer. Later, cold air may settle there at night and morning dew may persist much longer than it does on slightly higher ground.
This is why the map should never be based on one category such as “sunny” or “protected.” A plant experiences the combination.
My weather app is usually accurate. Do I really need sensors in a small backyard?
Question sent by: Ethan Brooks, via email.
You may not need several permanent sensors, but you still need local observations. Regional weather is excellent for seeing the larger pattern. It cannot account for the heat reflected from your wall, the shade from your neighbor’s tree, or the cold pocket behind your fence. Even a short comparison between one sheltered point and one open reference point can show whether the backyard is following the regional forecast or behaving differently.
Microclimate mapping is also a legal-access decision
Do not let horticultural quality push the garden into a location that is not lawfully usable. A hidden part of a property may have excellent sun and shelter but fail local access, visibility, setback, fencing, tenancy, or property-use rules. Likewise, public land, another person’s property, or an unapproved shared space is not made suitable because the microclimate is good.
First confirm that the area can legally be used. Then optimize the horticulture inside that boundary.
Measure the site: sun path, shade, temperature, humidity, wind, drainage, water access, cold pockets, or contamination as relevant
This is where the map becomes real. You are going to measure several locations using the same method, at the same time, for long enough to see a pattern.
If you only remember one rule from this section, make it this one: standardize the comparison. The same sensor model at the same height is far more useful than one sensor on the ground, another on a wall, and a third hanging in full sun.
Draw the base map first
You can use graph paper, a phone note, a printed satellite image of your own property, or a simple sketch. It does not need to be architectural.
Mark the important fixed objects: buildings, walls, fences, trees, sheds, paving, slopes, drains, taps, gates, neighboring structures, and the areas where you might actually place plants. Add north if you know it. Then mark your proposed measurement zones.
For a small garden, four to six points are often enough to reveal meaningful differences. A larger or more complicated site may need more. The objective is not maximum sensor density. It is covering the environmental contrasts.
| Map point | Why you might measure it |
|---|---|
| Open reference | The most representative open location. Use it as the comparison point for temperature, humidity, wind, and sun exposure. |
| South or west wall | Checks reflected and stored heat, afternoon exposure, reduced airflow, and container heating. |
| Fence or hedge line | Checks shade, wind reduction, humidity retention, and nighttime cooling beside a barrier. |
| Low spot | Checks water accumulation, cold-air pooling, delayed morning warming, and frost risk. |
| Exposed edge | Checks wind load, faster drying, greater evapotranspiration, and storm exposure. |
| Candidate plant position | Confirms that the place you actually intend to use behaves the way the broader map suggests. |
Map sunlight as a moving path
Bright is not the same as direct sun. A garden can look bright all day because it sees a large area of sky while receiving only a few hours of unobstructed direct sunlight.
Pick a clear or mostly clear day and visit each candidate zone at regular intervals. Hourly checks are easy to understand. Record direct sun, partial obstruction, or full shade. If you want more detail, note what is creating the shade.
You might discover that Zone A receives direct sun from 8 a.m. until 4 p.m., Zone B loses it at 2 p.m. behind a building, and Zone C receives very strong late-afternoon sun only after spending the morning shaded.
That timing matters. A west-facing zone may see fewer total hours yet experience more late-day heat stress because the hottest part of the day overlaps with direct solar exposure and heat released from nearby hard surfaces.
General extension guidance for sun-loving garden crops commonly recommends at least six hours of direct sunlight, with eight or more preferred for many high-light crops. Cannabis research also shows a strong response to increasing light intensity. But do not turn a horticultural sun-hours guideline into a universal cannabis yield formula. Use it to compare sites, then judge the plant response and local heat load together.
Remember: Repeat a borderline sun map later in the season. Trees leaf out, sun angle changes, neighboring vegetation grows, and a spring site that appears open can lose hours of direct light by midsummer.
Measure temperature without measuring a hot sensor
This is one of the easiest ways to ruin a microclimate map.
An unshielded thermometer or data logger sitting in direct sunlight can absorb radiation and become hotter than the surrounding air. The display may look precise while the measurement is wrong for the question you are asking. You end up mapping sensor heating instead of air temperature.
For temperature and relative humidity comparisons, use the same type of sensor in each location and protect exposed sensors with an appropriate ventilated radiation shield. Keep the height consistent. If your purpose is to compare the environment around a future cannabis canopy, a representative canopy-height position can be more useful than mixing ground-level and head-height readings. The exact height matters less than using the same height at every comparison point and recording what you used.
Professional agricultural weather stations commonly measure temperature and humidity around 2 m above ground with radiation shielding. Your garden map does not have to imitate a formal weather station, because you are interested in the crop microclimate. But the same measurement principle applies: protect the sensor from direct radiation and keep the comparison standardized.
Do not compare a shaded sensor with an unshielded sensor in full sun
The difference may reflect the way the sensors are heated rather than a true difference in air temperature. Use comparable sensors, comparable shielding, and comparable heights. If you change the setup, note the change in your records rather than treating the new data as directly interchangeable with the old data.
Log long enough to see the daily cycle
A noon reading is only one frame of the day.
If your logger can record automatically, intervals around five to fifteen minutes are more than enough for a practical home-garden map. Let the sensors run through at least several complete day-night cycles. Three representative days can already reveal a lot when the weather is stable. A week is better when conditions are changing.
Do not focus only on the maximum temperature. Look at:
Morning warm-up: Which zone leaves the cool night first?
Afternoon peak: Which zone becomes hottest, and for how long?
Evening cool-down: Does a wall continue radiating heat after sunset?
Overnight minimum: Which zone becomes coldest before sunrise?
Duration: A short one-degree spike is different from a zone that remains four degrees warmer for five hours.
Map relative humidity as a pattern, not a target
Outdoor relative humidity is driven by the weather, but the garden can still create local differences. Dense hedges, fences, wet soil, shaded corners, and restricted airflow can keep one zone more humid than another. Exposed windy positions can dry quickly.
The most useful question is often not “What is the RH?” but “How long does this area stay moist after the rest of the garden begins drying?”
Walk the site early in the morning after dew or after rain. Touch leaves in different zones. Look at shaded surfaces. Check whether water remains on the soil or foliage. A location where moisture routinely persists can become more troublesome as cannabis flowers become denser later in the season.
You can also compare temperature and RH together. A cooler shaded corner may show higher relative humidity partly because cooler air reaches saturation more easily. That does not automatically mean the site contains dramatically more water vapor than the warmer zone. What matters horticulturally is that the cooler, more humid area may dry surfaces more slowly.
One corner is always 8 to 10% higher in RH than the middle of my yard. Is that enough reason to avoid it?
Question sent by: CedarRoute, via email.
Not by itself. Look at the full pattern. Is the corner also cooler, shaded, and slow to dry after rain? Does air move through it? Does the difference remain for hours or only appear briefly around dawn? A modest RH difference becomes more meaningful when it comes with persistent leaf wetness and poor airflow. Map the combination rather than rejecting a location from one percentage.
Map wind direction before wind speed
A hand-held anemometer is useful, but you can learn a lot before buying one. Watch lightweight vegetation, hang a short ribbon temporarily, or observe where leaves and branches move first when a breeze arrives.
Mark the direction of normal afternoon wind, then separately note where severe storm winds usually come from. They may not be the same.
Buildings and solid fences can create wind shadows and turbulence. A protected area may be calm close to the barrier but gusty a short distance away. Narrow gaps between structures can accelerate airflow. An exposed slope may remain breezy long after the center of the garden becomes still.
If you use an anemometer, take repeated readings rather than trusting one number. Wind changes from second to second. Compare zones during the same short window so that you are measuring site differences rather than changes in the regional wind.
Check drainage in more than one place
Soil maps and the general appearance of the garden cannot tell you exactly what happens below every planting position. Compaction, old construction fill, buried hard layers, slope, and soil texture can create very different infiltration patterns only a few meters apart.
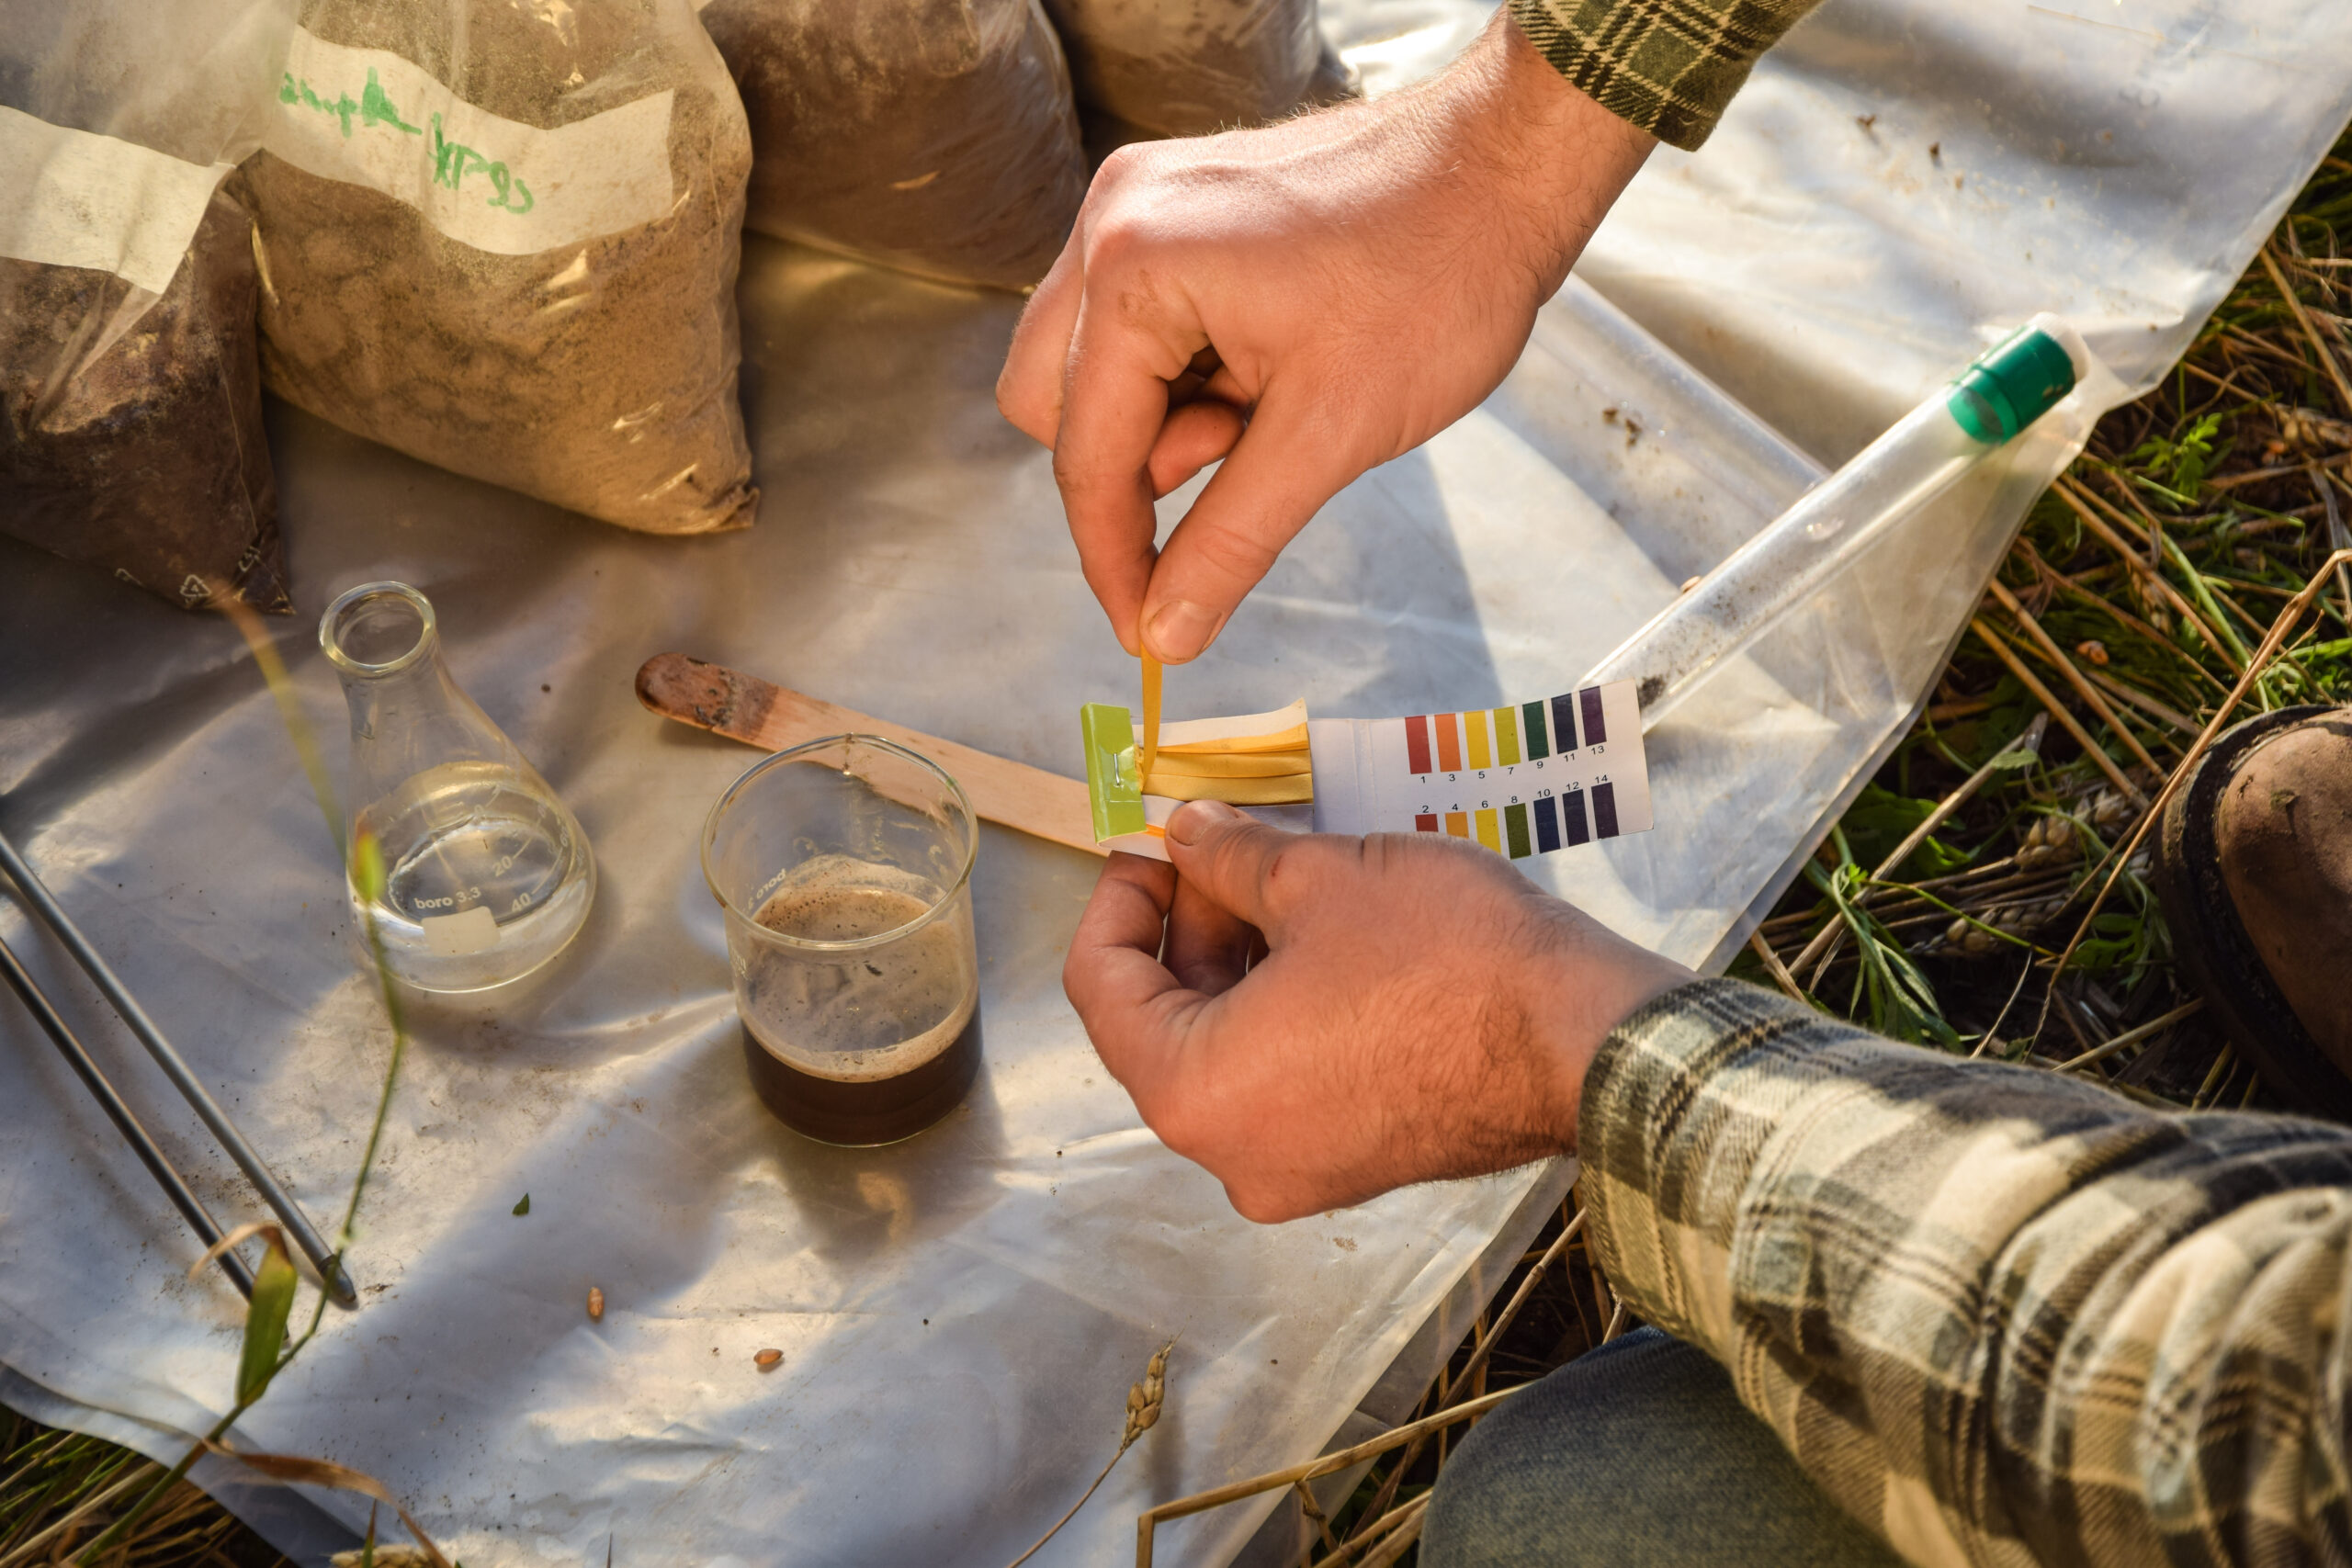
For candidate in-ground positions, dig a test hole and pre-wet the soil before timing how quickly a second fill drains. Extension infiltration procedures vary in depth and interpretation, but they share one principle: saturated soil needs to be tested under conditions that resemble a real wet period rather than judged from a dry surface.
For a practical garden screen, dig a hole around 30 cm or 12 inches deep, fill it, allow the first fill to drain, then refill and record what happens. If water remains for many hours or is still standing the next day, treat the zone as a drainage warning rather than assuming amendments will fix the underlying cause.
Also watch the garden during actual rain. A test hole tells you about infiltration. A storm shows you runoff, low spots, roof discharge, compacted paths, and where water enters from outside the growing area.
If native soil becomes part of the grow, the cannabis soil and growing media guide goes much deeper into texture, compaction, native-ground risk, drainage, and root-zone design.
Measure water access as part of the microclimate map
Water access is not climate, but it determines whether you can respond to climate.
A hot exposed zone may be perfectly usable when a hose reaches it easily. The same zone becomes a poor choice if every deep irrigation requires carrying water across the property.
Use a known-volume bucket to time the water source. Record how long it takes to fill. Check pressure at the far end of long hoses. Note whether the route becomes difficult after the canopy expands. If irrigation is automated, verify delivered volume at the actual endpoint rather than trusting a timer setting.
This is where the map starts connecting environment with labor. The best horticultural zone is not always the best operational zone.
Find cold pockets with paired measurements
Cold air is denser than warm air and tends to move downslope when the night is clear and calm. Low areas, the base of slopes, and places where fences or vegetation block cold-air drainage can become frost pockets.
You can test this without waiting for a killing frost. Choose a cool, clear night and compare the overnight minimum in the suspected low point with a slightly higher open location. Repeat the comparison more than once.
If the low zone repeatedly runs colder, mark it. The difference may be small through summer and become important near the edges of the season.
Check contamination when the map includes native ground
Microclimate does not make contaminated soil safe.
If the property has a history of industrial use, demolition, workshops, burn piles, old treated timber, heavy road exposure, dumped fill, or unknown chemical use, include that history on the base map. If a questionable area is also your horticulturally best zone, test the soil or use a clean separated root zone rather than ignoring the history.
Cannabis sativa is known to take up certain metals and has been studied for phytoremediation. Vigorous growth therefore cannot be used as proof that contaminated soil is acceptable for consumable flower.
Do
Compare zones using the same method
Use the same sensor type, shielding, measurement height, observation times, and notation so that differences on the map represent the garden rather than inconsistent measurement.
Avoid
Mixing incompatible readings
Do not compare a sensor on paving with one inside foliage, a shaded thermometer with one in direct sun, or a soil-temperature reading with an air-temperature reading as if they describe the same environment.
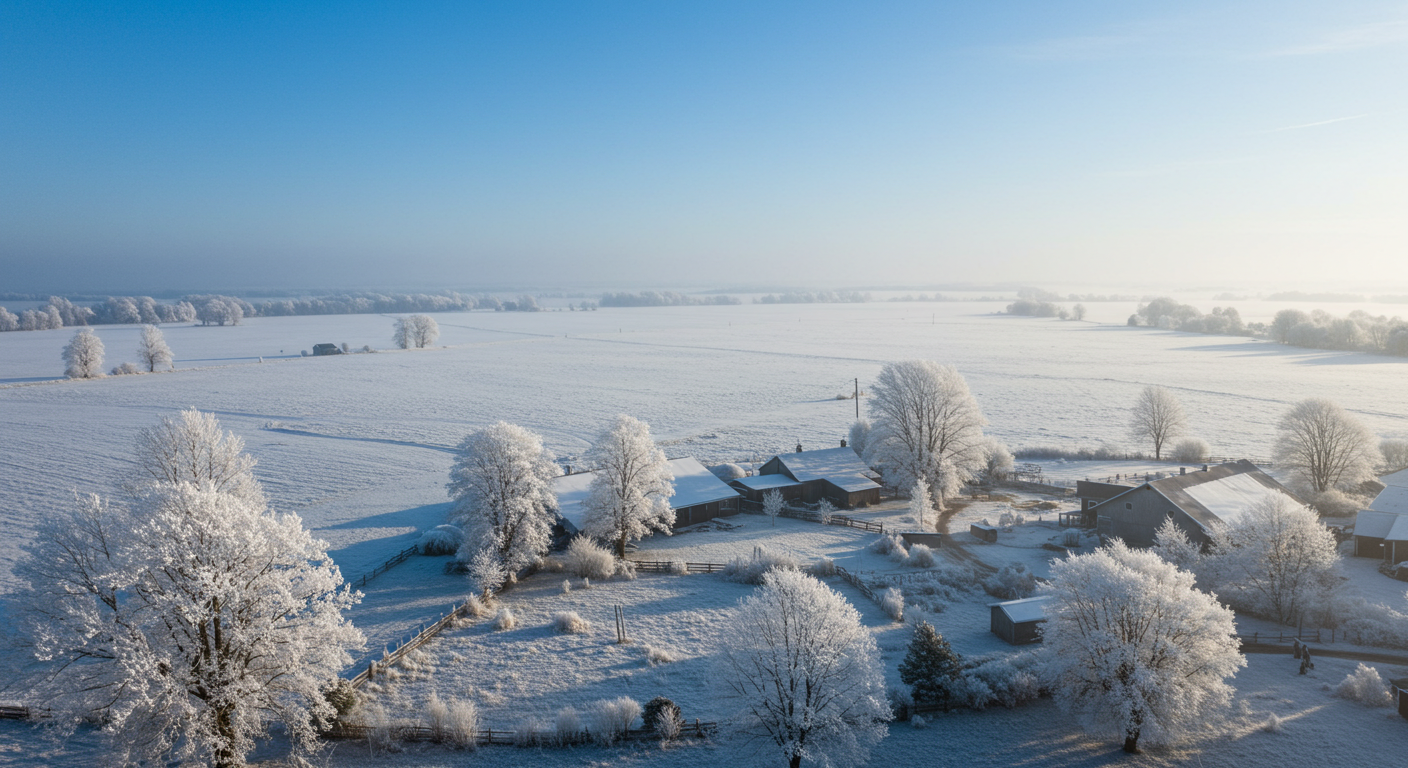
Seasonal timing: latitude, photoperiod, weather windows, and cultivar behavior
A microclimate map is never finished in one afternoon because the garden itself changes.
The sun moves higher and lower through the sky. Deciduous trees gain and lose leaves. Soil dries. The plant canopy expands. Flowering changes canopy density. Autumn nights become longer. A fence that barely matters in June can cast useful or harmful shade in September.
Build at least four seasonal snapshots
For a first-year map, four checkpoints are especially useful.
Pre-season: before permanent outdoor placement, when you are choosing the site.
Early to midsummer: when sun angle is high and heat load becomes easier to see.
Flowering transition: when the canopy begins changing structure and moisture risk becomes more important.
Late season: when cold nights, dew, rain, and reduced solar intensity begin changing the map again.
You do not need to repeat every test from zero each time. Revisit the variables most likely to have changed: shade, heat, overnight minimums, drying time, wind exposure, and water demand.
Latitude changes both day length and microclimate timing
Latitude changes the seasonal path of the sun and the length of summer days. At higher latitudes, day length can be very long around midsummer and then shorten rapidly toward autumn. Closer to the equator, the seasonal change is smaller.
This affects the map in two ways. First, it changes where and when shadows fall. Second, it changes the photoperiod signal experienced by photoperiod-sensitive cannabis.
Research on Cannabis sativa has shown that critical photoperiod differs among cultivars. In some tested hemp cultivars, differences as small as fifteen minutes influenced flowering initiation. Civil twilight can also contribute biologically effective light. That is why a microclimate map should not treat “12/12” as the universal outdoor date when flowering begins.
Map nighttime light as well as daytime sun
This is one variable many garden maps forget.
A security light, porch light, streetlight, greenhouse spill, or neighboring fixture may illuminate one part of the garden during the dark period. Photoperiod-sensitive cannabis responds to day and night length, so repeated artificial light can matter depending on intensity, timing, cultivar, and proximity.
Walk the site after dark. Give your eyes several minutes to adjust. Mark direct light sources and which zones receive them. Do not assume a faint glow is automatically harmful, but do not ignore a bright lamp shining directly into the canopy either.
My warmest spot is beside the house, but a motion light turns on there at night. Should I still use it?
Question sent by: Olivia Carter, via contact form.
Map both benefits and risks. The wall may provide useful warmth and early-season protection, while the light becomes a separate photoperiod variable. Check how directly the lamp hits the canopy and how often it activates. If the location is otherwise good, repositioning or shielding the light in a lawful and safe way may solve the conflict. Do not choose a warm zone and then ignore a repeated nighttime light source simply because it is convenient.
Cultivar behavior changes how much microclimate margin you need
A cultivar that finishes early may avoid the coldest, wettest part of autumn. A later cultivar can spend more time in the exact conditions where your map shows persistent dew, lower sun, and a colder overnight minimum.
Likewise, a cultivar that builds very dense flowers can make a humid, slow-drying pocket more consequential than it would be for a more open inflorescence structure. Genetics does not erase the microclimate. It changes how strongly the plant reacts to it.
This is where site mapping becomes more useful than generic cultivar descriptions. “Mold resistant” does not mean a dense flower can sit wet every morning without consequence. “Heat tolerant” does not mean root-zone temperature is irrelevant beside a reflective wall.
Weather windows reveal conditions that averages hide
Try to capture at least one representative hot spell, one wet period, and one cool clear night if your season includes them.
The garden may look uniform during mild weather. Stressful weather separates the zones.
During a heatwave, the paved edge may become much hotter than the soil bed. During several days of rain, the fence corner may remain wet long after the open center dries. On a clear cold night, the low spot may become the frost pocket you never noticed in summer.
Those are the maps worth keeping.
| Season checkpoint | Plant / site status | Main mapping task | Risk / check |
|---|---|---|---|
| Pre-season | Site selection before large canopy growth | Sun path, baseline temperature/RH, drainage, water access, legal use | Do not choose a site from one midday visit |
| Early summer | Faster growth and rising water demand | Heat load, afternoon shade, wind, container/root-zone heating | Walls and paving may now behave differently |
| Flowering transition | Canopy density and nighttime length increasing | Night lighting, humidity retention, wet-canopy drying, airflow | Microclimate inside the canopy may diverge from open air |
| Late season | Cooler nights, lower sun angle, heavier dew or rain in many climates | Cold pockets, morning drying, changing shade, wind exposure | Finishing window may depend on the worst zone, not the average garden |
Practical setup/response plan with materials, placement, inspection points, and a backup option
Once the first measurements are collected, turn them into a map you can actually use.
Do not make the map too complicated. If it takes twenty minutes to interpret, you will stop using it. The best field map is one you can glance at before a heatwave or wet week and immediately know which zone deserves attention.
Use a simple three-layer map
I like to separate the information into three layers.
Layer 1: fixed site features. Walls, fences, trees, slope, paving, water source, drains, gates, and buildings.
Layer 2: environmental zones. Hot zone, shaded zone, windy zone, cold pocket, slow-drying zone, fast-drying zone.
Layer 3: operational notes. Plant positions, sensor points, irrigation route, support locations, access route, and backup position.
You can combine all three on one page with different symbols. You do not need software.
Create a reference station and comparison stations
Keep one sensor or observation point in the reference zone through the season if possible. Move a second logger between comparison zones if you do not own several.
That rotating method works well because it gives you paired data without requiring a sensor in every corner. For example, run Reference + Zone B for three days, then Reference + Zone C for three days. The reference continues recording while the mobile logger moves.
The shared reference lets you account for changing weather. If both sensors are two degrees hotter on the second week because the regional weather changed, you can still see whether the difference between the zones remained stable.
Keep sensor placement boring and consistent
Consistency is more valuable than clever placement.
Mount temperature/RH sensors at the same height and in the same style of radiation shield. Do not attach one directly to a heat-absorbing wall while the other hangs in open air. Keep enough space for air to circulate around the shield. Protect equipment from irrigation, pets, mowing, and normal yard work.
If you want to understand the near-canopy environment later in the season, add a separate canopy observation rather than moving the original reference point without recording the change. The reference only becomes useful over time if its meaning stays stable.
Use plant-height measurements carefully
Standard weather stations intentionally avoid local obstructions because they are trying to measure representative weather. A cannabis microclimate map has a different goal. Sometimes you want the exact environment beside a fence or within the future canopy.
That is fine, but label the measurement honestly.
“Air temperature at 1.2 m in Zone C beside west wall” is useful.
“Garden temperature” is much less useful because it hides the placement that created the number.
Add root-zone measurements as a second system
Air microclimate and root-zone microclimate are connected, but they are not interchangeable.
A sunny zone can have hot air while deep native soil remains relatively stable. A black container can produce a much hotter root environment than the same air temperature around an in-ground plant. A shaded heavy-clay area can remain cool and saturated long after the air warms.
If root-zone differences are likely to matter, add soil temperature and moisture checks at consistent depths and positions. Do not compare a shallow probe beside an emitter with a deep probe far from irrigation and treat the difference as a site effect.
For watering decisions, the cannabis watering basics guide explains how container size, substrate, weather, and plant demand change the meaning of a dry surface or wet reading.
Create a zone score without pretending it is scientific
A practical rating system can help you make the final placement decision. Score each candidate zone from 1 to 3 for the variables that matter most to your site.
| Variable | What a useful score asks |
|---|---|
| Sun | Does the zone receive enough direct light through the part of the season when the plant will actually occupy it? |
| Heat | Does it remain manageable during the hottest realistic weather, including reflected and stored heat? |
| Moisture | Do leaves and the root zone dry at a reasonable rate without persistent saturation? |
| Wind | Is there enough air movement without repeated destructive exposure? |
| Cold | Does the zone avoid being the consistent overnight low point or frost pocket? |
| Water / access | Can the plant be irrigated, inspected, supported, and reached through the full season? |
| Legal / neighbor fit | Can the site be used lawfully without creating a preventable access, visibility, or boundary problem? |
The score is not a biological formula. It simply forces you to compare the tradeoffs instead of falling in love with the sunniest corner.
Build a backup position before you need it
If the plant is in a movable container, identify a temporary backup location for exceptional weather. It might be a place with afternoon shade during a severe heat event or a more sheltered position for extreme wind.
Do not make the backup location a permanent dark, enclosed storage area. It is an emergency tool, not a second grow site.
For in-ground plants, the backup is usually not relocation. It may be wind support, drainage correction, temporary weather protection, additional irrigation capacity, or a plan to increase inspections during a known risk window.
Pro Tip: Put your emergency plan on the map. “Temporary shade available here,” “wind support stored in shed,” “hose reaches this point,” and “low zone floods after heavy rain” are much more useful notes than trying to remember them during bad weather.
Can I make a useful map with only one temperature logger?
Question sent by: Sophie, via X.
Yes, but keep a consistent reference another way. You can compare the logger with a nearby official weather station while rotating it between zones, or use a second simple thermometer at the reference point. The cleanest low-cost method is two loggers: leave one fixed and move the other. If you only have one, measure each zone for comparable weather windows and avoid comparing a cool cloudy week in Zone A with a hot sunny week in Zone B as if the site caused the whole difference.
Failure modes: stagnant air, trapped moisture, heat load, frost, wind damage, water shortage, security, or neighbor impact
A microclimate map is useful because it shows where failure is likely to start. But the map itself can fail too.
Before we look at the environmental risks, it helps to understand the measurement mistakes that create false confidence.
Failure mode: the one-day map
A single sunny afternoon can identify obvious shade and heat patterns. It cannot describe the season.
If you map only on a calm mild day, you may completely miss the site’s wind corridor. If you map only during dry weather, the low corner may look perfect. If you map only in midsummer, the frost pocket remains invisible.
The correction is simple: use the first map as a baseline, then deliberately revisit the site during different weather windows.
Failure mode: sensor bias mistaken for microclimate
Direct solar heating, attachment to walls, different sensor models, low battery, water ingress, or poor shielding can all create apparent differences that are not real.
Before deployment, place your sensors side by side in the same shaded, ventilated location for several hours or overnight. If one reads consistently warmer or more humid than the others, note the offset or do not use it for fine comparisons.
This simple cross-check is one of the best ways to prevent a bad map.
Failure mode: stagnant air
Stagnant air rarely means “zero wind.” It means the canopy does not exchange humid air efficiently enough for the conditions.
A solid fence, dense hedge, wall, or group of large plants can create sheltered pockets. Early in the season that may look desirable. Later, dense foliage can reduce movement further.
Map stagnant zones after rain or dew. If the inner canopy in one position remains wet while comparable foliage in another zone has dried, that difference belongs on the map.
Failure mode: trapped moisture
Persistent moisture can come from more than RH. Poor drainage, nearby irrigation, roof runoff, shaded soil, mulch depth, dense vegetation, and cold surfaces can all contribute.
Do not respond to a damp zone only by pruning the cannabis plant. First identify whether the environment itself is keeping the area wet.
Do not “fix airflow” by creating a harsher wind problem
Removing every windbreak or moving plants into the most exposed part of the property can trade slow drying for branch damage and rapid root-zone water loss. The goal is usable air movement, not maximum wind speed. Map both drying behavior and mechanical exposure before changing the site.
Failure mode: heat load that does not appear in the forecast
Regional air temperature may be moderate while a wall, paved surface, or dark container creates severe local heating.
Look for repeated afternoon patterns: leaf droop despite adequate root moisture, one-sided scorching, fast container drying, or a zone that remains unusually warm into the evening.
Then separate air temperature from surface and root-zone temperature. A hot wall can radiate onto the plant even when shielded air temperature is only moderately different from the reference.
Failure mode: frost pocket
Frost pockets usually become most visible under clear, calm conditions when radiational cooling is strong. Cold air flows downslope and can collect behind barriers.
If your low sensor is repeatedly the overnight minimum, treat that as a seasonal risk even if the summer average looks fine. A difference of only a few degrees can matter near the threshold of a damaging cold event.
Failure mode: wind damage
Map wind before a storm and after one.
Look for root-ball movement, support poles leaning, branches rubbing, snapped shoots, and containers shifting. If damage appears in one zone repeatedly, the map has identified a structural problem, not bad luck.
Remember that wind load increases as the canopy grows. An exposed area that is harmless around a small plant may become risky later.
Failure mode: water shortage in the hottest zone
One of the most practical uses of the map is predicting where irrigation demand will rise first.
A hotter, windier, sunnier container may dry much faster than a shaded plant only a few meters away. If both receive the same irrigation schedule, the map can explain why one repeatedly wilts while the other stays wet.
Do not solve that difference by automatically increasing water everywhere. Adjust irrigation to the actual zone or root-zone behavior.
Failure mode: security and neighbor impact
The horticulturally best location may not be the socially best one.
A tall plant in the sunniest open zone may become visible from public or neighboring areas. A security screen may create shade. A motion light may affect nighttime exposure. A plant beside a property boundary may create odor or access concerns later in flowering.
Mark those constraints early. They are part of the site even though they do not appear on a thermometer.
My sunniest zone is also the windiest. Which measurement should win?
Question sent by: Lukas Becker, via email.
Neither wins by itself. Check whether the wind is manageable with support or a permeable windbreak and whether moving inward would sacrifice a little light or most of the day’s direct sun. A useful map shows the tradeoff. If the sunny zone repeatedly causes structural damage or impossible water demand, the light advantage may not be worth it. If the wind is moderate and support solves it, the zone may still be the better choice.
Use a red-yellow-green layer for the failures
Once you know the patterns, color the map.
Green means the zone behaves predictably under normal conditions.
Yellow means a known limitation needs monitoring or a management response. Examples include strong afternoon heat, moderate wind exposure, or slow morning drying.
Red means the zone creates a recurring high-risk problem: standing water, severe frost pooling, destructive wind, suspected contamination, no water access, or a legal/security conflict.
This turns the map into a decision tool rather than a weather diary.
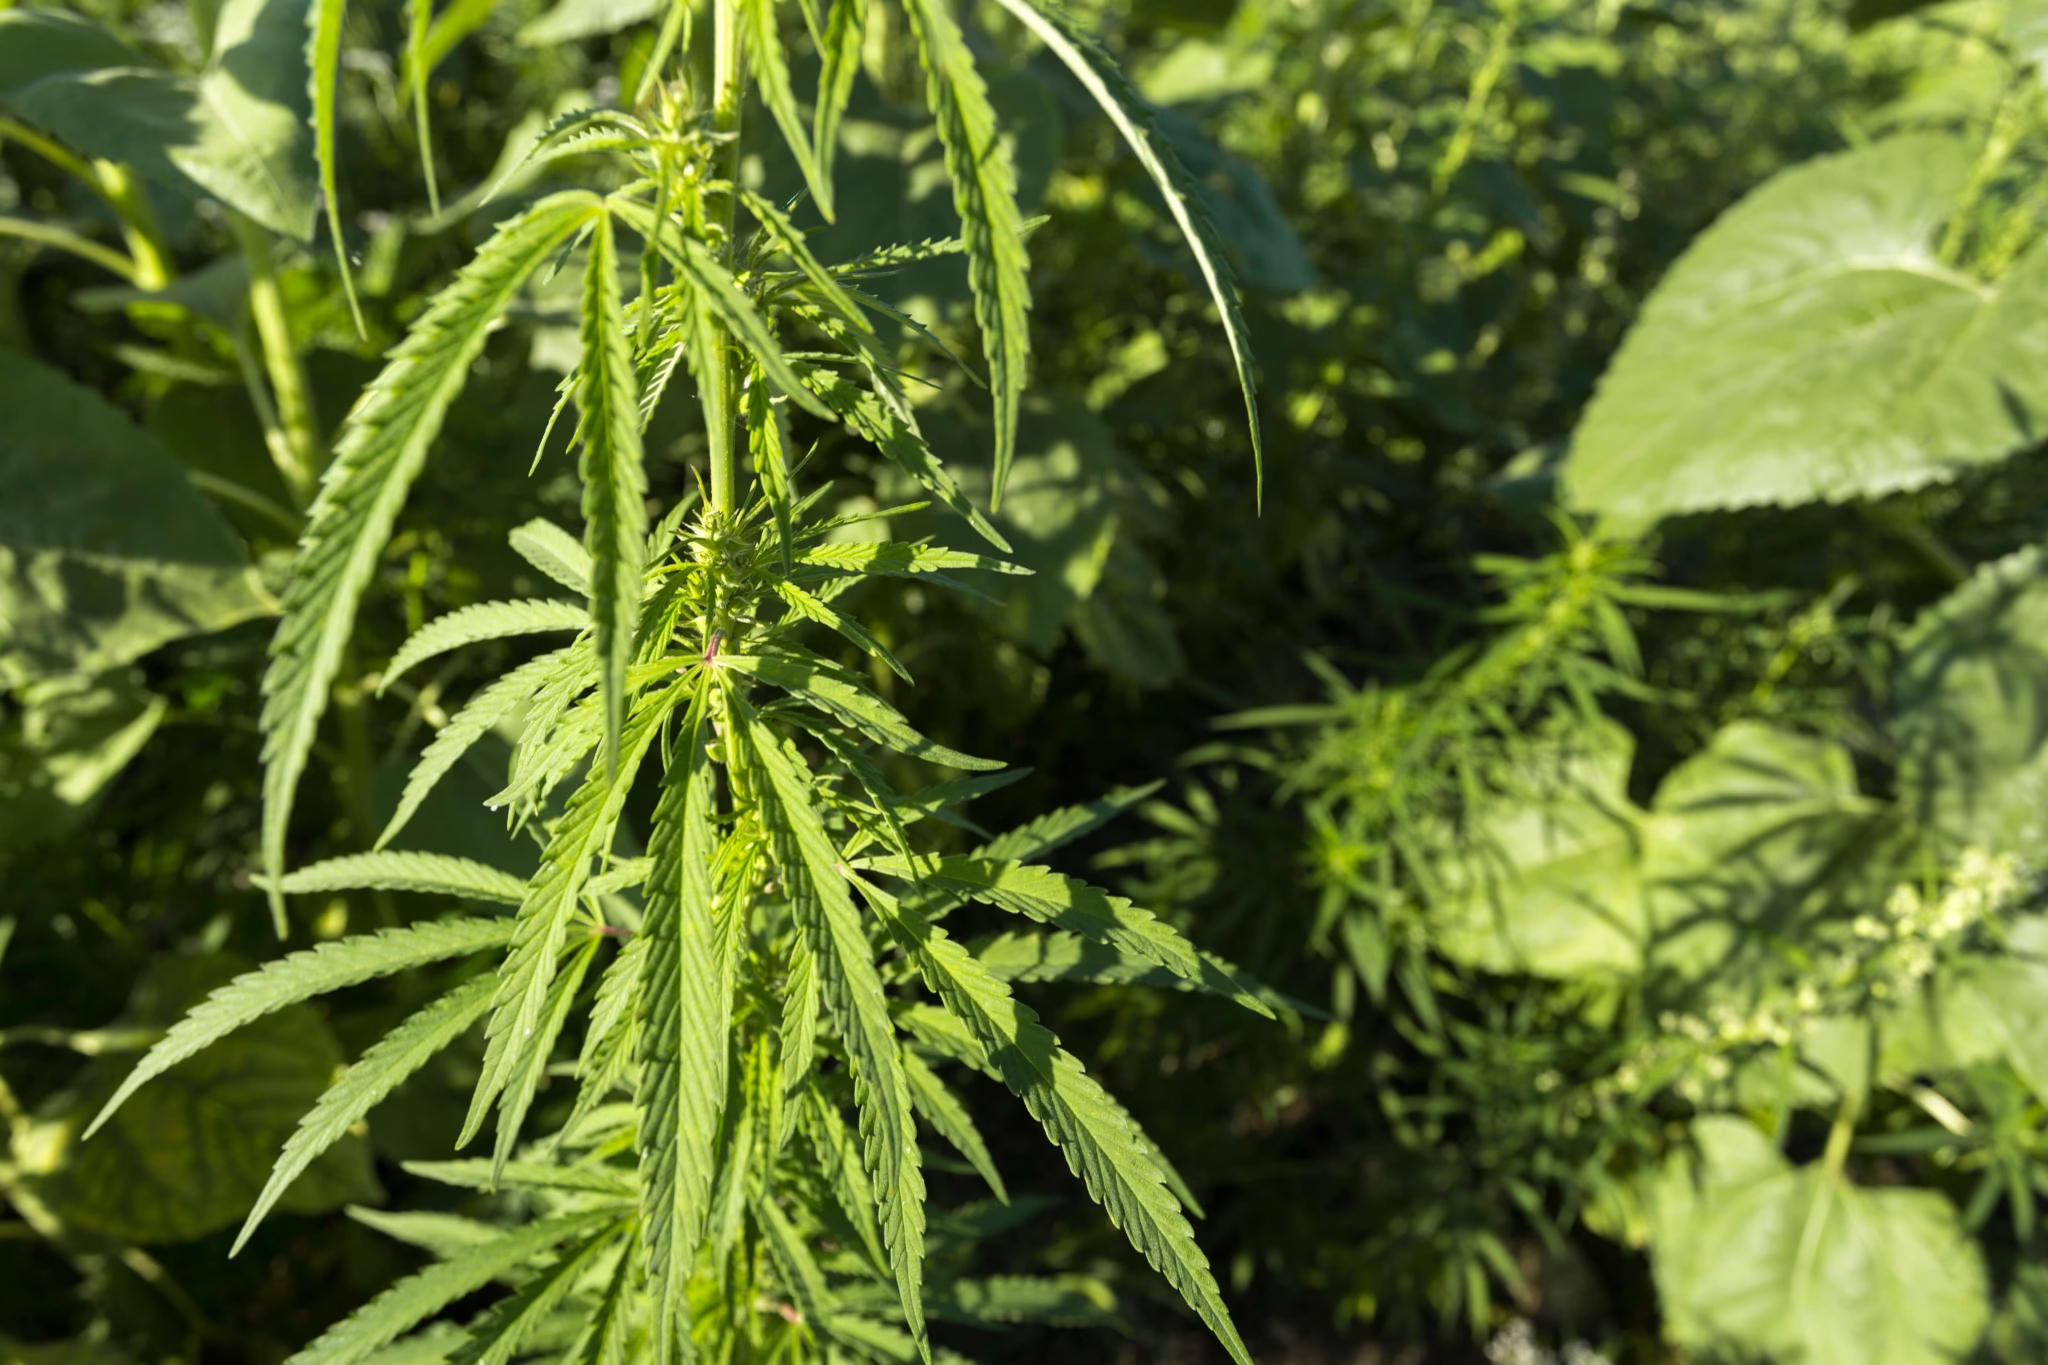
Legal/safety boundary without guessing local rules or recommending dangerous traps
Microclimate mapping should never become a method for finding a hidden unauthorized grow site.
This resource assumes cultivation occurs where it is lawful and where you own the property or have explicit permission to use it. Rules can vary by country, state, province, municipality, rental agreement, or property association, and they can change over time.
Check the location before optimizing it
Before installing permanent sensors, irrigation, fencing, or plant supports, confirm that the garden location itself is permitted.
Depending on jurisdiction, outdoor home cultivation rules may address plant count, visibility, locked access, age, setbacks, common areas, rental property, or outdoor structures. A microclimate map cannot answer those questions.
Use current official sources. If the rule is unclear, verify it rather than relying on an old search result or forum comment.
Keep sensors and wires from becoming hazards
A small garden can quickly accumulate stakes, cables, probes, ribbons, irrigation lines, and temporary test equipment. That equipment should not create trip hazards or sharp obstacles for children, pets, visitors, or the grower.
Secure cables. Mark stakes clearly. Protect low sensors from mowing equipment. Keep electrical equipment rated for outdoor use and away from standing water.
Do not use dangerous traps as “security mapping”
If the garden needs access control, use lawful passive security such as fencing, gates, locks, appropriate lighting, and cameras where permitted.
Do not install tripwires, concealed sharp objects, improvised electrification, chemical irritants, or other devices intended to injure someone entering the area. Those methods can harm children, animals, emergency personnel, authorized visitors, or you.
Safety Note: A safe garden map includes emergency access. Do not place containers, fencing, stakes, or irrigation lines in a way that blocks exits, utility access, fire routes, or normal movement through the property.
Keep contamination testing separate from legal permission
A legal garden can still sit on unsuitable soil. A clean horticultural site can still be legally unusable. Treat those as separate filters.
First ask: can I lawfully grow here?
Then ask: is the physical environment suitable?
Then ask: can I manage the risks I mapped?
Keeping those questions separate prevents one favorable answer from masking a serious problem in another category.
Pre-season and weekly checklist that turns the article into a repeatable field procedure
The final map should be something you can repeat next year, not a one-time project.
Use the following procedure as a field routine. It begins before planting and becomes progressively lighter once you understand the site.
Step 1: draw the site and mark the likely contrasts
Before measuring anything, sketch the property. Mark north, walls, fences, trees, slope, paving, water sources, drains, and candidate plant positions.
Circle the zones you expect to behave differently. Choose one open reference point.
Verification: You should be able to explain why each measurement point exists. If two points are nearly identical in exposure, one may be unnecessary.
Step 2: cross-check the sensors
Place temperature/RH loggers side by side in the same protected location before spreading them around the garden.
Let them record for several hours or overnight.
Verification: Readings should be reasonably close given the stated accuracy of the devices. If one sensor has a persistent offset, record it or replace that sensor before interpreting small zone differences.
Step 3: map direct sun for one full day
Record direct sun, partial obstruction, and shade at regular intervals. Note the source of major shade.
Verification: Repeat the map on another clear day if the site is borderline or if trees and neighboring vegetation will change substantially.
Step 4: log temperature and RH through day and night
Deploy the sensors at standardized heights and with comparable radiation shielding. Let them run through several complete cycles.
Verification: Compare zone differences at the same timestamps. Do not compare separate days without accounting for different regional weather.
Step 5: map wind and drying behavior
Observe normal wind direction and note where structures accelerate or block flow. After rain or heavy dew, record which zones dry first and last.
Verification: Check the pattern on more than one event. A single gust or one unusual storm should not define the entire wind map.
Step 6: test drainage and root-zone behavior
Use repeat-fill infiltration checks in candidate in-ground positions. During real rain, watch runoff and ponding. If containers will be used, compare how quickly the intended pot positions heat and dry.
Verification: The result should match what happens after actual irrigation or rain. If the test hole drains well but the site still ponds, surface flow or compaction elsewhere may be the real problem.
Step 7: compare a suspected cold pocket with higher ground
On a cool, clear, calm night, log overnight minimums in the low zone and reference zone.
Verification: Repeat the comparison. A consistent temperature difference is much more meaningful than one isolated cold night.
Step 8: convert the measurements into management notes
Do not stop at “Zone B is hotter.” Write what that changes.
For example:
“Zone B: strong afternoon sun, 2-4°C warmer than reference on clear days, faster container dry-down. Good light, requires larger moisture buffer and heat check.”
Or:
“Zone D: coolest overnight point, slow morning drying, standing water after heavy rain. Avoid for dense late-flowering plants unless drainage and airflow are changed.”
This is the step that turns data into a grow decision.
Cannabis Garden Microclimate Mapping Checklist
- Confirm that the proposed growing area is legal and permissioned before optimizing it.
- Draw a base map with north, slope, walls, fences, trees, paving, water, drains, and access routes.
- Choose one open reference point and several genuinely different comparison zones.
- Cross-check temperature/RH sensors side by side before deployment.
- Use comparable radiation shielding and the same measurement height at each air-monitoring point.
- Record direct sun through a full clear day and repeat if seasonal shade will change.
- Log temperature and RH through complete day-night cycles rather than taking only midday readings.
- Compare morning warm-up, afternoon peak, evening cool-down, and overnight minimum.
- Observe normal wind direction and where walls, fences, or gaps create shelter or turbulence.
- Check which zones remain wet longest after dew, rain, or irrigation.
- Test drainage at candidate in-ground positions and observe the site during real rainfall.
- Measure water access and actual flow at the places where plants may be positioned.
- Compare suspected frost pockets with slightly higher ground on cool clear nights.
- Review soil history and test questionable native ground for contamination before use.
- Walk the site after dark and mark direct artificial light reaching potential plant zones.
- Repeat the map during midsummer, flowering transition, and late-season weather.
- Update the map when the canopy, nearby vegetation, screening, or structures change.
- Turn each important measurement into a practical note about placement, watering, support, or weather response.
- Mark recurring limitations as green, yellow, or red so the map remains easy to use.
- After changing the site, repeat the relevant measurement and verify that the correction worked.
Use the weekly recheck as a short walk, not a new research project
Once the baseline exists, the weekly routine can be quick.
Walk the garden at roughly the same time each week. Check whether shade has moved, vegetation has closed around the canopy, supports have changed airflow, the root zone is drying faster, or a new weather risk is approaching.
Then look at the coming forecast and ask which mapped zone is most likely to struggle.
During a hot week, that may be the west wall.
During prolonged rain, it may be the low sheltered corner.
During an early frost warning, it may be the bottom of the slope.
The map should help you decide where to inspect first.
Re-measure after every meaningful correction
If you move a container away from a wall because the zone was too hot, compare the new afternoon temperature and dry-down.
If you open a privacy screen to improve drying, inspect the canopy after the next dew event.
If you add a windbreak, watch whether branch movement decreases without creating a stagnant pocket.
If you improve drainage, observe the next heavy irrigation or rainfall rather than assuming the construction worked.
The correction is only finished when the map shows that the environment changed in the direction you intended.
Keep the map for next season
By the end of one outdoor season, your map becomes much more valuable than the first version.
You now know where the garden heats first, where water sits, where the morning sun arrives, which area becomes a frost pocket, how the wind behaves around a full-sized canopy, and how seasonal shade changes after nearby vegetation matures.
Do not throw that information away.
Next season, start with the old map and update it. A tree may have grown. A fence may have changed. A neighboring structure may create new shade. But you are no longer starting from a weather app and a guess.
You are starting from measured behavior on your own site.