
Grow Light Electricity Cost Calculator
Grow Light Electricity Cost Calculator
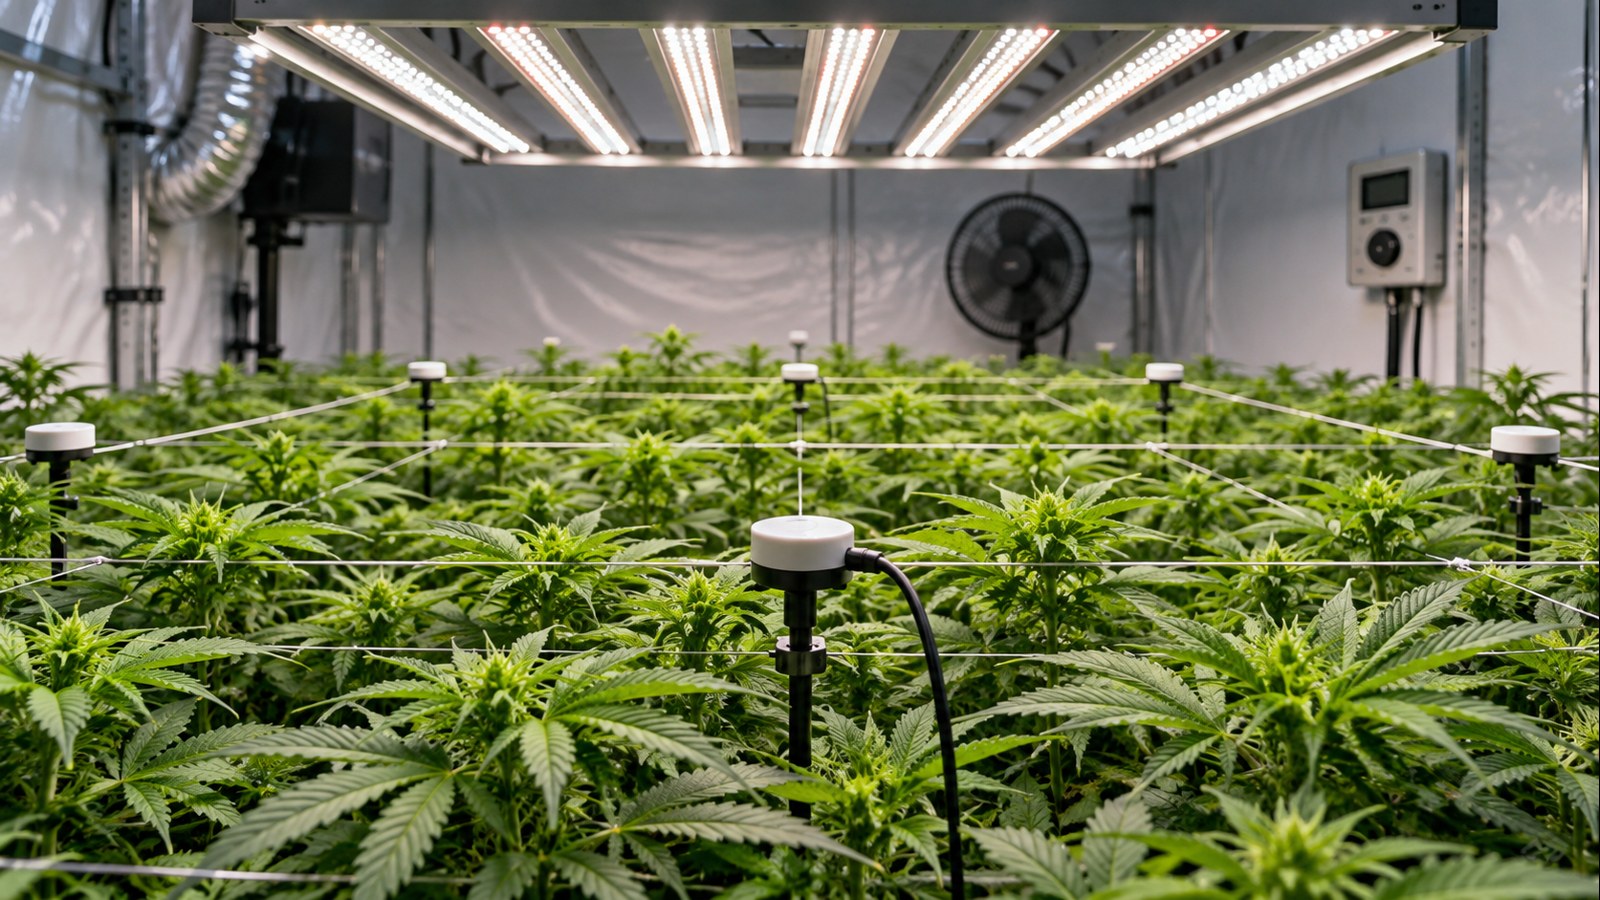
Artificial lighting represents the single largest ongoing operational expense in an indoor cannabis cultivation facility. While nutrients, growing media, and genetic stock require periodic investments, photons demand continuous electrical power every hour the fixture is energized. Despite this reality, many cultivators budget their operating expenses using simplified arithmetic: multiplying the advertised wattage on a retail box by an estimated residential electric rate. The resulting utility bill is frequently 40% to 80% higher than projected.
Accurately calculating grow light electricity costs requires looking past commercial marketing claims. You must identify the true power draw at the wall receptacle, account for solid-state driver efficiency and power factor, factor in photoperiod transitions between vegetative and flowering stages, and decode the complex structure of your utility bill: including transmission charges, distribution surcharges, regulatory fees, and time-of-use peak penalties.
Furthermore, indoor plant cultivation operates strictly under the first law of thermodynamics: every single watt of electrical power delivered to a luminaire eventually converts into sensible or latent heat within the cultivation space. That thermal energy must be continuously extracted by exhaust ventilation or conditioned air systems, adding a secondary electrical penalty that basic online calculators ignore.
This guide establishes a complete, evidence-based calculation framework for indoor cannabis cultivators. It demonstrates how to determine your fixture’s true electrical footprint, model cycle-long power budgets, evaluate production efficiency in grams per kilowatt-hour, and implement tactical scheduling changes that substantially reduce monthly power expenses without compromising flower density, cannabinoid potency, or terpene retention.
The Core Formula: Translating Wall Watts into Kilowatt-Hours
Electrical utilities do not charge consumers for power; they bill for energy. Power is the instantaneous rate at which electricity is consumed, measured in watts (W) or kilowatts (kW). Energy represents that power sustained over time, quantified commercially in kilowatt-hours (kWh). One kilowatt-hour equals 1,000 watts drawn continuously for exactly one hour, or any mathematical equivalent such as a 500-watt fixture operating for two hours.
Kilowatt-Hour (kWh)
The standard commercial billing unit of electrical energy, representing 1,000 watts of electrical power expended continuously over a period of one hour (equivalent to 3.6 megajoules). Electric utilities compute customer consumption and baseline rates strictly per kilowatt-hour.
To calculate the electricity consumed by any grow light, apply the standard energy consumption equation:
Tip: Daily Energy Consumption (kWh) = [True Wall Draw in Watts x Daily Operating Hours] / 1,000
Once daily kilowatt-hours are established, calculating the monetary expense requires multiplying that energy figure by your comprehensive electric rate:
Daily Operating Cost ($) = Daily Energy Consumption (kWh) x Electric Rate ($/kWh)
For example, consider a verified 680-watt LED luminaire operating during the vegetative stage on an 18-hour daily photoperiod, in an area where total electricity costs $0.18 per kWh:
Step 1: Calculate daily kilowatt-hours: (680 W x 18 hours) / 1,000 = 12.24 kWh per day.
Step 2: Calculate daily monetary cost: 12.24 kWh x $0.18 = $2.20 per day.
Step 3: Project monthly cost (30-day baseline): 12.24 kWh x 30 days = 367.2 kWh per month. At $0.18 per kWh, the monthly lighting expense equals $66.10.
Remember: Utility meter reading schedules rarely align with clean 30-day calendar months. Billing cycles typically fluctuate between 28 and 33 days. When auditing a specific power bill, calculate using the exact number of service days stated on your statement rather than an arbitrary 30-day assumption.
While the basic equation is mathematically simple, errors arise when cultivators enter incorrect variables into the formula. The most frequent errors involve misidentifying the fixture’s true wall wattage, ignoring ballast conversion losses, and underestimating the actual cost per kilowatt-hour by reading only the generation subtotal on a utility invoice.
Actual Wall Draw vs Marketing Equivalent Claims
The greatest point of confusion for indoor growers stems from retail marketing terminology. Budget and direct-to-consumer LED manufacturers frequently brand their fixtures with names such as “1000W LED,” “2000W Pro,” or “Double-Ended HPS Replacement.” In reality, these numbers represent theoretical marketing comparisons rather than physical electrical consumption.
Never Size Electrical Circuits or Operating Budgets on Marketing Numbers
A fixture advertised as a “1000W equivalent LED” may draw as little as 130 to 185 watts of true power from the wall receptacle. Conversely, an industrial 680-watt commercial bar fixture operating in high ambient room temperatures can pull 710 to 725 watts due to driver heat derating. Always verify the active wattage specified on the driver certification plate or measure it with an inline power meter before calculating costs or loading branch circuits.
To establish an accurate calculation, you must understand the distinction between diode potential and active wall draw. A low-cost fixture may contain one hundred 10-watt semiconductor diodes, allowing marketing copy to claim “1,000 watts of optical capacity.” However, driving diodes at their maximum theoretical threshold destroys optical efficiency and creates rapid thermal degradation. Manufacturers deliberately run these diodes at 10% to 20% of their rated capacity to extend component lifespan, resulting in an active draw of only 120 to 150 watts.
Conversely, professional commercial fixtures built with high-efficacy chips specify their true power draw directly on the power supply. A standard commercial fixture rated at 680W indicates that the internal driver delivers approximately 640 watts of direct current (DC) to the light bars while consuming approximately 680 watts of alternating current (AC) from the branch circuit.
Do
Measure Active Receptacle Power with a Kill A Watt Meter
Plug an inline digital energy monitor between your wall outlet and light timer to record the exact active wattage across every dimming stage under real garden temperatures.
Avoid
Rely on Equivalent Wattage Claims or Nominal Ratings
Do not calculate electric bills using advertised model numbers, equivalent bulb comparisons, or theoretical diode tallies printed on retail packaging.
Another critical variable is driver conversion efficiency. Solid-state horticultural luminaires do not operate on raw 120V or 240V alternating current from your household wall outlet. They require dedicated drivers (such as Mean Well, Inventronics, or Sosen) to rectify AC voltage into regulated direct current. High-efficiency commercial drivers achieve 92% to 95% electrical efficiency, but cheaper power supplies operate around 85% to 88%. That missing 5% to 15% is lost as immediate parasitic heat before the electricity ever reaches a single light-emitting diode.
Pro Tip: Power factor (PF) measures how effectively a fixture utilizes current. Quality horticultural luminaires maintain a power factor of 0.95 to 0.99. A low power factor (below 0.85) draws higher total amperage (apparent power in volt-amps) through your home circuit breakers without generating additional light, increasing heat in branch wiring and potentially tripping circuit breakers even when active wattage seems acceptable.
Dimming non-linearity also impacts calculated costs. When an LED luminaire features a manual potentiometer or digital control port, dimming the fixture to 50% does not always reduce wall draw by exactly 50%. Switch-mode power supply drivers have an efficiency curve that typically peaks between 80% and 100% load. Operating a fixture at 25% or 50% can slightly reduce driver conversion efficiency, meaning a 680-watt light dimmed to the 50% dial setting might pull 355 to 365 watts at the wall receptacle.
Photoperiod Schedules: Calculating Veg, Flower, and Autoflower Costs
Cannabis is a photoperiodic plant that alters its developmental physiology in response to uninterrupted darkness. Because vegetative and generative stages require substantially different daily photoperiods, your lighting electricity costs fluctuate dramatically across the lifecycle of a single crop. Modeling a grow room budget requires segmenting the production schedule into distinct lighting phases.
The Vegetative Stage: High Daily Hours, Moderate Intensity
During vegetative development, photoperiod cannabis requires long daylight hours to prevent premature floral initiation. Cultivators generally employ one of three operational photoperiods:
- 18/6 Schedule (18 hours on, 6 hours off): The standard industry schedule. Delivers 540 operating hours per 30-day month while providing plants with a beneficial dark period for metabolic starch translocation and root development.
- 20/4 Schedule (20 hours on, 4 hours off): Used to increase Daily Light Integral (DLI) in cooler rooms or when accelerating vegetative canopy establishment. Delivers 600 operating hours per 30-day month (an 11.1% increase in power consumption over 18/6).
- 24/0 Schedule (Continuous illumination): Eliminates darkness entirely during early growth. Delivers 720 operating hours per 30-day month, increasing electricity consumption by exactly 33.3% compared to an 18/6 regimen.
The Flowering Stage: Reduced Hours, Maximum Intensity
Inducing and sustaining flowering in photoperiod cannabis requires an uninterrupted 12-hour dark period every 24 hours. Transitioning the garden from an 18/6 schedule to a 12/12 schedule reduces daily operational hours from 18 to 12. This creates an immediate 33.3% reduction in daily lighting energy consumption. A fixture that used 12.24 kWh per day in veg consumes only 8.16 kWh per day in flower, assuming full wattage is maintained.
Does dimming my LED grow light cut power costs by the exact percentage shown on the dial?
Question sent by: Ethan Brooks, via email.
Not exactly. While high-grade horticultural drivers are relatively linear, driver efficiency drops by 2% to 5% when operated below half power. A 680-watt light set to 50% will typically pull 350 to 365 watts at the wall rather than precisely 340 watts. However, because light-emitting diodes run significantly cooler at lower electrical currents, their photosynthetic photon efficacy (PPE in micromoles per joule) increases noticeably. You consume slightly more than half power, but you gain slightly more photons per watt than running at maximum output.
Autoflowering Cultivars: Calculating Fixed Photoperiods
Autoflowering cannabis plants transition to bloom based on chronological age rather than daylight duration. As a result, growers commonly maintain an 18/6, 20/4, or even 24/0 photoperiod from seedling emergence all the way to harvest. While an autoflower crop often finishes two to three weeks faster than a photoperiod cycle, maintaining 18 to 20 daily light hours throughout bloom means the cumulative lighting electricity consumption per square foot can equal or exceed that of a photoperiod crop.
Is running a 24/0 light schedule for autoflowers economically worth the extra electricity?
Question sent by: Julia Schneider, via contact form.
In almost all residential scenarios, no. Running 24 hours of continuous light consumes 33.3% more electricity than an 18/6 schedule and 20% more than 20/4. Research across controlled-environment crops indicates that photosynthesis reaches diminishing returns once a cultivar achieves its saturation Daily Light Integral. While 24/0 can slightly hasten harvest timing by several days, the minor yield increase rarely offsets the 33% increase in lighting expense and the additional air conditioning workload required to maintain daytime canopy temperatures around the clock.
Modeling a Full 16-Week Production Cycle
To illustrate how photoperiod scheduling dictates total crop expenses, let us model a standard 16-week cycle running a verified 680W LED luminaire at an electric rate of $0.18 per kWh:
- Phase 1: Seedling / Early Veg (2 Weeks, 18/6 Schedule, Dimmed to 50% Average / 355W): 355 W x 18 hours x 14 days = 89.46 kWh. Cost: $16.10.
- Phase 2: Late Veg (4 Weeks, 18/6 Schedule, Full 680W Output): 680 W x 18 hours x 28 days = 342.72 kWh. Cost: $61.69.
- Phase 3: Flowering Stage (9 Weeks, 12/12 Schedule, Full 680W Output): 680 W x 12 hours x 63 days = 514.08 kWh. Cost: $92.53.
- Phase 4: Final Flush / Ripening (1 Week, 12/12 Schedule, Dimmed to 80% / 545W): 545 W x 12 hours x 7 days = 45.78 kWh. Cost: $8.24.
Total Direct Lighting Energy: 992.04 kWh. Total Direct Lighting Cost: $178.56 per harvest cycle.
Field Advice: Notice how the 9-week flowering stage accounted for over 51% of total cycle power despite running on a short 12-hour daily schedule. This occurs because the fixture operated at full capacity for over two months. Dimming your light during the first two weeks of vegetative growth saved approximately $16 compared to running full blast, without sacrificing seedling vigor.
Decoding Your Electric Bill: Tariffs, Tiered Rates, and Hidden Fees
The most common error in calculating grow light electricity costs is multiplying fixture wattage by the utility’s advertised “generation supply rate.” A power company may advertise an electricity rate of $0.09 per kWh. However, after taking into account delivery fees, transmission costs, environmental surcharges, and local taxes, the actual cost per kilowatt-hour often totals $0.16 to $0.22.
The Two-Part Electric Bill: Supply vs Delivery
Residential and commercial electrical invoices are split into two primary cost components:
- Generation / Supply Charge: The cost to produce the raw electricity at the power plant (coal, natural gas, nuclear, wind, or solar). This is the rate prominently advertised on utility marketing materials.
- Transmission and Delivery (T&D) Charge: The cost to transport high-voltage power across long-distance grids and distribute it through local transformers and residential poles to your electric meter. This charge is also billed per kilowatt-hour.
To determine your true blended electricity rate, take your final total bill amount (excluding fixed meter access base fees) and divide it by the total kilowatt-hours consumed during that billing cycle:
True Blended Electric Rate ($/kWh) = Total Monthly Charges ($) / Total Monthly kWh Consumed
Tiered Residential Rate Structures (Baseline Penalties)
Many municipal and investor-owned utilities (particularly across California, the Pacific Northwest, and parts of Europe) employ tiered residential tariffs. Under a tiered system, the utility allocates a baseline quota of low-cost electricity intended to cover basic household needs (refrigeration, lighting, modest electronics). Once your monthly consumption exceeds that baseline, additional kilowatt-hours are billed at Tier 2 or Tier 3 penalty rates, which can be 50% to 120% more expensive than baseline power.
Because a dedicated grow room operates on top of existing household appliances, every kilowatt-hour consumed by your grow light lands directly in the utility’s highest, most expensive tier. If your baseline rate is $0.14 per kWh but your household already consumes that baseline quota, your grow light will actually be billed at the Tier 2 rate of $0.24 or Tier 3 rate of $0.34 per kWh.
Time-of-Use (TOU) Pricing and Peak Windows
Modern digital smart meters allow utilities to implement Time-of-Use (TOU) billing schedules. Instead of charging a flat rate, the utility divides the 24-hour day into price tiers based on grid demand:
- On-Peak Window (Typically 4:00 PM to 9:00 PM): The most expensive rate, occurring when residential air conditioning and cooking overlap with commercial activity. Peak rates can reach $0.35 to $0.55 per kWh in high-cost markets.
- Partial-Peak / Shoulder Window: Moderate demand periods during midday or early evening.
- Off-Peak Window (Typically 9:00 PM to 9:00 AM): The cheapest electricity window, when grid demand drops overnight. Off-peak rates frequently fall between $0.10 and $0.18 per kWh.
My utility charges 42 cents per kWh between 4:00 PM and 9:00 PM. How should I schedule my lighting?
Question sent by: MapleGrower, via Facebook page.
Adjust your photoperiod so that the fixture never illuminates during that 5-hour peak window. In a 12/12 flowering cycle, configure your timer to run from 9:00 PM to 9:00 AM. This places 100% of your lighting energy into the cheapest off-peak rate bracket. Furthermore, operating at night leverages cooler outdoor temperatures, substantially reducing the compressor workload of your air conditioning equipment.
The matrix below demonstrates how monthly grow light operating expenses scale across standard fixture wattages, photoperiod schedules, and common electric rate brackets:
| Fixture Wattage | Schedule | Monthly kWh (30 Days) | Cost @ $0.12/kWh | Cost @ $0.18/kWh | Cost @ $0.25/kWh | Cost @ $0.35/kWh |
|---|---|---|---|---|---|---|
| 100W LED (2×2 Tent) | 18/6 (Veg) | 54.0 kWh | $6.48 | $9.72 | $13.50 | $18.90 |
| 100W LED (2×2 Tent) | 12/12 (Bloom) | 36.0 kWh | $4.32 | $6.48 | $9.00 | $12.60 |
| 240W LED (3×3 Tent) | 18/6 (Veg) | 129.6 kWh | $15.55 | $23.33 | $32.40 | $45.36 |
| 240W LED (3×3 Tent) | 12/12 (Bloom) | 86.4 kWh | $10.37 | $15.55 | $21.60 | $30.24 |
| 480W LED (4×4 Tent) | 18/6 (Veg) | 259.2 kWh | $31.10 | $46.66 | $64.80 | $90.72 |
| 480W LED (4×4 Tent) | 12/12 (Bloom) | 172.8 kWh | $20.74 | $31.10 | $43.20 | $60.48 |
| 680W LED (5×5 Area) | 18/6 (Veg) | 367.2 kWh | $44.06 | $66.10 | $91.80 | $128.52 |
| 680W LED (5×5 Area) | 12/12 (Bloom) | 244.8 kWh | $29.38 | $44.06 | $61.20 | $85.68 |
| 1000W DE HPS (5×5 Area) | 18/6 (Veg) | 576.7 kWh | $69.20 | $103.81 | $144.18 | $201.85 |
| 1000W DE HPS (5×5 Area) | 12/12 (Bloom) | 384.5 kWh | $46.14 | $69.21 | $96.13 | $134.58 |
The Hidden HVAC Multiplier: Accounting for Cooling and Dehumidification
A common mistake in indoor garden budgeting is treating the grow light as an isolated electrical consumer. Under the fundamental laws of thermodynamics, energy cannot be created or destroyed; it merely changes form. Every single watt of electrical power pulled through your fixture cord ends up as heat inside the growing environment.
The Direct Thermal Conversion Factor
One watt of electrical power equates to exactly 3.412 British Thermal Units (BTU) per hour of heat output:
Heat Generated (BTU/hr) = True Wall Draw in Watts x 3.412
Whether you operate a 1,000-watt double-ended high-pressure sodium (HPS) lamp or a modern 1,000-watt commercial LED fixture, both emit exactly 3,412 BTUs of thermal energy into the room every hour they operate at 1,000 watts. The crucial difference lies in how that heat is distributed:
- HID / HPS Lighting: Emits roughly 50% to 60% of its thermal energy as radiant infrared (IR) light directed straight downward onto the canopy. This radiant energy artificially elevates leaf surface temperature (LST), frequently requiring lower room air temperatures to prevent heat stress.
- Solid-State LED Lighting: Emits negligible infrared radiation downward. Instead, the heat is conducted upward into aluminum heat sinks and dissipated convectively into the upper room air. This allows growers to maintain slightly higher ambient room temperatures (26°C to 29°C / 79°F to 84°F) while keeping leaf surface temperatures within the optimal metabolic range.
Calculating the Cooling Energy Multiplier
Because convective heat accumulates rapidly in sealed or poorly ventilated rooms, air conditioning or continuous exhaust ventilation must operate to remove it. Removing heat with an air conditioner requires mechanical electrical compressor work.
The efficiency of an air conditioner is rated by its Energy Efficiency Ratio (EER) or Seasonal Energy Efficiency Ratio (SEER). A modern mini-split heat pump typically operates at an EER of 10 to 12. At an EER of 10, an air conditioner consumes approximately 1 watt of electrical power for every 10 BTUs of cooling provided.
Since 1,000 watts of lighting produces 3,412 BTUs of heat, an AC unit with an EER of 10 requires: 3,412 BTUs / 10 EER = 341.2 watts of cooling power. Therefore, running 1,000 watts of lighting in a sealed room actually incurs an electrical footprint of 1,341 watts (a 34% thermal overhead penalty).
Measuring True Wall Draw and Summer Thermal Load
During an early indoor cycle running two nominal 680-watt LED bar fixtures in a sealed 8×8 space, my monthly electric bill jumped by nearly double what my preliminary lighting math suggested. When I attached an inline energy logger to the circuit, the fixtures were pulling a combined 1,410 watts from the wall. More importantly, an 8,000 BTU portable air conditioner was cycling on constantly to combat the midday summer heat, drawing an additional 920 watts for six hours every afternoon.
The takeaway: Calculating lighting operating costs in isolation creates a false sense of security. Every watt of photon energy delivered into an enclosed room eventually degrades into ambient sensible heat. In warm climates or summer cycles, budget a 30% to 50% thermal overhead factor for active extraction or air conditioning, and shift your lights-on schedule to run overnight when outdoor ambient temperatures drop.
The Latent Heat Burden (Dehumidification Power)
In addition to sensible air temperature, grow lights drive plant transpiration. Cannabis plants absorb root-zone water and evaporate roughly 95% to 98% of it through their stomata into the surrounding air to facilitate nutrient transport and leaf cooling. Evaporating water transforms sensible heat into latent humidity.
A room with four mature flowering plants receiving 680 watts of high-intensity light can transpire between 8 and 16 liters (2 to 4 gallons) of water into the air daily. A compressor-based dehumidifier must condense that airborne vapor back into liquid drainage, consuming an additional 300 to 600 watts of continuous electrical power while discharging extra heat back into the room. When modeling commercial or sealed home setups, experienced facility planners apply an HVAC multiplier factor of 1.30 to 1.50 to their lighting wattage to capture the true facility electrical footprint.
Master Advice: In an open, air-cooled grow tent running an active inline extraction fan (evacuating warm air outdoors), the electrical cooling penalty is drastically smaller: typically only 30 to 75 watts for an efficient EC-motor fan. However, in sealed CO2-supplemented grow rooms where ambient air must be recycled, the mechanical cooling and dehumidification penalty is unavoidable and must be factored into your operational budget.
Grams per Watt, Photosynthetic Efficacy, and Production Economics
While total monthly cost tells you what to pay the utility company, it does not tell you whether your garden is operating efficiently. An inefficient 400-watt fixture that yields 150 grams of loose flower is economically inferior to an efficient 680-watt fixture that yields 900 grams of dense, high-grade flower, even though the larger light costs more to run per month.
Understanding Fixture Efficacy (PPE)
Lighting efficiency is quantified in photosynthetic photon efficacy (PPE), measured in micromoles of photosynthetically active radiation produced per joule of electrical energy consumed (umol/J). Fixture efficacy directly dictates how many photons reach the canopy per dollar spent on electricity:
- Legacy Magnetic HPS / MH (1.1 to 1.4 umol/J): High electrical draw, massive radiant infrared heat, and low optical conversion efficiency. Over half the electricity consumed is converted into immediate non-usable infrared heat.
- Electronic Double-Ended HPS (1.7 to 1.9 umol/J): Substantial improvement over single-ended HPS lamps, but still generates intense radiant heat requiring high ceiling clearance and substantial air conditioning.
- Ceramic Metal Halide / CMH (1.5 to 1.8 umol/J): Balanced broad-spectrum output with moderate electrical efficiency.
- Modern Top-Tier LED Bars (2.6 to 3.1 umol/J): Delivers more than double the usable photosynthetic photons per watt of electricity compared to traditional single-ended high-pressure sodium lamps.
Grams per Watt vs Grams per Kilowatt-Hour
Growers historically evaluated harvest success using the metric of “grams per watt” (g/W): total dried flower mass divided by rated fixture wattage. While useful as a rule of thumb, grams per watt fails to account for vegetative duration, photoperiod schedules, or auxiliary cooling power.
A more rigorous metric for production economics is grams per kilowatt-hour (g/kWh), which measures total harvested dry yield against total cumulative electricity consumed across the entire production cycle:
Production Energy Efficiency (g/kWh) = Total Dry Flower Harvested (Grams) / Total Cycle Electricity Consumed (kWh)
Consider a grower who harvests 680 grams of dry cured flower under a 680W LED fixture that consumed 992 kWh of total electricity across a 16-week cycle: 680 grams / 992 kWh = 0.685 g/kWh. At an electric rate of $0.18 per kWh, the direct electrical cost to produce each gram of cured flower equals: $0.18 / 0.685 g/kWh = $0.26 per gram.
The comparative matrix below illustrates the dramatic operational cost divergence between legacy discharge lighting and modern solid-state luminaires over a standard 65-day flowering cycle in a 5×5 canopy area:
| Lighting Technology | True Wall Draw | Fixture Efficacy (PPE) | Total Heat Output | 65-Day Bloom Power (12/12) | Direct Lighting Cost (@ $0.18/kWh) | Est. Yield (Dry Flower) | Direct Electrical Cost per Gram |
|---|---|---|---|---|---|---|---|
| 1000W Single-Ended HPS (Magnetic Ballast) | 1,080 Watts | 1.30 umol/J | 3,685 BTU/hr | 842.4 kWh | $151.63 | 450 Grams | $0.34 / g |
| 1000W Double-Ended HPS (Electronic Ballast) | 1,060 Watts | 1.85 umol/J | 3,617 BTU/hr | 826.8 kWh | $148.82 | 650 Grams | $0.23 / g |
| 315W CMH / LEC (Ceramic Metal Halide) | 345 Watts | 1.65 umol/J | 1,177 BTU/hr | 269.1 kWh | $48.44 | 280 Grams | $0.17 / g |
| 680W Modern LED Bar (Samsung / Osram Diodes) | 680 Watts | 2.85 umol/J | 2,320 BTU/hr | 530.4 kWh | $95.47 | 800 Grams | $0.12 / g |
Important: Notice that while the 680W LED luminaire costs $53.35 less in raw electricity over a 65-day flower cycle than a 1000W DE HPS lamp, its true economic advantage lies in photon delivery. Delivering 2.85 umol/J allows the LED to produce substantially higher canopy weight per kilowatt-hour, driving your direct electrical cost down to approximately $0.12 per gram of dried flower.
Tactical Cost Reductions: Off-Peak Scheduling and Smart Dimming
Reducing grow light operating expenses does not require compromising canopy photon density or purchasing expensive add-ons. By applying practical operational adjustments to your timer schedules and dimming profiles, you can immediately reduce monthly electric bills while optimizing root-zone and canopy microclimates.
Strategy 1: Invert the Photoperiod to Run Overnight
Running grow lights during the daytime in summer months is the most expensive mistake an indoor cultivator can make. Outdoor temperatures peak between 1:00 PM and 5:00 PM, precisely when ambient utility demand is highest and Time-of-Use rates reach their peak. Forcing your air conditioner to fight both midday summer solar heat and 680 watts of lighting heat places extreme stress on electrical circuits and drives utility bills upward.
Invert your photoperiod so that the fixture illuminates at 8:00 PM or 9:00 PM and turns off at 8:00 AM or 9:00 AM. Operating at night provides three direct financial advantages:
- Avoids expensive Time-of-Use peak tariff surcharges entirely, ensuring all consumption occurs during lower off-peak pricing brackets.
- Leverages cooler nighttime outdoor temperatures, dramatically reducing the frequency and duration of air conditioning compressor cycles.
- Helps maintain stable daytime temperatures during the dark period without requiring auxiliary heating in winter months.
Strategy 2: Progressive Daily Light Integral (DLI) Dimming
Cannabis seedlings and young vegetative clones cannot utilize high photosynthetic photon flux densities (PPFD). Blasting newly rooted cuttings with 600 to 800 umol/m2/s of light does not accelerate growth; it saturates the photosynthetic electron transport chain, causes photoinhibition, bleaches chlorophyll, and wastes expensive electricity.
Implement a progressive stage-specific dimming schedule based on canopy Daily Light Integral targets:
- Clones & Seedlings: Target PPFD of 150 to 250 umol/m2/s (DLI: 10 to 16 mol/m2/day). Dim fixture to 20% to 30% output, or elevate the fixture. Saves 70% to 80% of lighting electricity during the first 10 to 14 days.
- Early Vegetative: Target PPFD of 300 to 450 umol/m2/s (DLI: 20 to 30 mol/m2/day). Dim fixture to 40% to 50% output.
- Late Vegetative: Target PPFD of 500 to 650 umol/m2/s (DLI: 32 to 42 mol/m2/day). Set fixture to 70% to 80% output.
- Peak Flowering (Weeks 3 to 7): Target PPFD of 800 to 1,000+ umol/m2/s (DLI: 35 to 45 mol/m2/day under ambient CO2). Run fixture at 100% capacity to maximize flower swelling and resin synthesis.
- Final Ripening (Final 7 to 10 Days): Reduce light intensity back to 70% to 80% output. Research indicates that during senescence and terpene stabilization, plants cannot efficiently utilize peak light levels. Lowering light intensity saves energy and prevents delicate monoterpenes (such as myrcene and limonene) from volatilizing under intense thermal radiation.
Strategy 3: Optimize Fixture Hanging Heights
The inverse-square law dictates that light intensity diminishes exponentially as distance from a point source increases. While LED bar luminaires behave as distributed planar arrays rather than point sources, hanging a fixture unnecessarily high and running it at 100% power wastes valuable photons through sidewall absorption and light bounce.
Lowering your fixture from 30 inches to 16 to 18 inches above the canopy allows you to dim the fixture by 15% to 25% while maintaining the exact same canopy PPFD. Lowering the power draw reduces active wall wattage and extends the operating lifespan of both your diodes and power supply driver.
The Repeatable Energy Audit: A Field Measurement and Planning Checklist
Rather than relying on guesswork or rough assumptions, perform an electrical audit of your cultivation space before initiating every cycle. Following a repeatable, step-by-step verification procedure ensures that your operating budget matches your utility bills to within single-digit dollar accuracy.
Grow Light Energy Audit and Verification Protocol
- Measure active wall wattage at the outlet using a digital power meter at 25%, 50%, 75%, and 100% dimmer settings.
- Record the fixture power factor (PF) to verify that the power supply operates efficiently above 0.92.
- Review your most recent electric utility statement to calculate your true blended rate ($/kWh), including transmission and delivery surcharges.
- Identify whether your utility imposes Time-of-Use (TOU) peak demand pricing windows or monthly baseline consumption tiers.
- Configure digital lighting timers to illuminate exclusively during off-peak and cooler nighttime hours (e.g., 9:00 PM to 9:00 AM).
- Calculate stage-by-stage daily kilowatt-hour demand: (Active Watts x Daily Run Hours) / 1,000.
- Apply a realistic HVAC multiplier (1.10x for inline tent exhaust; 1.35x for sealed air-conditioned spaces) to establish total facility power demand.
- Multiply total cycle kilowatt-hours by your blended rate to establish a reliable, pre-harvest operating budget.
- Reconcile the post-harvest utility statement against your projected budget to identify seasonal rate changes or equipment inefficiencies.
Weedth Verdict: Controlling grow light electricity costs is not about starving the canopy of photons. It is about matching actual wall draw to the plant’s stage-specific photosynthetic capacity, exploiting off-peak utility tariffs, and eliminating deceptive marketing assumptions from your operating balance sheet.
Share this article
A quick overview of the topics covered in this article.
Follow us
Latest articles
November 10, 2026
November 10, 2026
November 10, 2026
November 10, 2026