How to Run a Controlled Cannabis Nutrient Trial: Experimental Design, Benchmarking, and Data Verification
In the commercial cannabis industry, cultivators are constantly inundated with promotional claims from nutrient manufacturers advertising proprietary bloom boosters, enzyme elixirs, carbohydrate flushes, and microbial inoculants promising 20% to 35% surges in dry flower yield and cannabinoid concentration. Yet, when commercial operations attempt to evaluate these products in production rooms, they frequently fall victim to unscientific comparison methodologies, confirmation bias, and uncontrolled environmental confounding variables. An uncontrolled trial is worse than conducting no trial at all: if a grower introduces a new fertilizer formula while simultaneously altering room setpoints, upgrading LED fixtures, or adjusting irrigation shot volumes, any observed shift in harvest biomass or resin production cannot be scientifically attributed to the fertilizer. Conducting an authentic agronomic nutrient trial demands rigorous experimental discipline: isolating a single independent variable, constructing randomized replicated treatment blocks, synchronizing clone physiological age, calibrating environmental vapor pressure deficit (VPD), and capturing objective laboratory and biomass metrics. This guide details the complete scientific protocol for designing, executing, and auditing a controlled cannabis nutrient trial in commercial indoor and greenhouse facilities.
Plant Physiology and Root-Zone Chemistry: The Biological Baseline
Before designing an experimental trial, cultivators must ground their methodology in foundational plant nutrition physiology rather than manufacturer marketing claims. Higher plants require seventeen essential chemical elements to complete their lifecycle, absorbed primarily as dissolved inorganic ions across root hair plasma membranes. The uptake of these ions is governed by fundamental physiological laws that dictate how plants respond to changes in nutrient concentration:
- Liebig’s Law of the Minimum: Plant biomass growth and metabolic synthesis are constrained not by the total quantity of nutrients available, but by the single scarcest essential resource. If root-zone dissolved oxygen, ambient photosynthetic photon flux density (PPFD), or available carbon dioxide is limiting canopy photosynthesis, adding elevated concentrations of phosphorus or potassium will yield zero biological gain while increasing osmotic stress.
- Mitscherlich’s Law of Diminishing Marginal Returns: As the concentration of an essential nutrient approaches the plant’s biological saturation threshold, each incremental unit of fertilizer yields a progressively smaller gain in biomass. Beyond this saturation plateau, excessive ion concentrations elevate substrate electrical conductivity, forcing roots to expend valuable metabolic energy on cellular osmoregulation rather than floral expansion.
- Root Membrane Ion Transporters: Ion absorption occurs through specialized protein channels and active proton-pumping ATPases (such as AKT1 potassium channels and NRT1/NRT2 nitrate transporters) embedded in root epidermal membranes. These transporters exhibit saturation kinetics (Michaelis-Menten kinetics). Once carrier proteins are fully saturated, surplus ions remain in the root-zone interstitial solution, accumulating as residual mineral salts that suppress substrate water potential.
A scientifically valid nutrient trial must determine whether a test fertilizer formula operates within the ascending response curve of Mitscherlich’s law or whether it pushes the rhizosphere into luxury consumption and osmotic inhibition. Understanding this biological baseline prevents cultivators from attributing natural seasonal vigor or minor microclimate shifts to the influence of a test nutrient product.
Michaelis-Menten Root Uptake Kinetics and Transmembrane Potentials
At the biophysical scale, root nutrient influx is governed by Michaelis-Menten enzyme-substrate kinetics. The rate of ion transport across the plasma membrane into root cortical cells is determined by the ion concentration in the root-zone solution and the affinity constant of specific transporter proteins. When nutrient concentrations in the root solution are low, ion uptake velocity increases linearly as concentration rises. However, once the substrate solution reaches the transporter affinity threshold, carrier proteins become fully occupied, and influx velocity reaches an absolute biological ceiling.
Furthermore, active nutrient transport is energized by a powerful electrical potential difference across the root plasma membrane, typically maintaining a negative interior charge between -120 mV and -180 mV relative to the exterior root zone. This electrochemical gradient is generated by plasma membrane H+-ATPase proton pumps that continuously extrude hydrogen ions into the rhizosphere. If a trial operator introduces an excessively concentrated mineral formula with high ammonium-to-nitrate ratios, excessive cation loading partially depolarizes the membrane potential, collapsing the driving force required for secondary active co-transport of anions like phosphate, sulfate, and nitrate. Quantifying these biophysical limits prevents growers from assuming that doubling fertilizer PPM automatically doubles cellular uptake.
The Scientific Golden Rule: Strict Single-Variable Isolation
The single most frequent fatal error in cannabis nutrient trials is changing multiple cultivation variables simultaneously. If you test a new floral booster while simultaneously adjusting your irrigation dry-back target from 15% to 25%, or if you alter daytime temperature setpoints during the test run, your trial data is scientifically invalidated. To draw defensible causal conclusions, exactly one variable must differ between the control group and the treatment group: the specific nutrient composition under investigation. Light intensity, spectral distribution, ambient temperature, relative humidity, carbon dioxide enrichment, irrigation timing, substrate dry-back, container volume, and root-zone physical structure must remain strictly identical across all trial blocks.
Experimental Design: Replicated Blocks and Environmental Synchronization
Achieving statistically valid conclusions in a commercial cannabis facility requires eliminating positional bias and biological variation. Controlled agricultural trials rely on standardized architectural frameworks designed to isolate the treatment effect from environmental background noise:
1. Randomized Complete Block Design (RCBD)
In any indoor grow room or greenhouse bay, subtle microclimate gradients exist. Lighting fixtures deliver higher PPFD directly beneath the center of the bench compared to the perimeter edges; airflow velocities vary between HVAC supply diffusers and return grilles; and wall reflection losses alter canopy radiation. If an entire bench of “Treatment Plants” is placed under the center lights while “Control Plants” occupy the bench perimeter, the treatment will appear to outperform the control purely due to light intensity advantages.
To neutralize microclimate bias, commercial trials must employ a Randomized Complete Block Design (RCBD). The experimental canopy is divided into multiple homogeneous blocks (e.g., Block 1, Block 2, Block 3, Block 4). Within each block, control plants and treatment plants are arranged in randomized alternating sub-plots or paired rows. This spatial randomization ensures that both control and treatment groups experience identical average PPFD, identical air velocities, and identical ambient vapor pressure deficits across the entire room envelope.
2. Genetic Uniformity and Clone Vigor Grading
Under no circumstances can seed-grown cannabis populations be utilized for nutrient trials. F1 and F2 seed crops exhibit pronounced segregating genetic variability in nutrient uptake efficiency, internodal elongation, calyx-to-leaf ratio, and secondary metabolite synthesis. Phenotypic variation within a seed lot will completely mask or falsely amplify any nutrient treatment response.
All trial specimens must be identical vegetative cuttings (clones) harvested from a single, verified, healthy mother plant on the exact same day. Furthermore, cuttings must undergo strict physiological grading before trial entry: discard cuttings with stem diameters varying by more than ±0.5 mm, synchronize rooting dates, and ensure that root emergence and initial vegetative biomass are visually and gravimetrically identical before potting into experimental containers.
3. Statistical Power and Sample Size Determination
In biological experiments, establishing whether an observed yield difference is genuine requires formal statistical hypothesis testing. The null hypothesis (H0) posits that there is zero true biological difference between the control fertilizer and the test fertilizer, with any observed discrepancy arising entirely from random chance. The alternative hypothesis (H1) posits that the test nutrient produces a statistically significant change in biomass or secondary metabolite synthesis.
To reject the null hypothesis with scientific confidence, trials must operate with a significance threshold of alpha = 0.05 (a 95% confidence level) and a statistical power of at least 80% (beta = 0.20). Power calculations demonstrate that if the baseline coefficient of variation across a cannabis canopy is 10%, detecting an 8% difference in dry flower yield requires a minimum sample size of 16 to 24 plants per treatment arm across at least three replicated blocks. Attempting trials with smaller sample sizes inevitably produces false negatives (failing to detect a genuine improvement) or false positives (attributing random microclimate fluctuations to fertilizer chemistry).
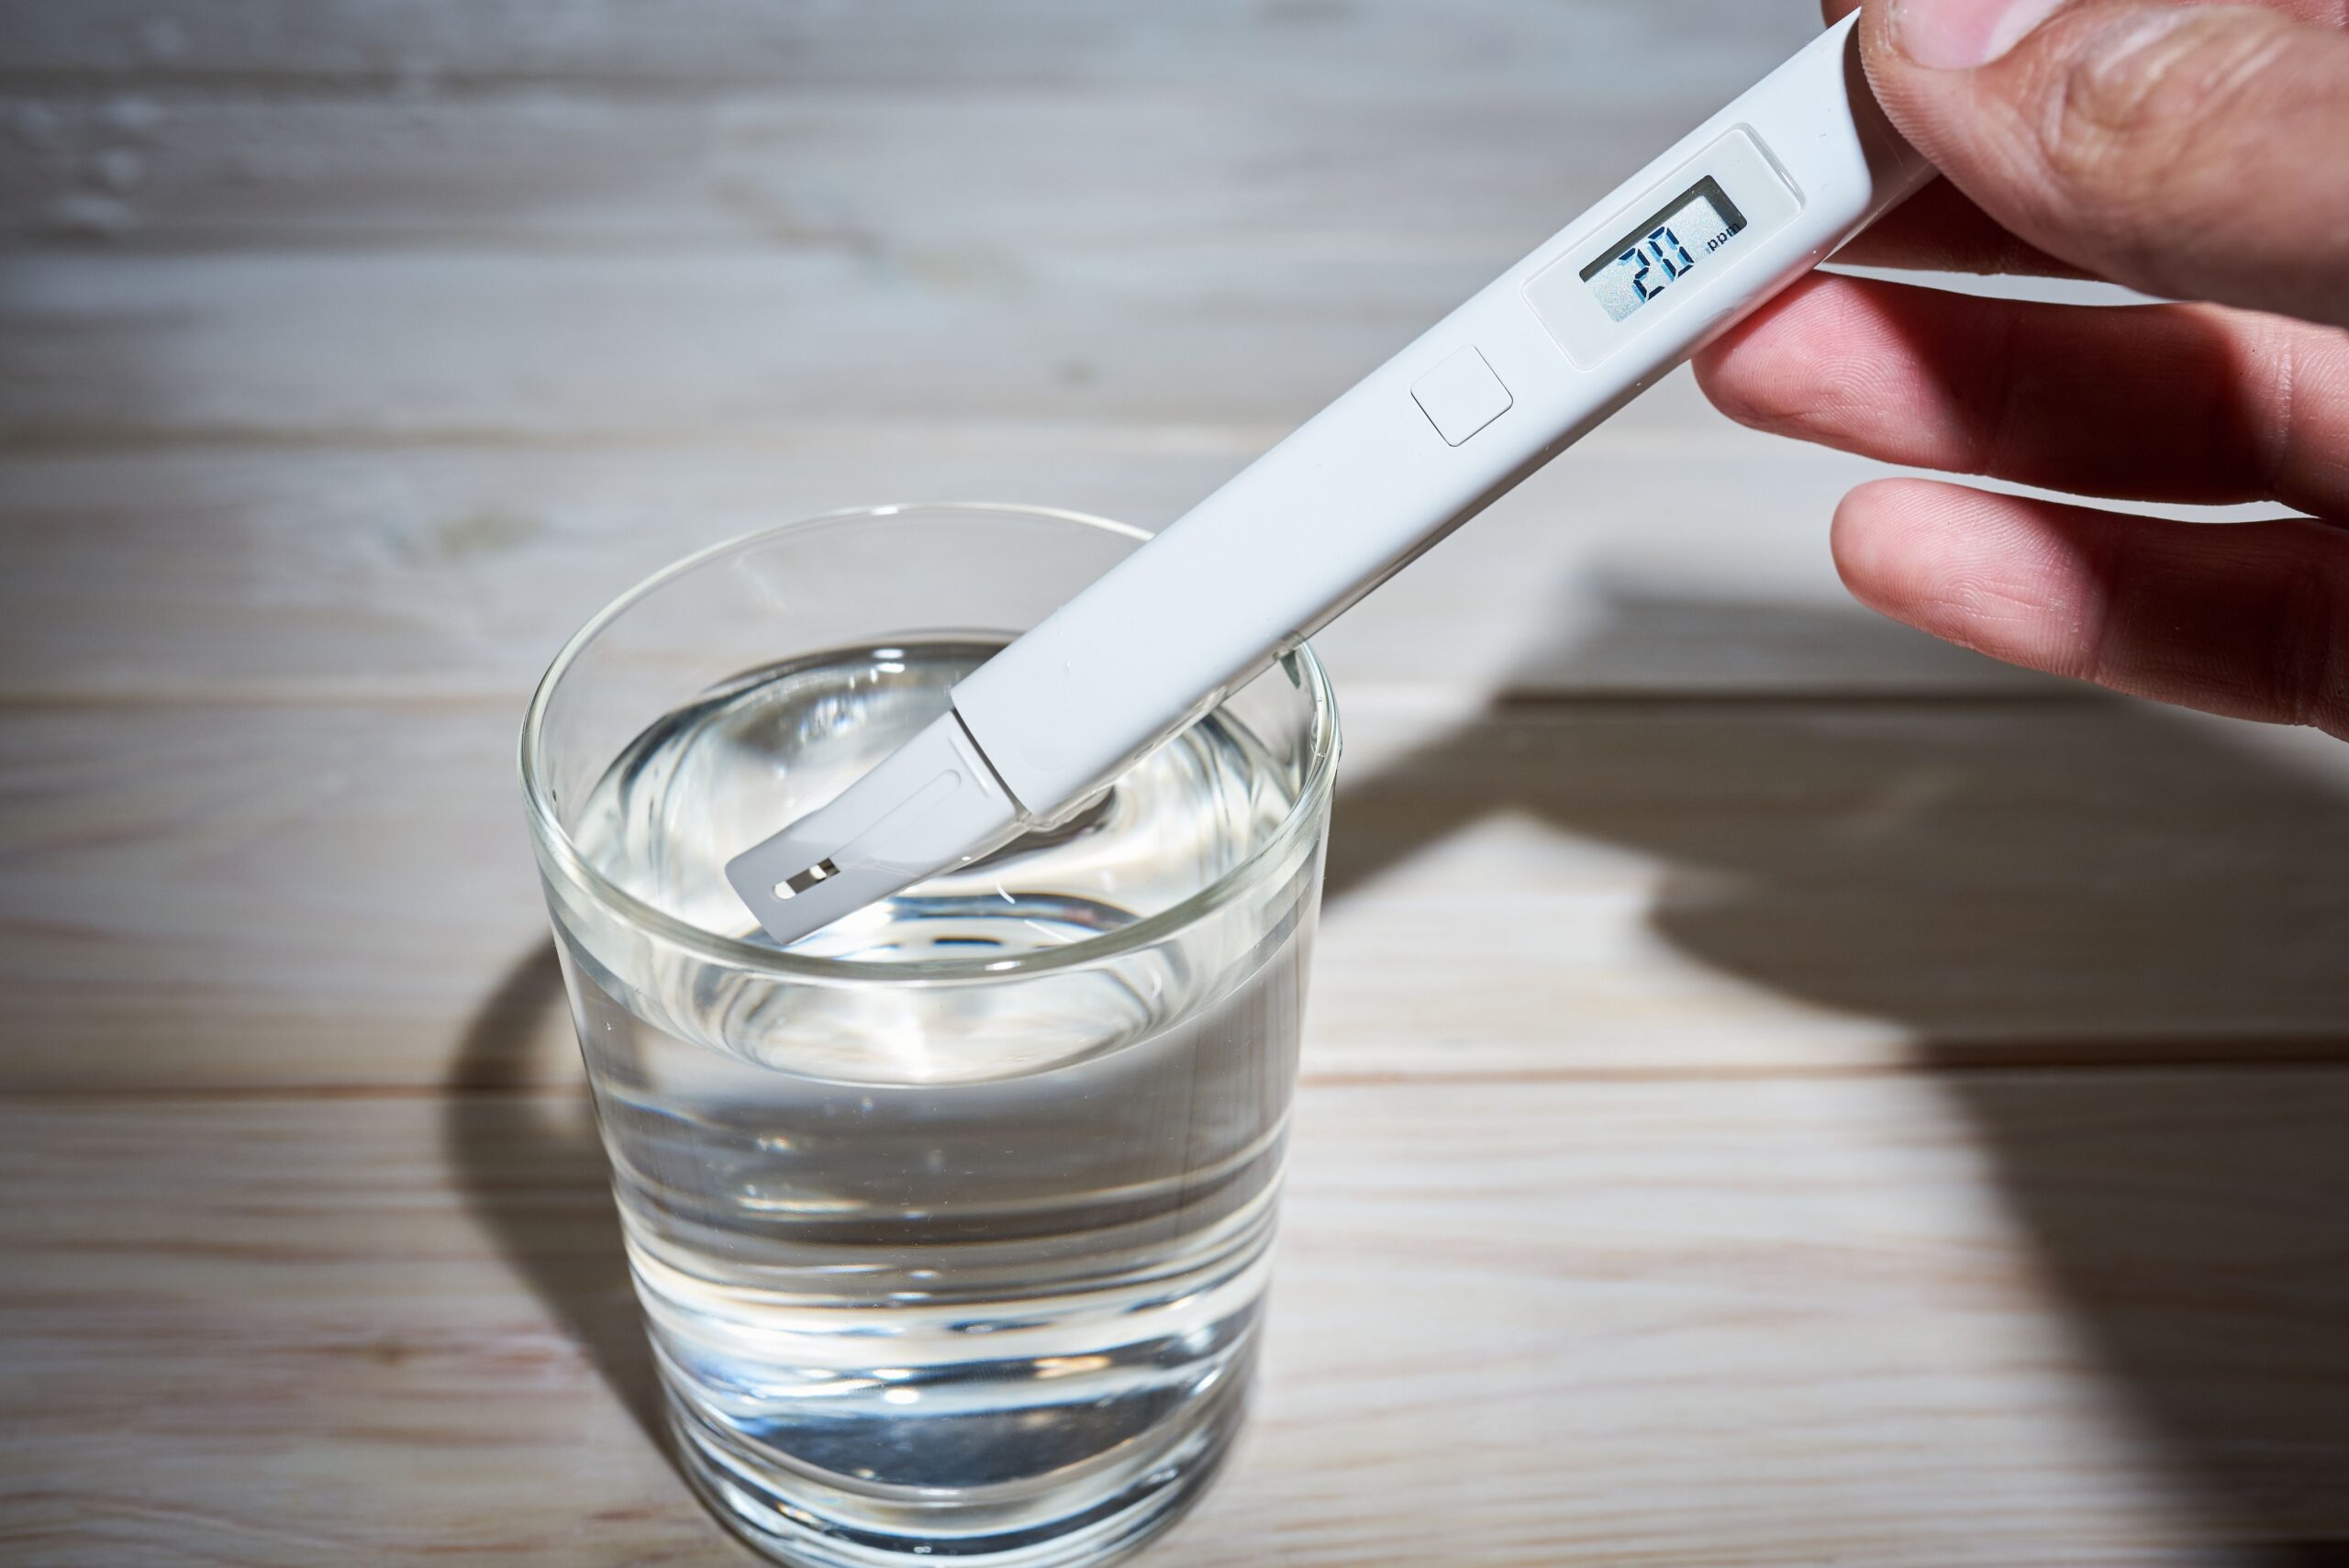
Precision electrical conductivity and pH instrumentation used to audit fertigation inputs and leachate in nutrient trials.
Nutrient Interactions: Cation Antagonisms and Symptom Look-Alikes
When evaluating plant responses during a trial, cultivators frequently misinterpret visual foliar symptoms, attributing physiological stress to product efficacy or deficiency rather than root-zone chemical interference. Adding a high concentration of one mineral ion inevitably alters the uptake kinetics of competing ions:
- The Potassium-Calcium-Magnesium Antagonism: Positively charged cations compete directly for non-specific transport channels across root cortical cells. When a test flowering formula supplies excessive potassium (exceeding 300 to 350 ppm K) to promote flower density, it competitively suppresses the uptake of calcium (Ca2+) and magnesium (Mg2+). The resulting marginal leaf necrosis and interveinal chlorosis are frequently misdiagnosed as light stress or fungal infection, when they are actually potassium-induced calcium starvation.
- Phosphorus-Induced Micronutrient Precipitation: High-phosphorus bloom boosters (delivering 100 to 150+ ppm P) react with free zinc (Zn2+) and iron (Fe2+/Fe3+) in both the concentrated stock tank and the root-zone interstitial water, forming insoluble zinc phosphate and iron phosphate precipitates. The plant exhibits acute upper-canopy interveinal chlorosis, leading inexperienced trial operators to conclude that the crop requires more iron chelate rather than recognizing phosphorus excess.
- Ammonium vs. Nitrate Rhizosphere pH Drift: If a test nutrient recipe contains a higher fraction of ammonium-nitrogen (NH4+), root uptake releases hydrogen protons (H+) into the medium, driving root-zone pH downward from 5.8 to 4.9 within days. At this acidic pH, manganese and iron availability surges to toxic levels while calcium and magnesium uptake collapses. If the control group receives 100% nitrate-nitrogen (NO3–), its rhizosphere pH remains stable at 6.0 to 6.3. The visual differences observed between the two benches reflect pH-driven nutrient availability rather than the superiority of the test brand.
To accurately interpret trial results, operators must distinguish between direct elemental demand and secondary antagonistic interference. Tracking substrate leachate chemistry alongside foliar observation is the only reliable method to verify the true chemical mechanism driving plant growth.
How many plants per treatment group are needed for statistically valid trial results in a commercial facility?
Question sent by: Marcus Vance, via email.
“We want to test a new expensive biological flower hardener in our 40-light flowering room. Our lead grower wants to test it on 4 plants at the end of Bench 1 and compare them to 4 control plants on Bench 2. Is an 8-plant sample size enough to make a purchasing decision for our entire 200-light facility?”
A sample size of 4 plants per group is completely insufficient to make a multi-thousand-dollar commercial purchasing decision. In commercial horticulture, individual plant-to-plant dry biomass variation naturally fluctuates by 8% to 15% due to minor differences in rooting vigor, irrigation emitter flow tolerances (±5% to 10% on micro-tubing), and localized canopy microclimates.
With only 4 plants per group, a statistical Student’s t-test or Analysis of Variance (ANOVA) will have virtually zero statistical power. A 5% yield increase observed on 4 plants has a probability value (p-value) well above 0.20, meaning there is greater than a 20% probability that the difference was pure random coincidence. To detect a genuine 5% to 10% yield or potency difference with high statistical confidence (p < 0.05), you need a minimum sample size of 16 to 24 plants per treatment group, ideally arranged in at least 3 randomized replicated blocks (e.g., 8 control and 8 treatment plants per block across 3 separate benches).
Furthermore, never place all test plants at the end of a bench. Bench ends experience elevated light interception from aisle reflection and distinct air circulation patterns that inflate yield independently of fertilizer. Distribute your plants in randomized paired blocks across the bench to ensure robust, actionable data.
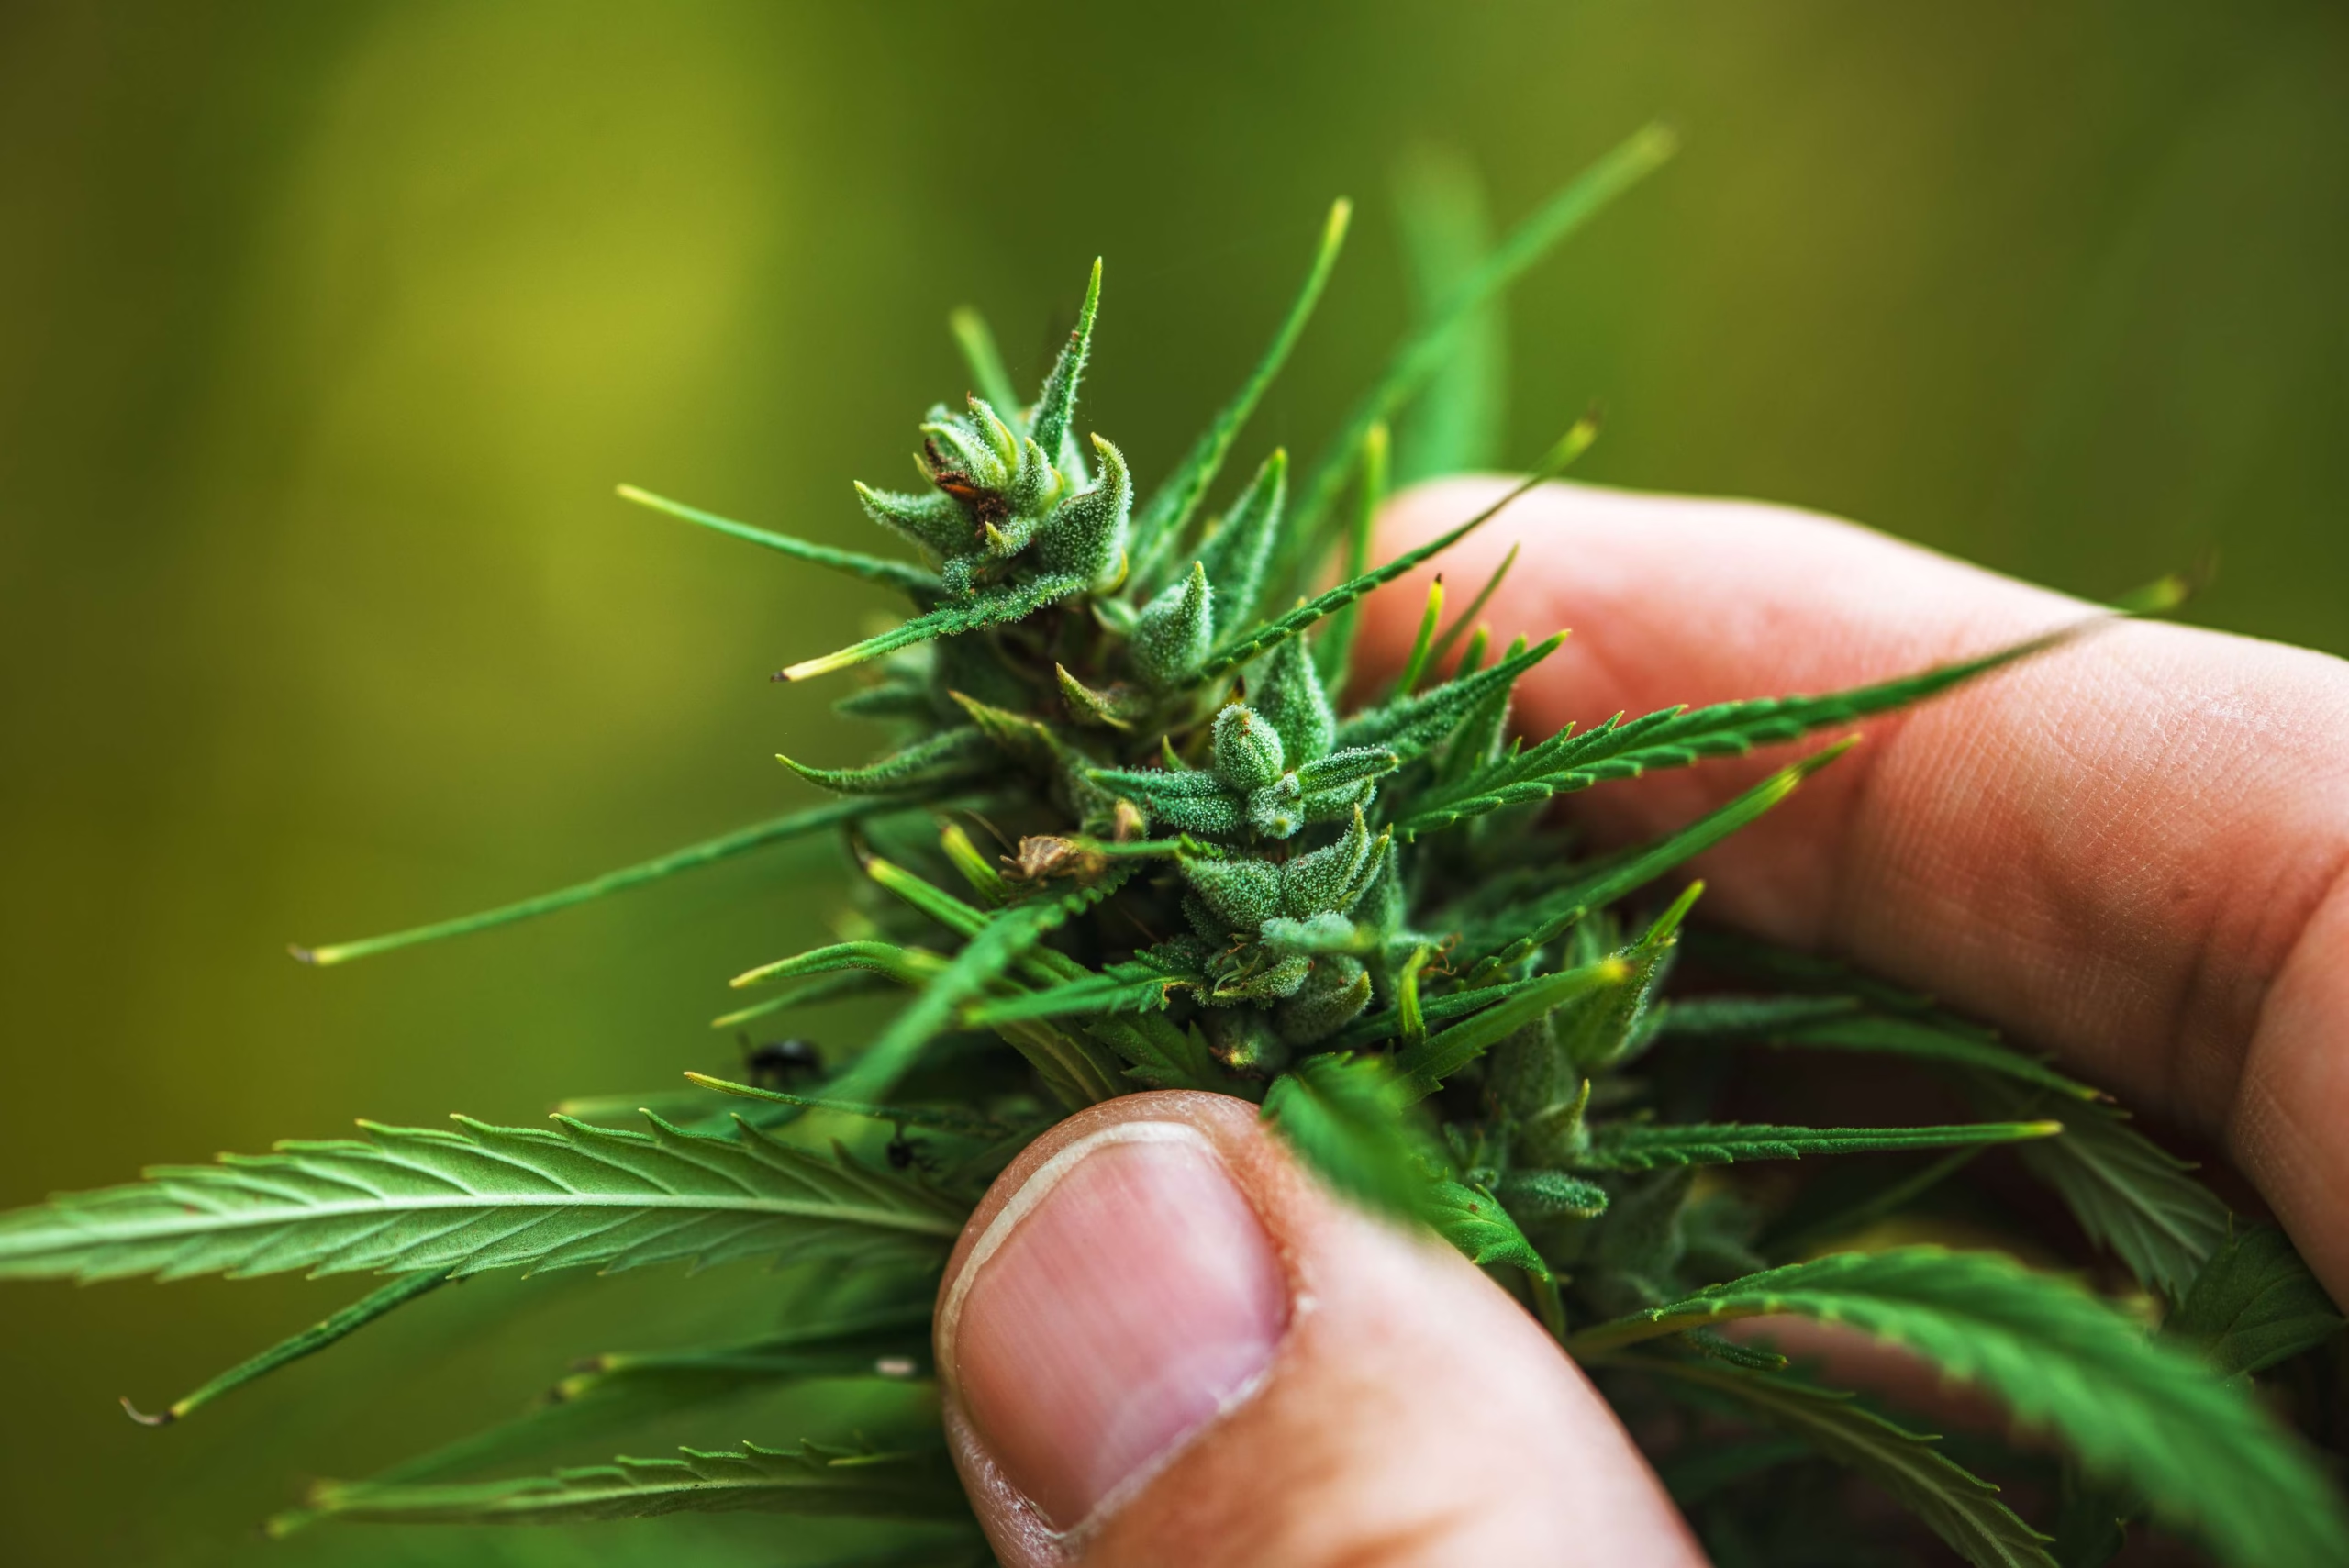
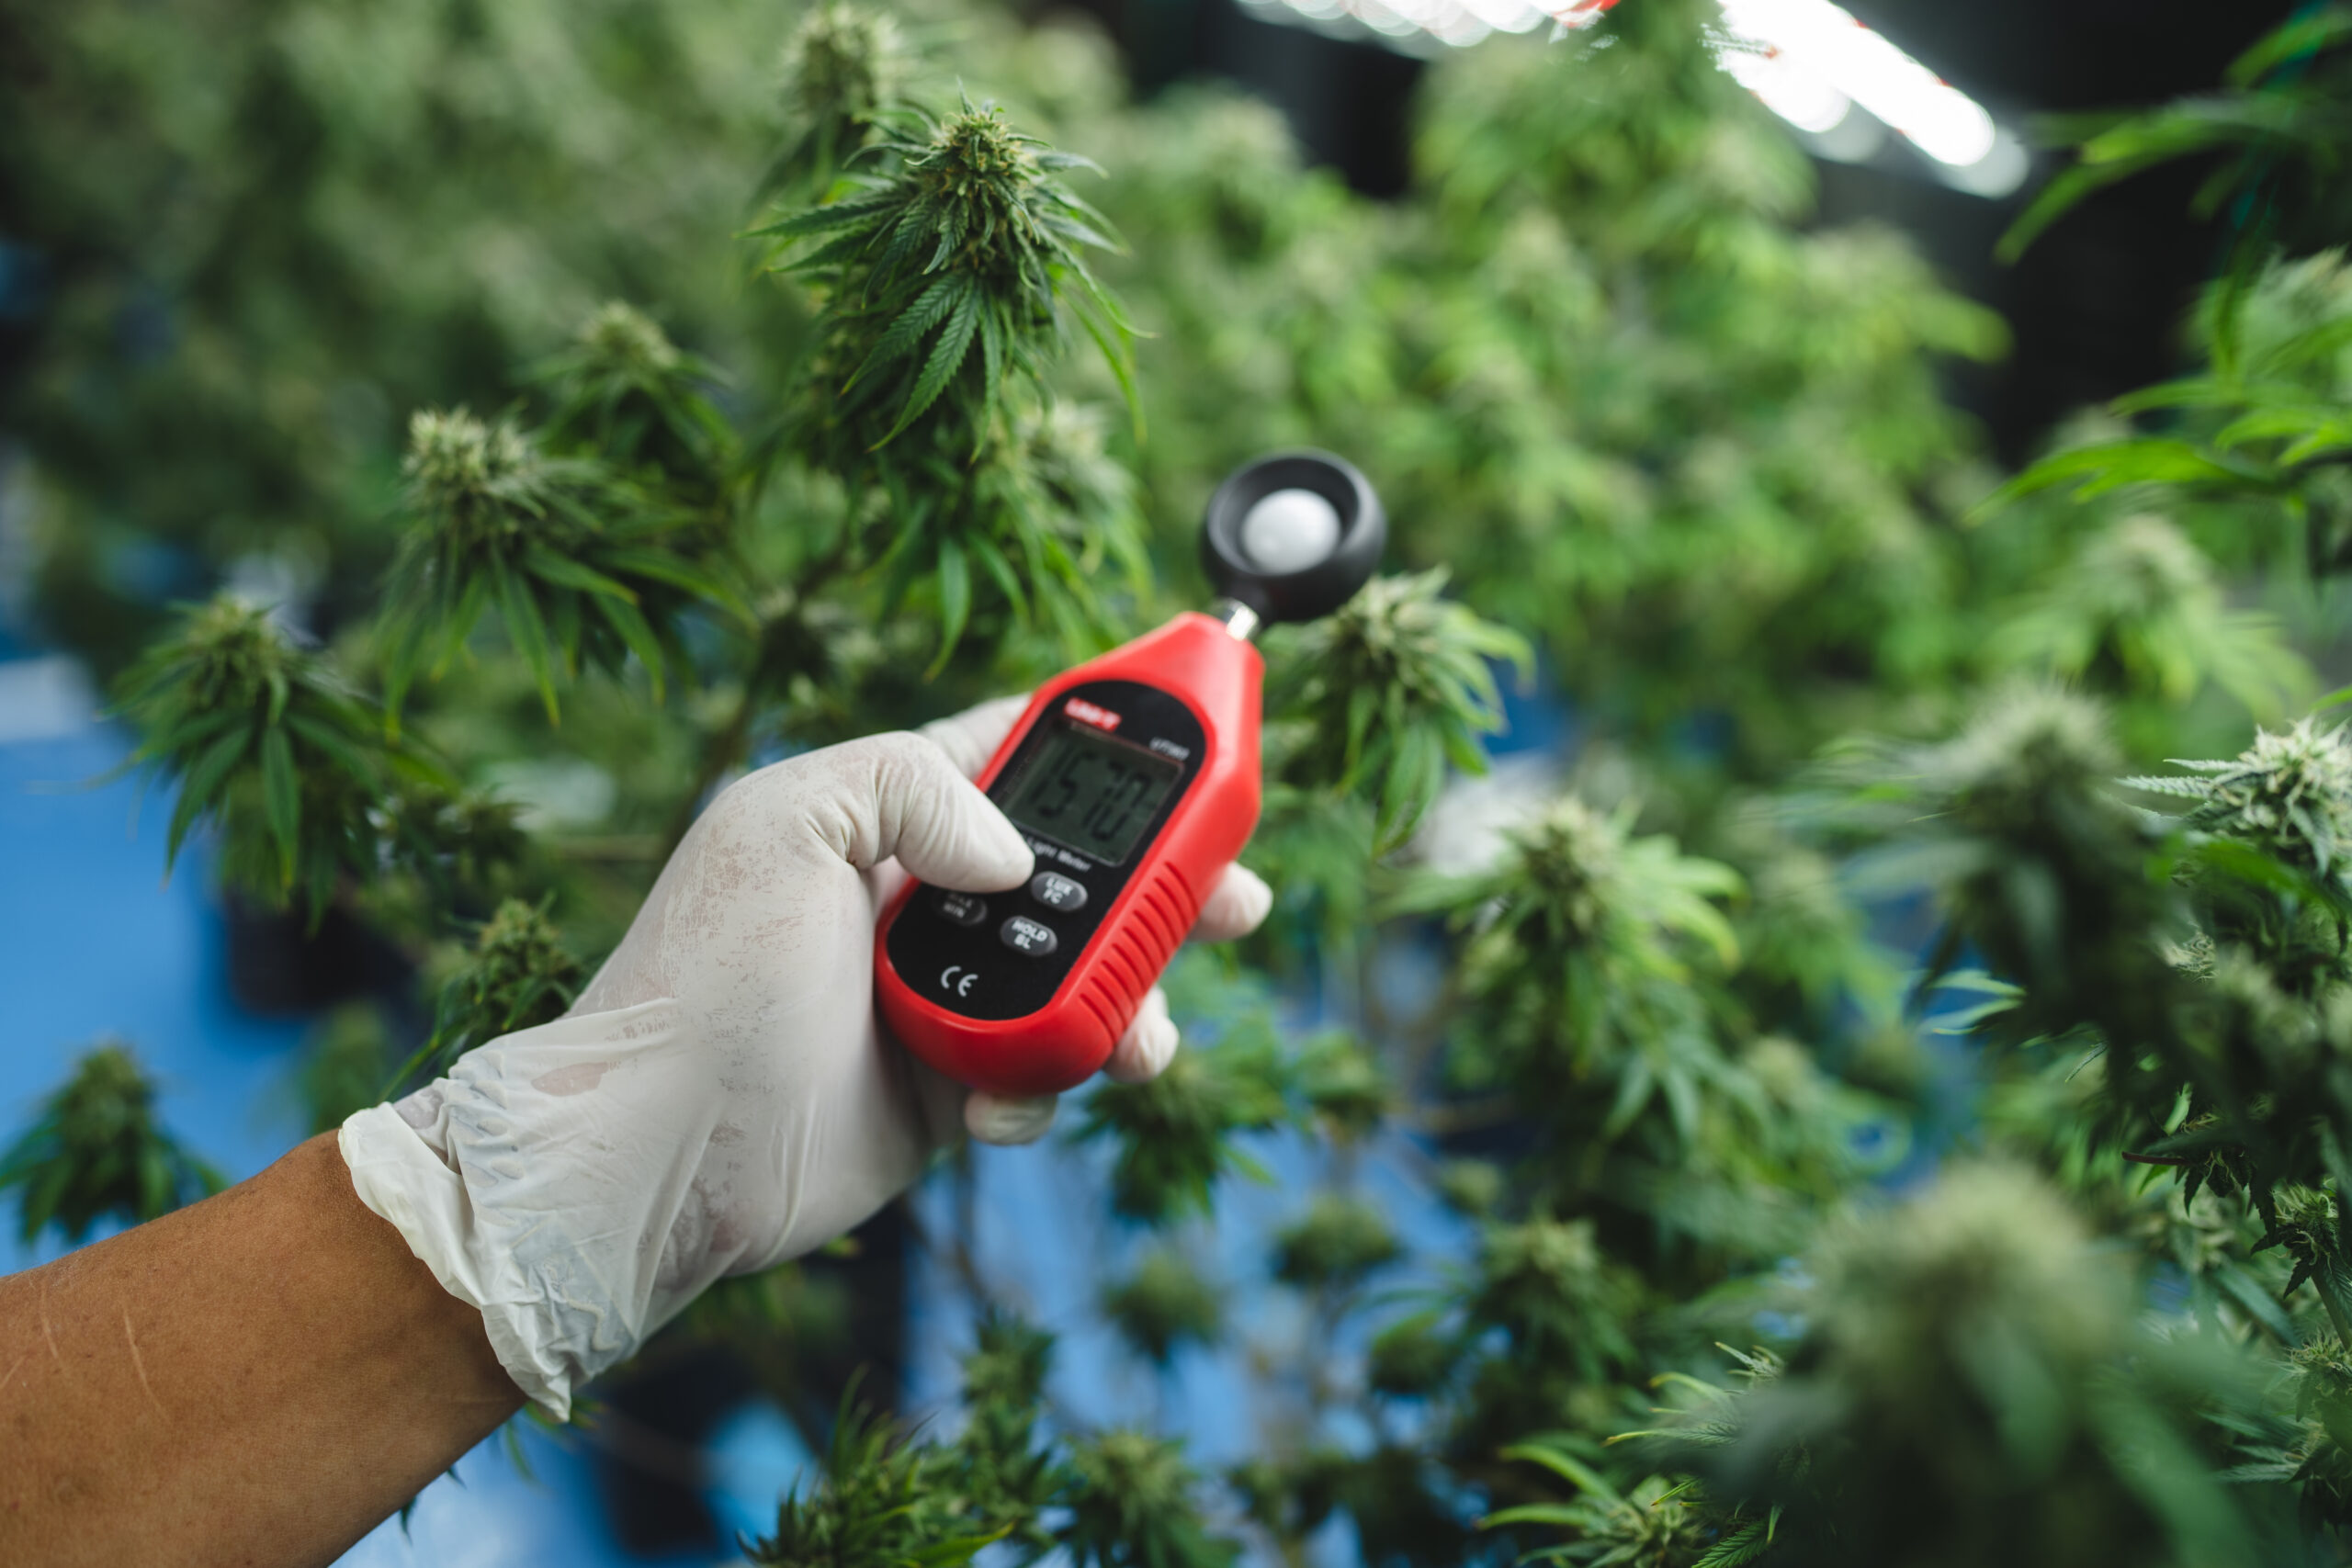
Cultivation researcher assessing floral development, leaf angles, and canopy uniformity across replicated trial blocks.
Data Collection: Instrumentation, Checkpoints, and Laboratory Verification
A controlled nutrient trial is only as reliable as the precision of the instruments and procedures used to capture data. Cultivators must establish an objective daily and weekly measurement cadence spanning the root zone, the plant canopy, and analytical laboratory testing:
1. Daily Root-Zone and Fertigation Auditing
Every single fertigation event must be tracked and recorded in a centralized digital logging platform. Operators must record: input electrical conductivity (EC), input pH, delivered solution volume, total leachate runoff volume, runoff EC, and runoff pH for each treatment block. Calculating the leaching fraction (LF = Leachate Volume / Input Volume × 100) ensures that both control and treatment blocks receive identical flushing kinetics. If one treatment block transpires more water due to elevated salt concentration, its leaching fraction will drop, concentrating residual salts and skewing root-zone EC.
Continuous in-situ substrate sensors (such as TDR or multi-frequency capacitance sensors) should be inserted into the core root ball of representative index plants in each block. These sensors stream continuous real-time data: Volumetric Water Content (VWC percentage), pore-water electrical conductivity (σp), and root-zone temperature, verifying that both groups undergo identical dry-back dynamics throughout the photoperiod.
2. Vegetative and Floral Growth Biomass Benchmarking
Visual inspection is inherently subjective; quantifiable dimensional metrics must be captured at standardized calendar milestones throughout the crop cycle:
- Internodal Spacing & Main Stem Caliper: Measure vertical stem elongation weekly and record stem diameter at 5.0 cm above the substrate line using digital vernier calipers (±0.1 mm precision). Accelerated stem thickening indicates enhanced secondary xylem formation and robust vascular nutrient transport.
- Chlorophyll Index & Leaf Area Index (LAI): Measure relative leaf chlorophyll concentration non-destructively using a calibrated optical SPAD chlorophyll meter across five representative upper-canopy fan leaves per plant. Record canopy light interception to confirm leaf area index uniformity.
- Harvest Biomass Fractions: At harvest, record individual plant fresh wet whole-plant mass, fresh trimmed flower mass, fresh fan leaf mass, and waste stalk mass. After controlled curing (14 days at 15.5 °C and 60% relative humidity), record final bone-dry trimmed flower biomass and total dry trim mass on a calibrated commercial NTEP-certified trade balance.
| Agronomic Parameter | Instrument / Analytical Tool | Measurement Cadence | Precision Tolerance | Agronomic Objective |
|---|---|---|---|---|
| Input / Runoff EC | Temperature-compensated conductivity meter | Daily (every irrigation shot) | ±0.02 dS/m | Tracks salt accumulation and root osmotic potential. |
| Input / Runoff pH | Double-junction glass electrode pH meter | Daily (calibrated weekly) | ±0.05 pH units | Monitors rhizosphere cation/anion exchange balance. |
| Substrate VWC & EC | TDR / Capacitance in-situ substrate probes | Continuous (logged every 5 min) | ±1% VWC, ±0.1 dS/m | Verifies identical dry-back curves between blocks. |
| Stem Caliper Diameter | Digital vernier caliper (5 cm above base) | Weekly during vegetative & stretch | ±0.1 mm | Quantifies vascular structural development. |
| Foliar Tissue Analysis | Third-party laboratory ICP-OES spectrometry | Day 21 and Day 45 of flowering | Certified laboratory PPM | Confirms true active elemental uptake into tissue. |
| Dry Harvest Flower Mass | NTEP Class II trade-certified digital balance | Day 14 post-harvest (cured 60°F/60% RH) | ±0.1 gram per plant | Provides primary commercial yield endpoint data. |
| Cannabinoids & Terpenes | Third-party HPLC-DAD and GC-MS testing | Post-cure composite sample per block | ±0.1% cannabinoid / terpene | Audits biochemical synthesis and flower value. |
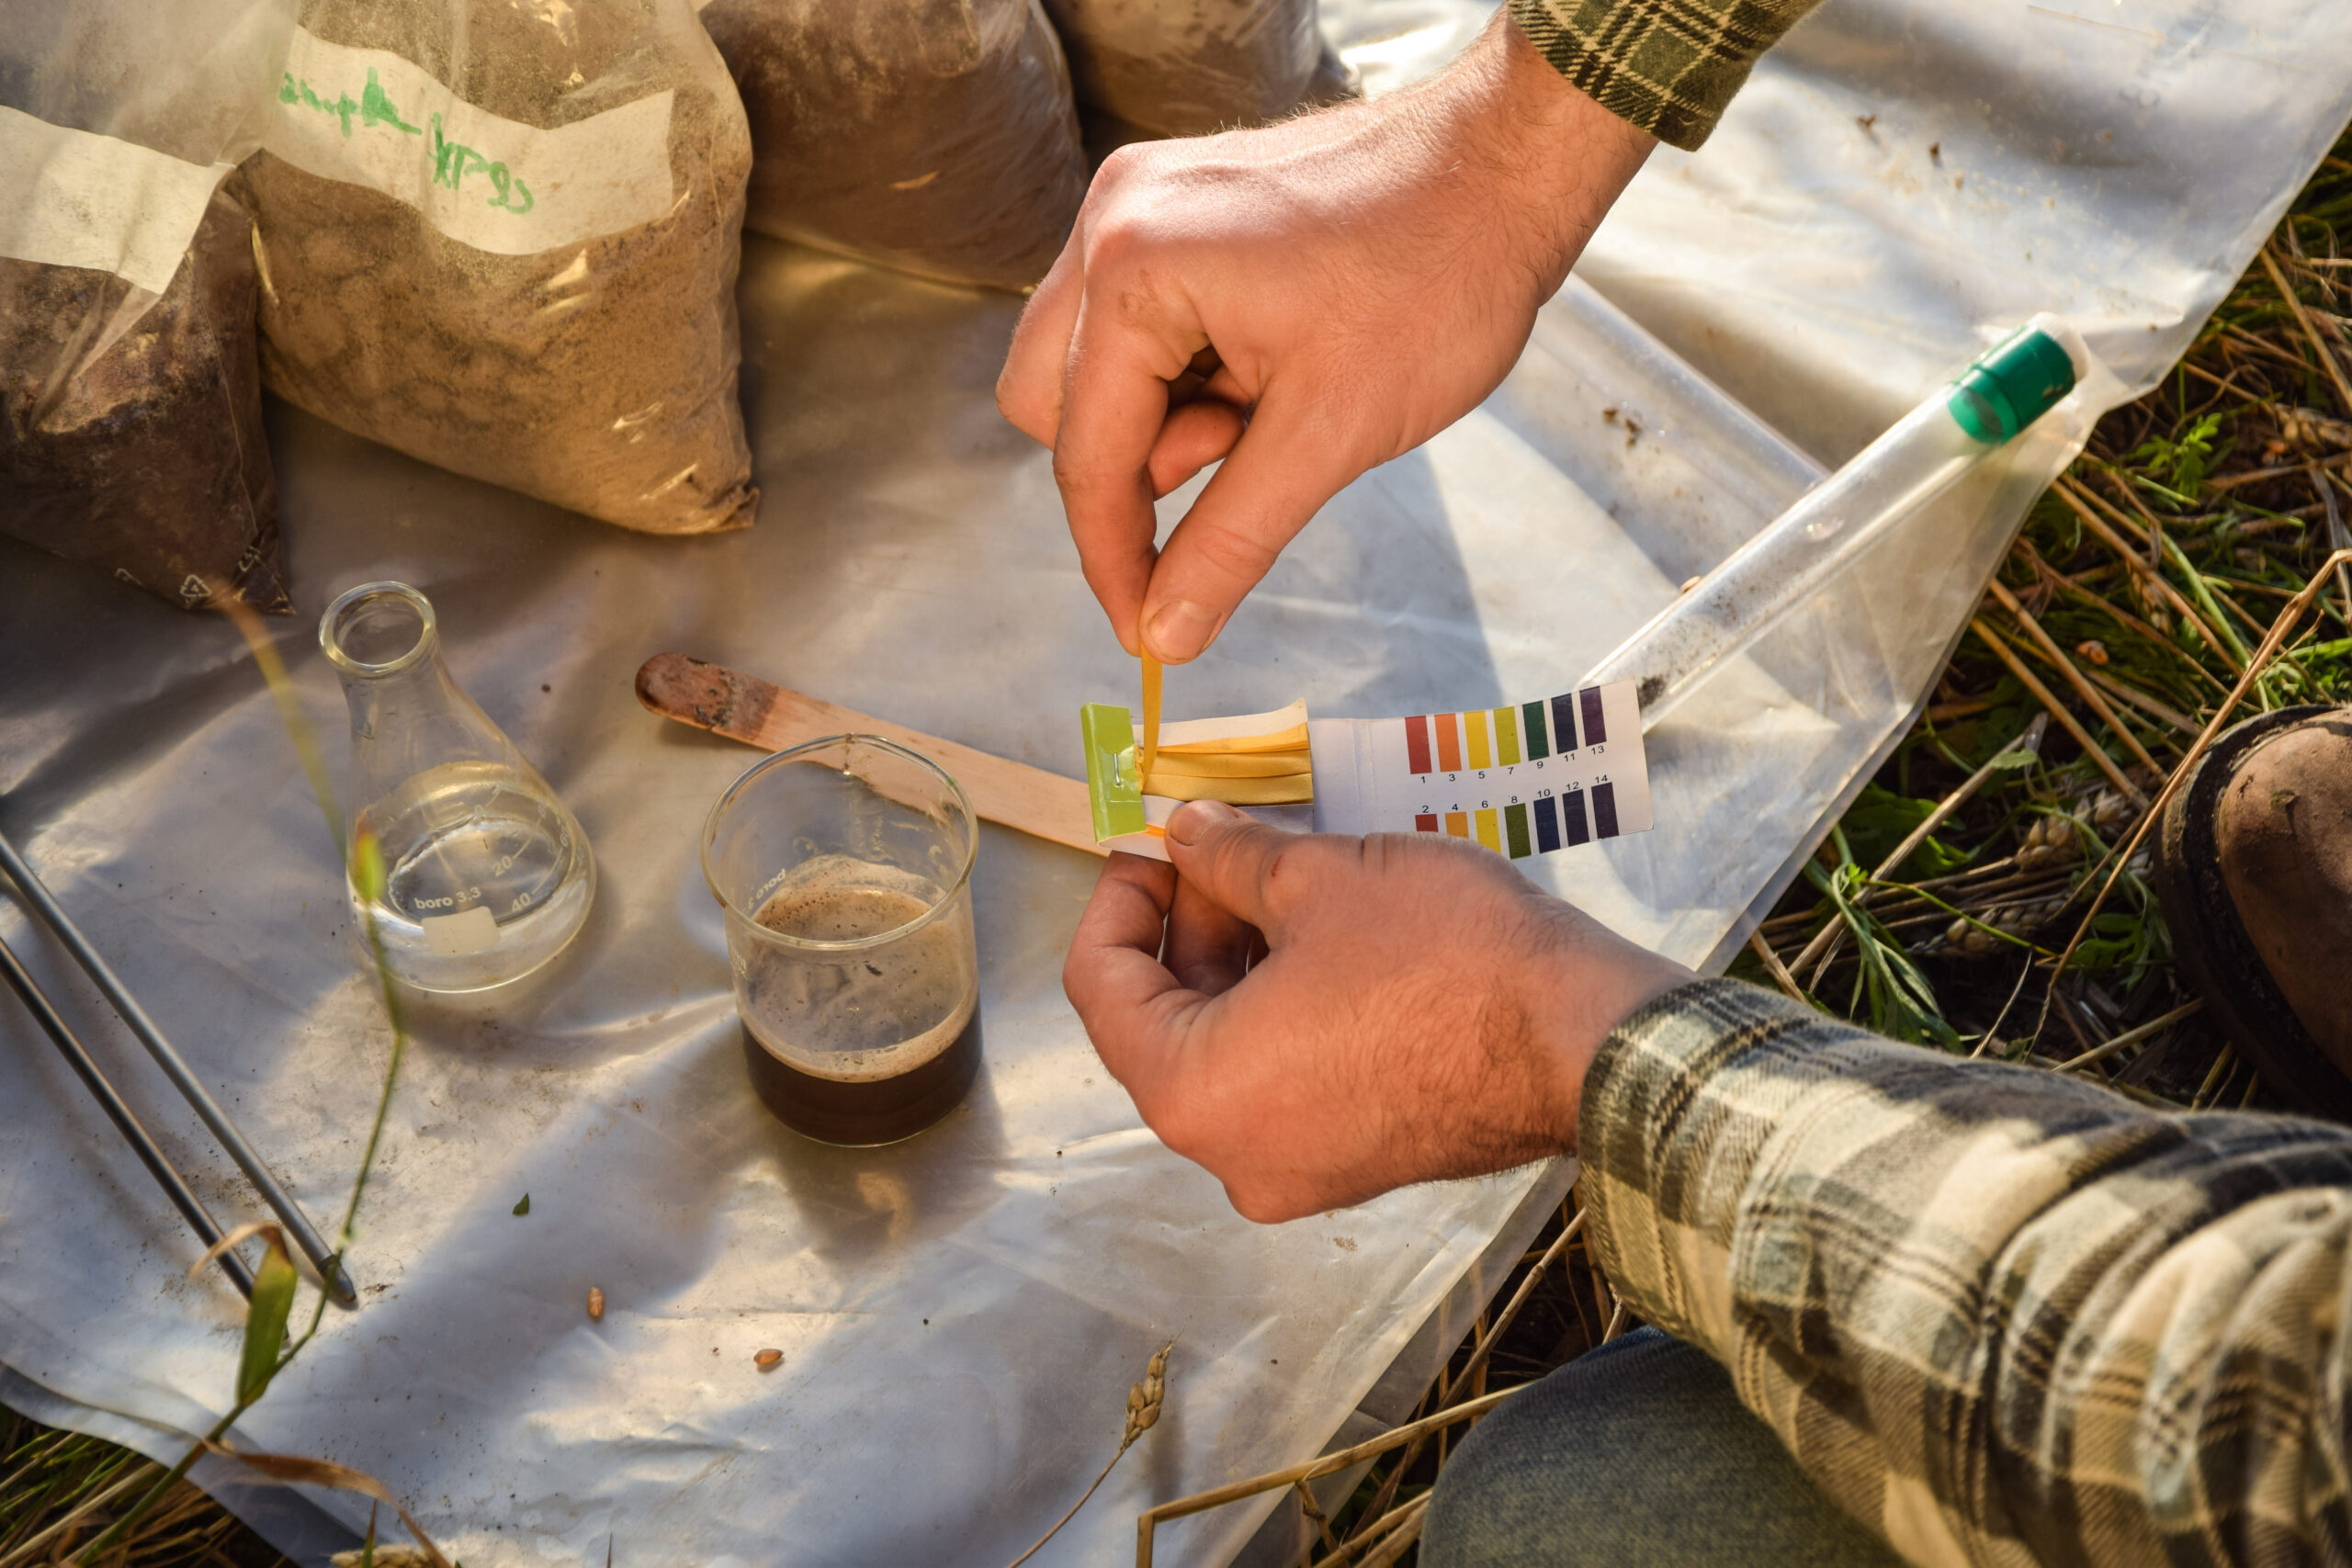
Laboratory testing of root-zone substrate samples and leachate extraction to isolate chemical treatment variables.
Troubleshooting Protocol: Isolating Root Causes and Statistical Verification
When conducting agronomic trials, anomalous data points inevitably arise. A sudden drop in runoff pH, a localized outbreak of powdery mildew, or an unexpected yield discrepancy on a single bench can derail the entire study if not systematically diagnosed and isolated:
1. The Step-by-Step Diagnostic Verification Sequence
When an unexpected visual symptom or divergent data point emerges in a trial block, follow this disciplined diagnostic sequence before assuming product failure or nutrient toxicity:
- Step 1: Sensor Calibration Audit: Immediately verify meter accuracy. Recalibrate pH probes in fresh pH 4.01 and 7.00 buffer standards; test conductivity pens in 1.413 dS/m calibration solution. Over 60% of apparent “nutrient drifts” in commercial trials are instrumentation calibration artifacts.
- Step 2: Hydraulic Emitter Uniformity Audit: Measure individual emitter discharge rates by placing catchment graduated cylinders beneath six emitters in the affected block for a 3-minute irrigation pulse. If emitter flow varies by more than ±7%, the root zone is receiving differing volume and leaching fractions, causing salt accumulation unrelated to fertilizer chemistry.
- Step 3: Pour-Through Leachate Extraction: Execute a standardized pour-through test or 1:2 substrate extraction to measure true interstitial pore-water EC and pH directly at the root zone, bypassing potential surface crust salts.
- Step 4: Certified Laboratory Tissue Confirmation: Harvest 20 recently matured fan leaves from the upper canopy of control and treatment blocks. Submit samples to an agricultural testing lab for ICP-OES elemental analysis. Compare leaf tissue nutrient percentages against established reference sufficiency curves. If tissue concentrations of the test element do not differ between control and treatment, the added nutrient failed to cross root membrane transport barriers.
2. Transpirational Mass Flow vs. Active Symplastic Loading
A critical source of misinterpretation in trial data is the failure to differentiate between transpirational mass flow and active symplastic ion transport. Elements such as calcium (Ca) and boron (B) move almost entirely through passive xylem mass flow driven by canopy transpiration. If a minor microclimate anomaly causes one trial bench to experience slightly higher air velocity or lower humidity, that bench will transpire a greater volume of water. Consequently, foliar tissue testing will report elevated calcium and boron levels on that bench, even though both control and treatment reservoirs contained identical calcium concentrations.
Conversely, mobile elements like nitrogen, phosphorus, and potassium are actively loaded into the root symplast and translocated via the phloem according to sink-source metabolic demand. By tracking continuous canopy leaf temperatures with thermal imaging sensors and logging local bench vapor pressure deficits, researchers can decouple transpirational mass-flow artifacts from true biochemically mediated active nutrient absorption.
3. Avoiding the Confounding Multi-Variable Trap
If a problem occurs during a trial run (such as a brief HVAC chiller failure or elevated canopy VPD), novice growers often attempt to “save the room” by altering multiple parameters at once: increasing feeding frequency, flushing substrates with unbuffered water, and applying foliar micronutrient sprays. Stacking corrections introduces severe chemical interference that completely invalidates the trial. If an uncontrollable facility malfunction compromises environmental parity across blocks, the proper agronomic decision is to document the excursion in the facility trial log, maintain steady baseline feeding, and discard the trial cycle rather than drawing flawed commercial conclusions from corrupted data.
Can we run a controlled nutrient trial across two different grow rooms to save space in our main flowering room?
Question sent by: Danielle Brooks, via email.
“We have two identical 24-light flowering rooms with the exact same LED fixtures and HVAC systems. Can we feed Room 1 our standard nutrient line as the control and Room 2 the new test nutrient program to evaluate the difference over a full harvest?”
Under no circumstances should you run a nutrient trial across two separate rooms. In controlled-environment agriculture, there is no such thing as two “identical” grow rooms. Even when rooms share identical blueprints, equipment models, and light fixtures, real-world physical dynamics introduce massive room-to-room confounding variables.
Ductwork static pressure, minor differences in supply grille balancing, variable compressor cycling, differences in external wall insulation exposure, and sensor calibration offsets invariably cause Room 1 and Room 2 to operate at slightly different canopy temperatures and vapor pressure deficits. A mere 1.0 °C difference in average leaf canopy temperature or a 0.2 kPa difference in VPD alters plant transpiration rate by 15% to 25%. A plant transpiring 20% more water draws significantly more calcium, boron, and nitrate through passive mass flow, dramatically inflating harvest yield and flower density completely independently of the nutrient bottle.
If you run Room 1 vs. Room 2, you are not testing a fertilizer product; you are testing the subtle thermodynamic and airflow discrepancies between two mechanical HVAC zones. Both control and treatment plants must share the exact same room airspace and identical benches arranged in a Randomized Complete Block Design.
Evidence Check: Separating Plant Nutrition from Marketing Anecdotes
The ultimate goal of a commercial nutrient trial is not merely to discover whether a product alters plant morphology, but to determine whether that alteration delivers a measurable financial return on investment (ROI). In commercial cultivation facilities operating under tight wholesale margin compression, scientific evaluation must separate physiological fact from retail hype:
- The Double-Blind Evaluation Protocol: Cultivators frequently suffer from confirmation bias: when an operator knows which bench received the premium $200-a-gallon additive, they subconsciously spend more time pruning, trellising, and inspecting those plants. To eliminate operator bias, commercial trials should be conducted double-blind: fertilizer stock concentrates must be coded simply as “Formula A” and “Formula B” by a facility manager. Cultivation technicians, trimmers, and post-harvest grading staff should have zero knowledge of which code corresponds to the test product until all final dried flower weights and laboratory cannabinoid panels are compiled.
- Statistical Significance vs. Random Variance: Never celebrate a 3% or 4% biomass increase without calculating statistical confidence. Apply a standard two-sample Student’s t-test or one-way ANOVA across your replicated plant data. If the resulting p-value is greater than 0.05, the observed yield difference is statistically indistinguishable from random noise, meaning the expensive test additive produced zero verified benefit.
- Net Economic Return on Investment (ROI): If an experimental bloom booster increases dry flower yield by 4.0%, but the product costs $0.12 per gallon of mixed fertigation solution across a 10,000-gallon flowering cycle, the additional fertilizer expenditure may completely wipe out the wholesale revenue gain from the extra flower. Commercial facilities must calculate the Incremental Cost-to-Revenue Ratio: divide the net wholesale value of the additional harvested flower by the total cost of the trial input. If the return ratio does not exceed 3:1, integrating the product into standard operating procedures represents a net financial loss.
By demanding rigorous mathematical and biological verification, cultivation directors protect their operational capital, eliminate ineffective retail additives, and build a high-performance, cost-effective cultivation program grounded in empirical agronomic science.
Controlled Cannabis Nutrient Trial Standard Operating Checklist
Execute and verify these critical experimental checkpoints before, during, and after conducting a commercial nutrient trial:
- Strict single-variable isolation is enforced; all environmental setpoints (PPFD, temp, RH, CO2, VPD) are identical.
- Trial utilizes genetically identical clones taken from a single verified mother plant on the exact same date.
- Cuttings are physiologically graded for identical stem caliper, root development, and initial vegetative vigor.
- Trial architecture uses Randomized Complete Block Design (RCBD) across multiple bench positions to eliminate microclimate bias.
- Sample size meets statistical power requirements (minimum 16 to 24 plants per treatment group across 3+ blocks).
- All input and runoff EC and pH meters are calibrated with fresh certified buffer solutions prior to every recording.
- Daily irrigation logs track delivered volume, leachate runoff volume, and calculated leaching fraction per block.
- In-situ substrate sensors verify identical volumetric water content (VWC) dry-back curves between control and test plants.
- Laboratory ICP-OES leaf tissue testing is conducted at mid-flower to confirm active elemental uptake into vascular tissue.
- Double-blind protocols are enforced during plant maintenance, harvesting, curing, trimming, and dry weight verification.
- Post-harvest statistical analysis (ANOVA / t-test, p < 0.05) and net financial ROI calculations are completed prior to facility rollout.
Scientific References
- Barker, A. V., & Pilbeam, D. J. (2015). Handbook of Plant Nutrition (2nd ed.). CRC Press, Boca Raton, FL.
- Bernstein, N., Gorelick, J., Zerahia, R., & Koch, S. (2019). Impact of environmental conditions and nutrient management on secondary metabolite synthesis in medical cannabis. Industrial Crops and Products, 139, 111467.
- Bugbee, B. (2004). Nutrient management in recirculating hydroponic culture. Acta Horticulturae, 648, 99-112.
- Marschner, H. (2012). Marschner’s Mineral Nutrition of Higher Plants (3rd ed.). Academic Press, London.
- Montgomery, D. C. (2017). Design and Analysis of Experiments (9th ed.). John Wiley & Sons, Hoboken, NJ.
- Sonneveld, C., & Voogt, W. (2009). Plant Nutrition of Greenhouse Crops. Springer, Dordrecht, Netherlands.
- Taiz, L., Zeiger, E., Møller, I. M., & Murphy, A. (2015). Plant Physiology and Development (6th ed.). Sinauer Associates, Sunderland, MA.
- Zheng, Y. (2021). Handbook of Cannabis Production in Controlled Environments. CRC Press, Boca Raton, FL.
Share this article
A quick overview of the topics covered in this article.