
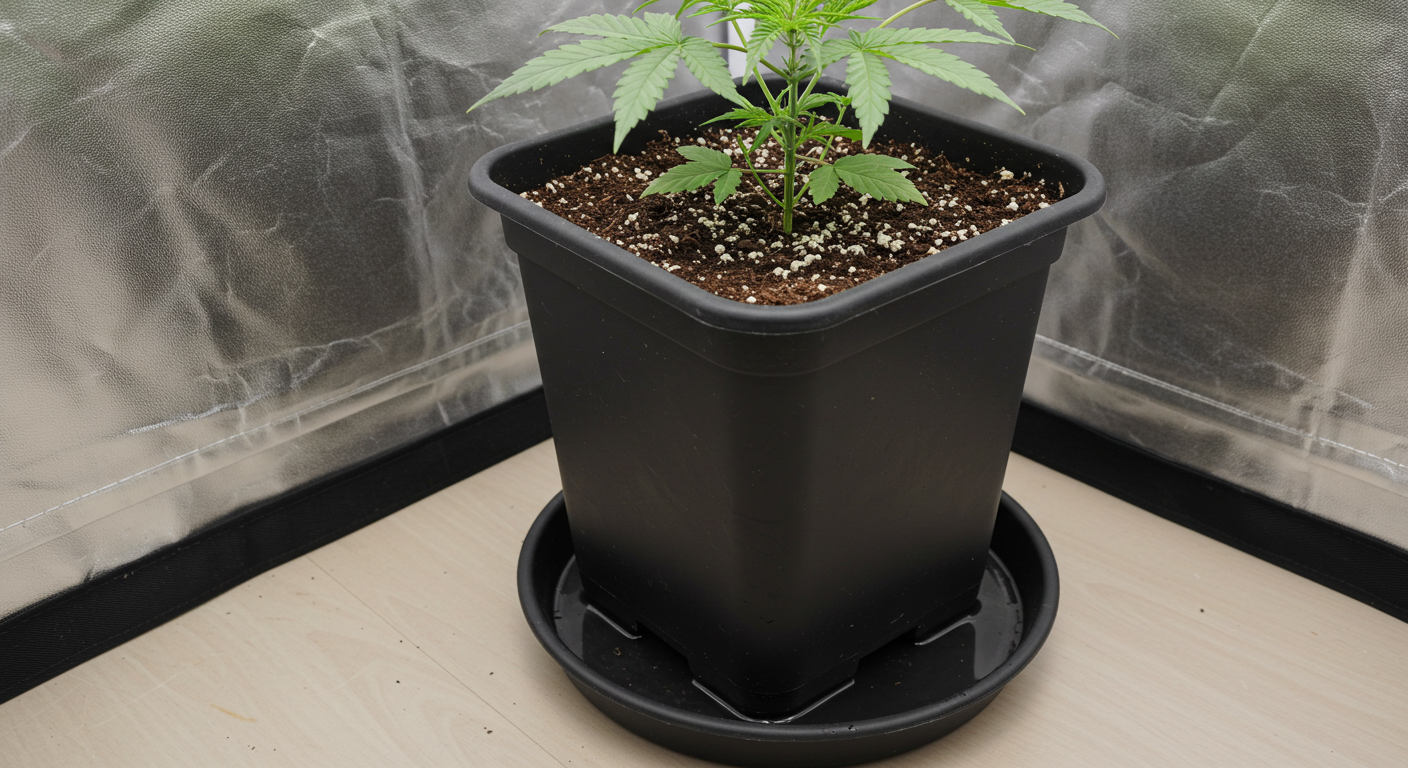
Cannabis Runoff Testing: Volume, EC, pH, and What the Numbers Really Mean
In soilless cannabis production, leachate drainage – universally referred to as runoff – serves as the primary daily operational window into the root zone. However, widespread misinterpretation of runoff data leads to severe cultivation failures. Inexperienced growers frequently treat leachate pH as an exact mirror of root-zone chemistry, panic over false-positive EC spikes caused by preferential channeling, or react to elevated salt readings by flushing with pure reverse osmosis (RO) water. Pure water flushing strips the cation exchange complex, induces osmotic lysis in root hairs, and permanently stalls floral bulking. To interpret runoff accurately, cultivators must separate raw volume from leaching fraction percentages, calculate Delta EC (ΔEC) against input fertigation, account for substrate exchange chemistry (such as coco coir buffering kinetics and peat cation release), and understand why leachate pH consistently deviates from true rhizosphere conditions. This comprehensive guide establishes standardized runoff sampling protocols, breaks down the physical mechanics of pore-water displacement, details diagnostic frameworks for inert and organic media, and provides a clinical SOP to resolve high-salinity root zones safely.
Biophysical Foundations: Pore-Water Dynamics vs Drainage Leachate
To accurately diagnose root-zone health from drainage water, one must first recognize that drainage leachate is not identical to the water inside substrate pores. In any containerized soilless system (such as coco coir chips, perlite, or rockwool granules), water is distributed across two primary physical domains: the micropore matrix and the macropore channels.
Micropores hold the true rhizosphere solution – the thin film of pore water immediately in contact with root epidermal hairs and root-cap mucilage. This solution is subjected to intense biological activity: roots consume dissolved oxygen, actively absorb nitrate, potassium, and calcium ions, and extrude organic acids, protons (H+), and bicarbonate (HCO3–) to balance electrical charge across cell membranes. Furthermore, continuous transpiration extracts pure water vapor into the plant canopy, leaving unassimilated fertilizer salts behind. Consequently, pore-water electrical conductivity (ECpore) inside micropores is constantly shifting.
Hydrodynamic dispersion and unsaturated hydraulic conductivity govern how water moves through these pore networks. According to Darcy’s Law modified for unsaturated porous media, gravitational downward flux occurs predominantly through large inter-particle voids (macropores). As fresh irrigation water enters the top of the container, it moves downward via piston displacement, pushing older pore water ahead of it. However, if substrate hydraulic conductivity is uneven or if dry-back has created hydrophobic air pockets, new solution channels rapidly through macropores while bypassing the capillary micropores.
What drips out of the container bottom into drainage trays – the runoff leachate – represents a dynamic composite blend: partially displaced old pore water mixed with freshly delivered irrigation solution. Understanding this dilution gradient and hydraulic displacement velocity is fundamental to preventing overcorrection and catastrophic flushing errors.
Systematic leachate collection and runoff analytics provide non-destructive insight into root-zone pore-water electrical conductivity and mineral accumulation.
How to Measure Cannabis Runoff Volume and EC
Measuring leachate accurately requires standardizing two interconnected agronomic variables: total leachate volume and leachate solute concentration. Measuring one without the other produces completely misleading conclusions.
1. Calculating the Leaching Fraction (LF)
Commercial horticulture evaluates irrigation volume through the Leaching Fraction (LF), expressed as the percentage of total applied irrigation solution that drains out of the container base:
Leaching Fraction (%) = (Volume_runoff / Volume_applied) × 100
For example, if an automated drip system delivers 1,000 mL of nutrient solution to a 3-gallon coco container and 200 mL of leachate collects in the drainage saucer, the leaching fraction is exactly 20%. Managing leaching fraction is the cultivator’s primary tool to control substrate electrical conductivity:
- Low Leaching Fraction (<10%): Conserves water and liquid fertilizer, but allows unabsorbed fertilizer salts (sulfates, phosphates, sodium, chloride) to accumulate rapidly inside substrate micropores. Over several days, evaporative concentration drives substrate EC to toxic levels.
- Target Leaching Fraction (15% to 25%): The agronomic gold standard for soilless hydroponics. Generates sufficient downward hydraulic head to displace concentrated pore water and sweep residual mineral crusts out of the container, maintaining root-zone EC within 0.2 to 0.4 dS/m of input fertigation.
- Excessive Leaching Fraction (>35%): Wastes substantial fertilizer mass, increases environmental wastewater runoff, and in dense substrates, can waterlog macropores, reducing substrate air-filled porosity below the critical 12% threshold and triggering root hypoxia.
2. The Delta EC (ΔEC) Mathematical Framework
Evaluating runoff EC in isolation without knowing input EC is completely meaningless. A runoff reading of 2.6 dS/m is perfectly healthy if the incoming feed is 2.4 dS/m, but represents severe salt buildup if the incoming feed is 1.4 dS/m. Cultivators must calculate Delta EC (ΔEC) on every test:
ΔEC = EC_runoff – EC_input
Tracking Delta EC across consecutive days reveals the exact metabolic trajectory of the crop:
- ΔEC between 0.0 and +0.4 dS/m: Equilibrium. The root zone is stable; ion uptake matches transpirational water demand.
- ΔEC > +0.8 dS/m: Severe salt accumulation. Solute mass is concentrating in the root zone; leaching fraction must be increased immediately.
- ΔEC < -0.3 dS/m: Depletion. The crop is consuming nutrients faster than fertigation is replenishing them; input feed EC should be stepped up.
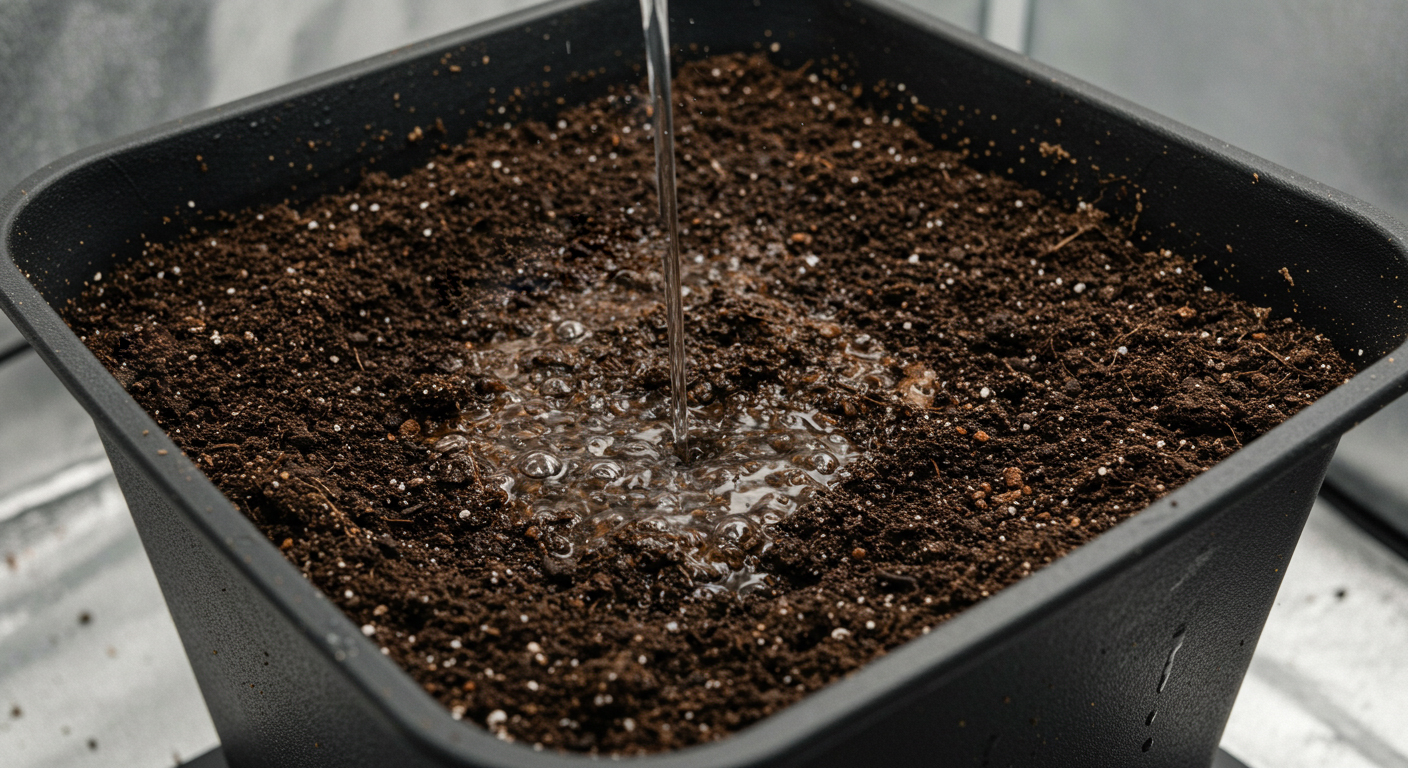
Volumetric leachate measurement determines the exact leaching fraction required to displace concentrated pore-water salts without inducing hypoxia.
How to Measure Runoff EC Correctly: Timing and Methodology
The physical methodology used to collect leachate dramatically influences the measured electrical conductivity. Collecting runoff improperly introduces massive sampling errors that can lead to disastrous overcorrections.
1. The Three Leachate Fractions: First Drip vs Core vs End Runoff
During a single fertigation cycle, the electrical conductivity of the drainage water changes continuously from the first drop to the last:
- Initial First-Drip Leachate (First 10% of runoff): As water first percolates out of the container base, it carries the highly concentrated mineral crusts that precipitated at the bottom of the pot during the inter-irrigation dry-back. This first-drip leachate frequently tests 1.5 to 2.5 dS/m higher than the true substrate core. Testing only this first flush produces false-positive panic.
- Composite Core Leachate (The Middle 80%): As irrigation continues, steady piston flow displaces the true bulk pore water. Collecting and homogenizing the entire composite volume of runoff yields the true representative EC.
- Trailing Leachate (Final 10%): By the end of a heavy irrigation event, the drainage consists almost entirely of newly applied input solution, reading virtually identical to the reservoir EC.
Standardized Protocol: Never test the first few drops. Allow the entire irrigation cycle to complete, collect the total leachate in a clean, non-reactive receptacle, agitate thoroughly to mix all fractions, and then insert your calibrated EC probe.
2. Timing Across the Daily Photoperiod
In multi-pulse high-frequency fertigation programs (4 to 8 feeding pulses per day), runoff EC varies depending on the time of day. The first irrigation pulse of the morning (Event 1) occurs after the longest substrate dry-back of the 24-hour cycle (the overnight dry-back). Consequently, Morning Leachate EC is naturally higher. The most agronomically representative measurement occurs during the second or third irrigation event of the day (P2 or P3), after the substrate has reached field container capacity and pore water has normalized.
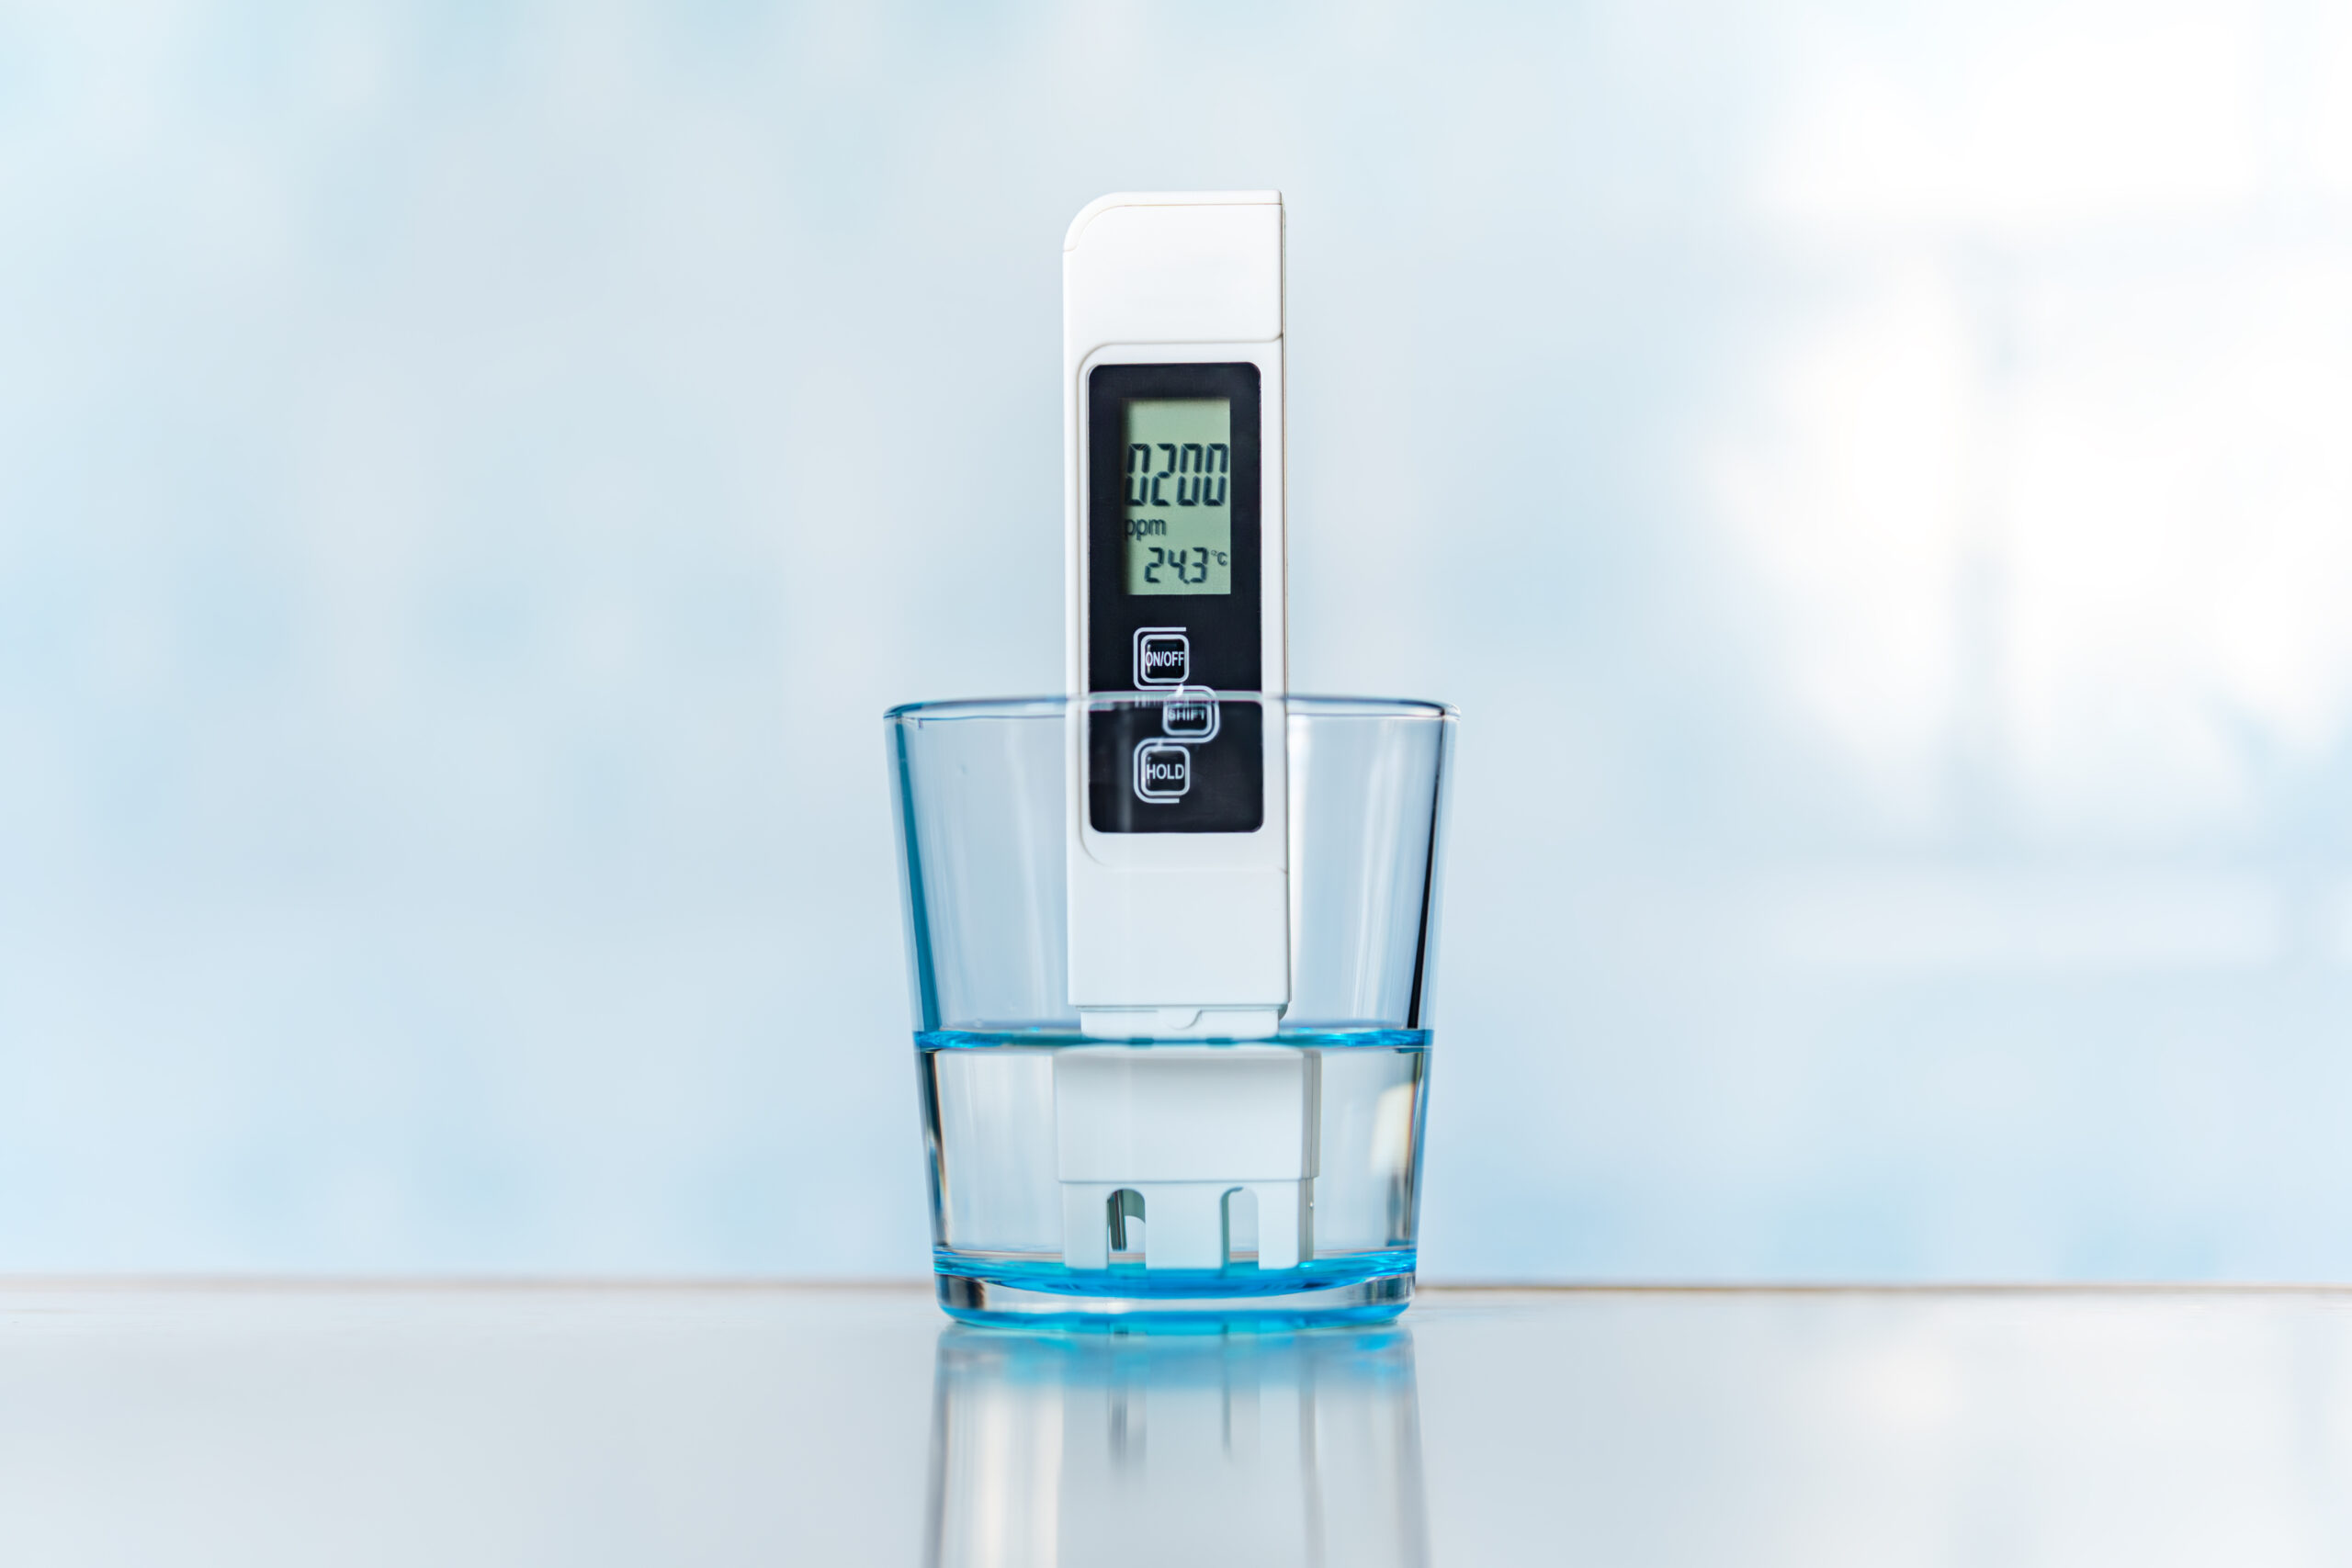
Digital probe meters require temperature compensation and two-point calibration to accurately differentiate between bulk salt load and localized pH drift.
Why Runoff pH Does Not Equal Root-Zone pH
One of the most persistent and damaging dogmas in cannabis cultivation is the belief that runoff pH accurately reflects the pH of the root zone. Thousands of growers observe a runoff pH of 5.3 or 6.8, assume their root zone is in catastrophic lockout, and immediately flush with alkaline or acidic water, severely damaging their crop. In reality, runoff pH is fundamentally misleading due to four distinct chemical mechanisms:
1. Carbon Dioxide Degassing Kinetics
Inside the substrate, intense cellular respiration by plant roots and beneficial aerobic microbes releases massive quantities of carbon dioxide (CO2). In the presence of moisture, dissolved CO2 forms carbonic acid (H2CO3), which dissociates into bicarbonate (HCO3–) and hydrogen ions (H+), temporarily lowering localized pore-water pH. When drainage water drips out of the container into an open collection saucer, it is exposed to atmospheric ambient air (approximately 420 ppm CO2). The dissolved CO2 rapidly outgasses into the atmosphere. According to Henry’s Law and Le Chatelier’s principle, as carbonic acid leaves the solution, the chemical equilibrium shifts, and the pH of the runoff water rises by 0.3 to 0.7 pH units within 15 to 30 minutes of sitting in the tray.
2. Preferential Channeling (Macropore Bypass Flow)
If a substrate dries back excessively between irrigations, the medium shrinks away from container walls, forming hydrophobic cracks and large vertical channels. When water is applied, the majority of the solution cascades down these wall cracks via gravitational bypass flow without penetrating the dense micropores where roots actually reside. The collected runoff reflects the pH of the freshly delivered input water or dry perimeter peat, not the true rhizosphere where nutrient exchange occurs.
3. Substrate Exchange Chemistry (CEC Effects)
In coco coir, raw unbuffered or partially buffered fibers contain high cation exchange sites that naturally adsorb divalent calcium (Ca2+) and magnesium (Mg2+) from the incoming water while releasing monovalent potassium (K+) and sodium (Na+). This rapid cation exchange alters the electrical neutrality of the percolating solution, causing transient shifts in drainage pH that bear zero correlation to the internal root surface pH.
4. The PourThru and Saturated Media Extract (SME) Standards
To obtain a true measurement of root-zone pH, commercial laboratories never rely on standard tray runoff. Instead, they use standardized academic extraction methods:
- The PourThru Method (Wright, 1986): The container is irrigated to full container capacity with standard nutrient solution. Exactly 60 minutes later, deionized water is carefully poured onto the substrate surface (typically 100 mL for a 1-gallon pot, 250 mL for a 3-gallon pot) to displace exactly 50 mL of unadulterated pore water out the base. This displaced 50 mL aliquot represents the true rhizosphere solution before microbial or atmospheric contamination occurs.
- 1:2 Substrate Extraction: One part substrate is mixed with two parts distilled water, agitated for 30 minutes, filtered through Whatman filter paper, and measured. This yields reliable pH and EC data across living organic soils and peat mixes.
Cannabis Runoff: When It Helps and When It Misleads
Runoff analytics are an invaluable operational compass when interpreted within their biophysical limits, but become highly destructive when misapplied.
When Runoff Testing Invaluable:
- Verifying Daily Leaching Fraction: Runoff volume confirms whether automated drip emitters are operating uniformly across a commercial bench. If Container A yields 50 mL runoff while Container B yields 400 mL, emitters are clogged or line pressures are unbalanced.
- Tracking Multi-Day Salt Accumulation: Monitoring Delta EC over 5 to 7 consecutive days provides unmistakable confirmation of whether the root zone is steadily accumulating unabsorbed mineral mass or maintaining healthy equilibrium.
- Verifying Substrate Reset Events: When executing a corrective flush or recipe change, runoff EC confirms exactly when the accumulated salts have been completely displaced from the container base.
When Runoff Testing Misleads:
- Evaluating Soil and Living Organic Beds: In biologically active living soils, mineral nutrients are bound within organic matter, humic acids, and microbial biomass. Forcing large runoff volumes through living soil washes away beneficial humic complexes, leaches mobile nitrates, and starves the soil food web. Living soils should be watered to 55% to 65% container capacity with zero to minimal (5%) runoff.
- Single-Point Panic Reactions: Making major fertilizer adjustments based on a single erratic runoff reading without re-verifying meter calibration or checking input solution is the leading cause of induced crop failure.
- Directly Diagnosing Specific Deficiencies: Runoff EC measures total dissolved salts; it cannot tell you whether a high reading is caused by excess potassium, excessive sulfate, or harmless sodium chloride from tap water. Only laboratory foliar tissue analysis can reveal specific elemental balances.
What High Runoff EC Really Means: Osmotic Stress and Salt Chemistry
When runoff EC climbs significantly above input EC (Delta EC > +1.0 dS/m), root cortical cells are subjected to severe osmotic stress. Osmotic pressure (Π) is governed by the van ‘t Hoff relation, directly proportional to total solute molarity. As substrate pore water concentrates, the chemical potential of water outside the root falls below the water potential inside root cells.
Under high osmotic pressure, root cells cannot take up water via passive diffusion. Instead, water is physically drawn out of juvenile root hairs into the saline substrate, causing cellular plasmolyis (dehydration). The plant responds by closing stomata to conserve water, which halts photosynthetic carbon dioxide fixation and causes leaf surface temperatures to spike by 3 °C to 5 °C. Concurrently, high concentrations of unabsorbed potassium and ammonium outcompete calcium and magnesium at root membrane transporters, triggering marginal necrotic burn on upper fan leaves and young floral colas.
To survive sustained osmotic tension, cannabis roots must perform osmotic adjustment. Root cells synthesize compatible low-molecular-weight organic osmolytes – primarily proline, glycine betaine, and soluble hexose sugars – to lower their internal cellular osmotic potential below that of the surrounding substrate pore water. This biochemical adaptation carries an immense energetic metabolic penalty. Cellular ATP that would otherwise fuel vegetative canopy growth, floral bract division, and terpene synthase enzymes is diverted into synthesizing protective osmolytes, permanently depressing potential harvest yield.
Furthermore, cultivators must distinguish between inorganic fertilizer salt accumulation and toxic ion accumulation. If high runoff EC is driven by balanced macronutrients (potassium, calcium, nitrate), a modest increase in leaching fraction rapidly realigns the root zone. However, if source tap water contains high concentrations of sodium (Na+ > 50 mg/L) or chloride (Cl– > 70 mg/L), these non-essential ions accumulate exponentially inside substrate pores. Because sodium displaces potassium and calcium on cell membranes while chloride competitively blocks nitrate uptake, high sodium-chloride runoff EC induces severe physiological leaf tip necrosis even at moderate total electrical conductivity.
Grower Question: Responding to a 4.2 Runoff EC Spike in Rockwool
Our rockwool slab runoff EC jumped to 4.2 dS/m in Week 4 of flower. Should we flush with RO water?
Question sent by: Caleb Thorne, via email.
“We are cultivating an elite cut of Wedding Cake in 1-meter rockwool slabs under 1,000 μmol/m2/s LED fixtures. Our input feed is 2.2 dS/m at pH 5.8. Today during our second irrigation pulse, our slab drainage EC registered at 4.2 dS/m, and the runoff pH dropped down to 5.2. The serrated edges of our top colas are starting to show brown necrotic burn. Should we immediately flush the slabs with pure reverse osmosis water to bring the EC back down to 2.0?”
Caleb, absolutely do not flush with pure RO water. Flushing saturated rockwool slabs with pure water causes a catastrophic osmotic shock. When you replace a 4.2 dS/m saline root zone with 0.0 dS/m pure water, water rushes into root cells with violent hydrostatic force, rupturing delicate root hair membranes (osmotic lysis). Furthermore, pure water strips all dissolved calcium from root surfaces, permanently stalling floral cell division right at the peak of your Week 4 stretch exit.
Instead of an RO flush, you must execute a stepped volumetric reset using a complete, balanced nutrient solution:
- Formulate Reset Feed: Mix a complete floral baseline nutrient solution at an input EC of exactly 1.4 to 1.5 dS/m, buffered to pH 5.8 to 6.0. Ensure full-spectrum calcium (120 ppm Ca) and magnesium (50 ppm Mg) are present.
- Execute Controlled Leaching: Administer multiple small pulses (150 mL per dripper every 20 minutes) until you achieve a generous 35% to 40% leaching fraction across the slab. This gradual hydraulic displacement gently sweeps the concentrated salts out of the rockwool fiber matrix without bursting root cells.
- Recalibrate Daily Leaching: Your EC spiked to 4.2 because your plants were transpiring water faster than you were supplying it, and your daily leaching fraction was too small (<10%). Once runoff EC drops back to 2.5 dS/m, resume feeding at an adjusted input EC of 1.9 dS/m (down from 2.2 dS/m) and increase your daily leaching fraction target to 20% to 25%. This permanently eliminates the salt creep while keeping bud bulking on track.
Substrate Dynamics: Coco Coir vs Rockwool vs Peat vs Living Soil
How you interpret and act on runoff data depends entirely on the physical and chemical characteristics of your growing medium:
1. Coco Coir Substrates
Coco coir has a high Cation Exchange Capacity (CEC 40 to 90 cmol/kg). It binds calcium and magnesium tightly while releasing potassium into the soil solution. In coco, runoff EC should track between +0.2 and +0.5 dS/m above input feed. Because coco fibers are naturally spongy, they hold substantial water at field capacity while maintaining 15% to 20% air-filled porosity. If coco dries back beyond 30% VWC, salt crystallization occurs rapidly on particle surfaces, causing runoff EC to spike dramatically on the subsequent feeding event.
2. Rockwool (Stone Wool)
Rockwool is an entirely inert fibrous matrix with zero CEC and zero buffering capacity. What you feed is exactly what the plant receives. Rockwool can hold up to 85% volumetric water content while maintaining exceptional air-filled porosity. In rockwool crop steering, cultivators intentionally allow slab EC to rise during generative phases (Weeks 1-3) through larger dry-backs, and then drive slab EC down during vegetative bulking phases (Weeks 4-6) through frequent irrigation pulses and higher leaching fractions.
3. Sphagnum Peat-Based Mixes
Peat is inherently acidic (pH 3.5 to 4.5) and is amended commercially with calcitic or dolomitic limestone to stabilize substrate pH between 5.8 and 6.2. As the crop consumes nutrients and root exudates acidify the rhizosphere over an 8-to-10 week bloom cycle, the limestone buffer dissolves. Runoff pH from peat mixes naturally drifts downward in late flower. Attempting to force peat runoff pH upward by pouring caustic potassium hydroxide (pH Up) into the reservoir will scorch roots; instead, maintain balanced nitrate feeding, which stimulates roots to extrude alkaline bicarbonate ions.
4. Perlite and Expanded Clay Hydroponics
Coarse perlite and expanded clay pebbles (Hydroton) possess macro-porosities exceeding 50% with near-instantaneous gravitational percolation. In these media, water retention is low and capillary suction is minimal. Leachate runoff drains immediately after irrigation stops. In recirculating and drain-to-waste systems using coarse aggregates, runoff EC should match input EC within ±0.1 to ±0.2 dS/m; any wider discrepancy indicates severe emitter maldistribution or localized dry-salt crusting on top pebbles.
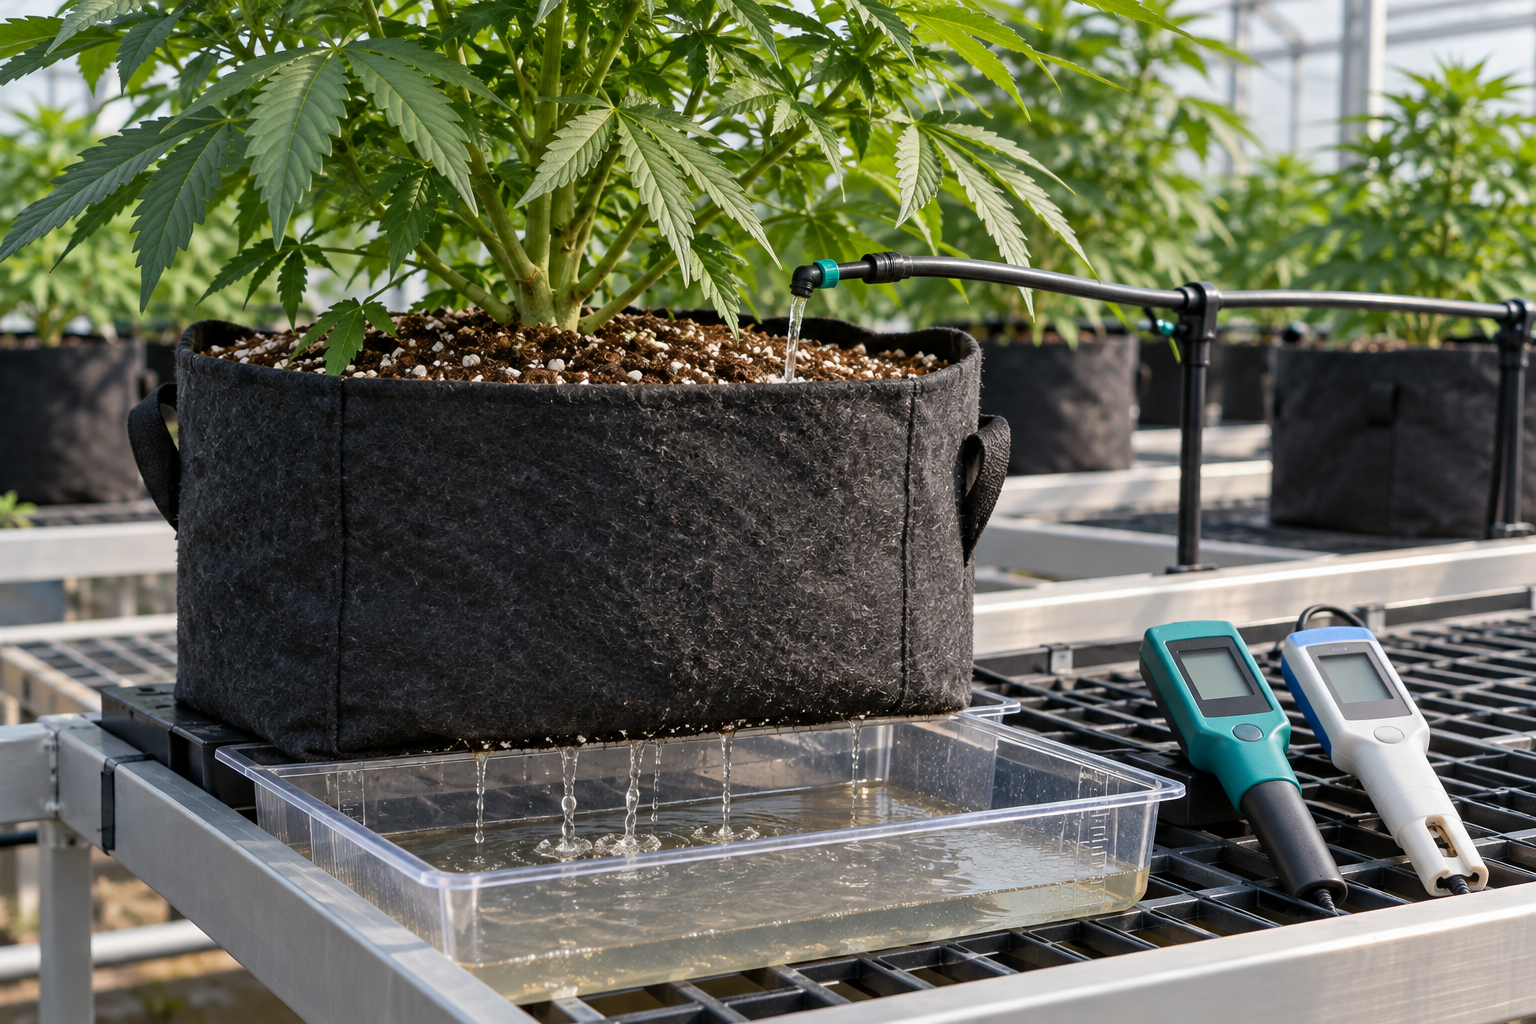
Corrective stepped leaching using a reduced-EC balanced nutrient solution safely resets elevated root-zone salinity without stripping the coco cation buffer.
Root-Zone Leaching Fraction and Delta EC Benchmark Matrix
Effective root-zone steering requires establishing rigorous baseline thresholds across every phase of plant development. Cultivators should evaluate three interdependent data streams simultaneously: Input Electrical Conductivity, Daily Leaching Fraction Percentage, and Delta EC (ΔEC). When all three metrics operate within their physiological ranges, the crop achieves maximum nutrient assimilation velocity without salt accumulation.
The following empirical matrix establishes established operational benchmarks for managing leachate across all developmental stages of cannabis in soilless culture under 900 to 1,100 μmol/m2/s PPFD and balanced environmental VPD (1.1 to 1.4 kPa):
| Growth Stage | Target Input EC (dS/m) | Optimal Runoff EC (dS/m) | Target Delta EC (ΔEC) | Target Leaching Fraction (%) | Action Threshold (High EC Reset) |
|---|---|---|---|---|---|
| Seedlings & Clones | 0.8 – 1.2 | 0.9 – 1.3 | 0.0 to +0.2 | 10% – 15% | Runoff EC > 1.6 dS/m |
| Early Vegetative (Weeks 1-2) | 1.3 – 1.6 | 1.4 – 1.8 | +0.1 to +0.3 | 15% – 20% | Runoff EC > 2.2 dS/m |
| Late Vegetative (Weeks 3-5) | 1.7 – 2.1 | 1.9 – 2.4 | +0.2 to +0.4 | 15% – 20% | Runoff EC > 2.8 dS/m |
| Early Bloom / Stretch (Weeks 1-3) | 2.0 – 2.4 | 2.3 – 2.9 | +0.3 to +0.6 | 12% – 18% | Runoff EC > 3.4 dS/m |
| Mid-Bloom Bulking (Weeks 4-6) | 2.2 – 2.6 | 2.4 – 3.0 | +0.2 to +0.4 | 20% – 25% | Runoff EC > 3.6 dS/m |
| Late Flower / Senescence (Weeks 7-9) | 1.2 – 1.6 | 1.4 – 2.0 | +0.1 to +0.4 | 20% – 30% | Runoff EC > 2.5 dS/m |
The Stepped Volumetric Reset SOP: Resolving Root-Zone Crises
When runoff testing confirms that substrate salinity has breached critical thresholds (ΔEC > +1.0 dS/m or runoff EC > 3.8 dS/m in coco/rockwool), execute this clinical three-phase remediation SOP:
Phase 1: Verification and Diagnostics
Before altering any irrigation parameters, verify the accuracy of your diagnostic instruments:
- Calibrate your digital EC meter using a certified 1,413 μS/cm (1.41 dS/m) potassium chloride reference standard.
- Calibrate your pH meter using fresh pH 4.01 and pH 7.00 buffer solutions.
- Measure the incoming reservoir feed directly at the dripper emitter to confirm that dosing injectors have not malfunctioned.
Phase 2: The Stepped Reset Fertigation
Never use plain water. Formulate a complete, balanced reset nutrient solution:
- Mix input solution to 50% to 60% of standard feed strength (typically 1.2 to 1.4 dS/m EC).
- Adjust pH to exactly 5.8 (for coco and rockwool) or 6.0 (for peat).
- Administer three consecutive irrigation pulses spaced 30 minutes apart to deliver a cumulative 35% to 40% leaching fraction. The reduced-EC solution creates a gentle osmotic gradient that safely dissolves crystallized salts, sweeps stagnant pore water out of the pot, and preserves the calcium-magnesium saturation on substrate exchange sites.
Phase 3: Operational Recalibration
Following the reset, collect trailing runoff to verify that leachate EC has dropped back into the acceptable target range. For the subsequent 5 to 7 days, reduce standard input feed EC by 0.3 to 0.4 dS/m and increase daily irrigation frequency to maintain smaller substrate dry-backs, preventing evaporative solute concentration from recurring.
Runoff Monitoring Standard Operating Checklist
Enforce these daily checkpoints to ensure accurate, actionable leachate monitoring across all cultivation benches:
- EC and pH meters are calibrated bi-weekly using certified reference calibration solutions.
- Leaching fraction (%) is calculated daily by measuring both total applied volume and total collected runoff volume.
- Delta EC (ΔEC) is calculated daily; Delta EC exceeding +0.6 dS/m triggers an immediate leaching fraction increase.
- First-drip runoff is never used for diagnosis; composite core leachate is thoroughly mixed before probe immersion.
- Leachate samples are measured within 5 minutes of collection to prevent CO2 degassing from distorting pH readings.
- Runoff pH is treated as an indicator of trend direction rather than an absolute measurement of root-zone pH.
- Pure water flushing is strictly banned; high salinity resets utilize stepped 1.2 to 1.4 dS/m balanced nutrition.
- Drip emitters are inspected weekly for flow rate uniformity to prevent channeling and uneven pot saturation.
- Living soil beds are maintained at 55% to 65% moisture capacity with zero forced runoff to protect soil biology.
- Fertilizer recipe adjustments are capped at 15% to 20% shifts per iteration, verified by follow-up testing in 48 hours.
Scientific References
- Argo, W. R., & Fisher, P. R. (2002). Understanding pH Management for Container-Grown Crops. Meister Publishing, Willoughby, OH.
- Bernstein, N., Gorelick, J., Zerahia, R., & Koch, S. (2019). Impact of environmental conditions and nutrient availability on secondary metabolite production in medical cannabis. Industrial Crops and Products, 138, 111467.
- Cavins, T. J., Whipker, B. E., Fonteno, W. C., Harden, B., McCall, I., & Gibson, J. L. (2000). Monitoring and Managing pH and EC Using the PourThru Extraction Method. Horticultural Information Leaflet 590, North Carolina State University.
- Hilhorst, M. A. (2000). A pore water conductivity sensor. Soil Science Society of America Journal, 64(6), 1922-1925.
- Marschner, H. (2012). Marschner’s Mineral Nutrition of Higher Plants (3rd ed.). Academic Press, London.
- Stanghellini, C., & Voogt, W. (2019). Managing nutrition in closed-loop and open-drain hydroponic greenhouse systems. HortScience, 54(5), 788-795.
- Wright, R. D. (1986). The pour-through nutrient extraction procedure. HortScience, 21(2), 227-229.
- Zheng, Y. (2021). Handbook of Cannabis Production in Controlled Environments. CRC Press, Boca Raton, FL.
Share this article
A quick overview of the topics covered in this article.