Cannabis PPFD and DLI by Growth Stage: Seedlings, Clones, Vegetative Growth, and Flowering
There is no single PPFD number that every cannabis plant should receive from seedling to harvest. The useful target changes with growth stage, photoperiod, canopy development, cultivar, root health, climate control, carbon dioxide, and how evenly the fixture distributes light. A seedling with a few small leaves cannot use the same instantaneous photon load as an established flowering canopy. An unrooted cutting has a different priority again: it must maintain leaf function while forming roots, not maximize daily carbon gain.
That is why PPFD and DLI should be used together. PPFD tells you the photon density arriving at the canopy right now. DLI tells you how many of those photosynthetic photons accumulate over the full light period. The same 500 µmol/m²/s PPFD delivers about 32.4 mol/m²/day over 18 hours but only 21.6 mol/m²/day over 12 hours. The fixture has not changed. The daily photon dose has.
For many home and small controlled-environment grows, a practical starting approach is roughly 150-250 µmol/m²/s for established seedlings, about 90-150 µmol/m²/s for unrooted cuttings, 300-600 µmol/m²/s for established vegetative plants, and 600-1,000 µmol/m²/s for flowering plants, then adjust from measurements and plant response. These are working bands, not biological laws. Published cannabis research has used values both below and far above them, and the evidence is much stronger for established vegetative and flowering plants than for a universal seedling optimum.
The goal of this resource is to show how to use those numbers without turning them into folklore. We will separate evidence from convention, calculate DLI correctly, map the actual canopy instead of trusting one center reading, and explain why a plant can be underlit in one corner and overdriven at the center under the same fixture.
Use Stage Targets as Starting Bands, Not Fixed Setpoints
The most useful answer to “How much PPFD does cannabis need?” is a set of measured starting bands with explicit limits. A target should tell you where to begin, how much daily light that creates at the chosen photoperiod, what evidence would justify increasing it, and what signs should make you stop and investigate.
Published cannabis studies do not establish one universal optimum for every cultivar and stage. Flowering trials have reported higher flower yield as PPFD increased from 600 to 1,000 µmol/m²/s, and another indoor study found dry inflorescence yield increasing across a broad 120 to 1,800 µmol/m²/s canopy-level gradient. Those results are important, but they do not mean every home grow should be driven at 1,800 PPFD. The plants were grown under controlled research conditions, the economics of electrical light were not identical to a home grow, cultivar response can differ, and a high-light room creates higher demand for cooling, dehumidification, irrigation, root function, and carbon dioxide supply.
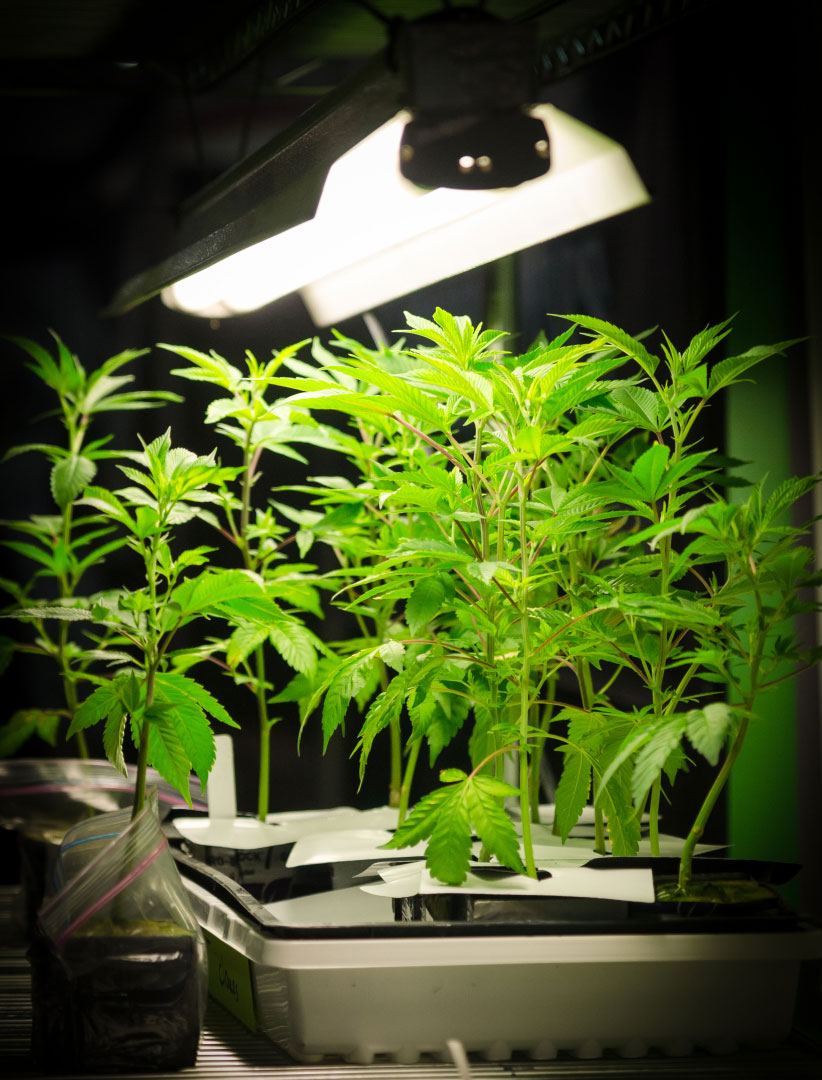
At the other end of the life cycle, cannabis propagation studies have rooted cuttings around 90 to 125 µmol/m²/s PPFD under controlled conditions. A commercial-scale study described clones at about 94 µmol/m²/s under a 24-hour photoperiod, while other cannabis research rooted cuttings around 120-125 µmol/m²/s under 16-18 hour days. These are examples of successful protocols, not proof that 94, 120, or 125 is the one correct clone target.
PPFD target versus biological optimum
A PPFD target is an operating value chosen for a particular canopy, stage, and environment. A biological optimum would require evidence showing that a specific intensity maximizes the desired outcome across defined conditions. Cannabis research has not established one universal optimum for all cultivars, stages, spectra, rooms, and production goals. Weedth therefore uses practical starting bands and an adjustment procedure rather than presenting one number as law.
PPFD for Cannabis: Stage Targets, Measurement, and Adjustment
The table below is a practical framework for indoor broad-spectrum lighting. It is deliberately conservative at early stages and places the stronger evidence where it belongs: established plants. The DLI ranges are calculated from the PPFD and example photoperiods shown. They are not independent recommendations.
| Stage | Practical starting PPFD | Example photoperiod | Approximate DLI from that combination | How to interpret it |
|---|---|---|---|---|
| Unrooted clones / fresh cuttings | About 90-150 µmol/m²/s | 16-18 h is common in research and practice | About 5.2-9.7 mol/m²/day | Keep leaf function active while rooting. High light is not the priority before roots establish. |
| Established seedlings | About 150-250 µmol/m²/s | 16-18 h | About 8.6-16.2 mol/m²/day | A working band, not a cannabis-wide optimum. Increase only as leaf area, roots, and water use develop. |
| Rooted clones / early vegetative | About 200-400 µmol/m²/s | 18 h | About 13.0-25.9 mol/m²/day | Useful during acclimation and canopy establishment. Watch for rapid changes in water demand. |
| Established vegetative growth | About 300-600 µmol/m²/s | 18 h | About 19.4-38.9 mol/m²/day | Research commonly uses the mid-400s PPFD in vegetative phases. Higher DLI can support more vigor when the system keeps up. |
| Flowering, conventional starting band | About 600-1,000 µmol/m²/s | 12 h | About 25.9-43.2 mol/m²/day | Supported by several controlled cannabis studies as a productive range. It is not a hard ceiling. |
| High-intensity flowering | Above 1,000 µmol/m²/s | Usually around the flowering photoperiod being tested | Above 43.2 mol/m²/day at 12 h | Advanced territory. Research shows cannabis can respond above 1,000, but room control, cultivar, energy cost, and acclimation become increasingly important. |
Do not turn this table into a dimmer recipe
The ranges are starting points for a healthy canopy, not instructions to force a stressed plant to a stage number. A plant with root disease, severe drought, nutrient imbalance, transplant shock, heat stress, or poor airflow may use much less light effectively. Fix the limiting condition before assuming that higher PPFD is the answer.
Why stage labels are not enough
Two plants can both be called “vegetative” and have completely different light-capturing capacity. One may be a freshly rooted clone with four small leaves. The other may fill a square meter with trained branches. The larger plant has more photosynthetic surface, a larger root system, greater transpiration capacity, and a different canopy architecture. Calling both plants “veg” does not make their useful PPFD identical.
The same problem exists in flowering. Week 1 of transition, peak flower bulking, and late flower are not physiologically identical. Canopy height changes, leaf area changes, flower mass increases, water use can shift, and the room may become harder to dehumidify. A stage chart should therefore begin the conversation, not end it.
Weedth Grower Note: The safest way to use a target is to measure the current canopy, change one lighting variable, record the new PPFD and DLI, then watch new growth and whole-canopy behavior. A target that cannot be verified is only a guess.
Why more light can increase yield without increasing potency in the same way
One of the most important findings in cannabis lighting research is that biomass response and cannabinoid concentration are not the same outcome. In the 2021 indoor intensity-gradient study, dry flower yield increased as canopy PPFD increased across the tested range, while cannabinoid potency did not rise in parallel. A 2022 study comparing 600, 800, and 1,000 µmol/m²/s also reported higher flower yield at greater intensity, while ultraviolet treatments did not produce the expected cannabinoid effect.
This distinction prevents a common mistake. A productive PPFD target is not automatically a “more potent” target. Light can increase the amount of flower produced, change morphology, alter resource demand, and sometimes change specific metabolites, but the chemical response depends on genotype and conditions. If the goal is consistent quality, light intensity should be optimized as part of the whole environment rather than treated as a direct potency dial.
Understand PPFD, DLI, Photoperiod, and Their Limits
PPFD and DLI answer different questions. PPFD is an instantaneous rate. DLI is an accumulated dose. You need both because cannabis photoperiod changes across the life cycle, and the same PPFD can produce very different daily photon totals.
PPFD is what arrives at a surface each second
Photosynthetic photon flux density is measured in micromoles of photons per square meter per second, written µmol/m²/s. Conventional PPFD refers to photons in the 400-700 nm photosynthetically active radiation range. A quantum sensor measures the photons arriving at its sensing surface. That means PPFD is always tied to a location, height, orientation, fixture setting, and surrounding geometry.
A fixture does not “have a PPFD” in the same way it has an electrical wattage. It creates a spatial light field. The center may receive 900 µmol/m²/s while a corner receives 550. Move the fixture, change its hanging height, dim it, raise the canopy, add another fixture, or change reflective surfaces and the map changes.
DLI adds PPFD across the light period
When electric-light PPFD is reasonably constant, daily light integral can be calculated as:
DLI = PPFD × light hours × 3,600 ÷ 1,000,000
The shorter form is PPFD × hours × 0.0036. The result is expressed in mol/m²/day. Virginia Cooperative Extension uses this same relationship when explaining supplemental lighting. The mathematics is straightforward; the biological interpretation is the difficult part.
| Average PPFD | 16-hour DLI | 18-hour DLI | 12-hour DLI |
|---|---|---|---|
| 100 µmol/m²/s | 5.76 | 6.48 | 4.32 |
| 150 µmol/m²/s | 8.64 | 9.72 | 6.48 |
| 200 µmol/m²/s | 11.52 | 12.96 | 8.64 |
| 300 µmol/m²/s | 17.28 | 19.44 | 12.96 |
| 400 µmol/m²/s | 23.04 | 25.92 | 17.28 |
| 500 µmol/m²/s | 28.80 | 32.40 | 21.60 |
| 600 µmol/m²/s | 34.56 | 38.88 | 25.92 |
| 800 µmol/m²/s | 46.08 | 51.84 | 34.56 |
| 1,000 µmol/m²/s | 57.60 | 64.80 | 43.20 |
The same DLI does not guarantee the same plant response
DLI is extremely useful, but it does not erase photoperiod or intensity. For example, 400 µmol/m²/s for 18 hours and 600 µmol/m²/s for 12 hours both deliver 25.92 mol/m²/day. Cannabis may not respond identically because a photosensitive cultivar uses night length as a developmental signal, and because instantaneous intensity influences leaf physiology, canopy penetration, temperature, and acclimation.
This matters most when growers try to “trade” hours for intensity. During vegetative growth, increasing hours can raise DLI while maintaining a moderate PPFD, but the light schedule must still maintain the intended vegetative state. During flowering, extending the day is not a free DLI increase. A 2024 study found that two THC-dominant cultivars could flower under 13-hour days at 540 µmol/m²/s and produced greater yield than the 12-hour treatment, but one cultivar showed a small delay in flowering initiation. That is evidence that some cultivars tolerate longer flowering photoperiods, not proof that every cultivar should be switched to 13/11.
“If two light schedules give the same DLI, are they basically the same?”
Question sent by: Ethan Brooks, via email.
No. They deliver the same calculated daily photon total, but not the same instantaneous intensity or day length. That can change flowering signals, leaf temperature, water demand, morphology, and how efficiently the canopy uses the light. Use DLI to compare daily dose, then keep PPFD and photoperiod visible as separate variables.
Why a noon reading is not a DLI outdoors or in a greenhouse
Sunlight changes continuously through the day. A single PPFD reading at noon cannot be multiplied by the length of daylight and called the daily light integral. Clouds, sun angle, shading, greenhouse transmission, neighboring structures, and seasonal conditions alter the curve. For mixed sunlight and supplemental electric light, use an integrated light sensor or time-resolved measurements that capture the actual daily profile.
This is also why a greenhouse cannabis study that reports solar plus supplemental DLI cannot be copied directly into a sealed indoor room. The total may be similar while spectrum, directionality, temperature, and temporal distribution differ.
PPFD does not describe spectrum, coverage, or electrical efficiency
PPFD counts conventional photosynthetic photons, but it does not tell you where in the 400-700 nm range those photons are concentrated. It also does not describe far-red, fixture efficacy, electrical input, heat load, or canopy uniformity. Two fixtures can produce the same average PPFD while creating different spectra and very different center-to-edge distributions.
Use The Ultimate Guide to Grow Light Spectrum when spectrum is the main question, and Actual Wattage vs Equivalent Wattage in Grow Lights when comparing electrical input, fixture output, and marketing claims. This resource stays focused on delivered intensity and daily dose.
Measure and Map Light at the Real Cannabis Canopy
A stage target is only useful if the measurement represents the crop. The most common PPFD error is not bad arithmetic. It is taking one attractive reading directly under the center of the fixture and assuming the entire canopy receives it.
Research protocols routinely use multiple canopy measurements. A 2025 cannabis DLI study measured the four corners and center of each tent and averaged those points. Horticultural measurement guidance also emphasizes sensor position, consistent measurement height, and avoiding shading or reflections that distort the reading. Commercial light maps often show the same pattern growers see in practice: the center can be much brighter than edges and corners.
Build a repeatable PPFD map
For a small rectangular canopy, a 3 × 3 grid is a practical hobby method because it captures corners, edges, and center. It is not a scientific requirement. Larger or irregular canopies need more points, especially around fixture seams, walls, gaps, and visibly weak zones. The goal is a map you can reproduce after changing height, dimming, plant training, or fixture layout.
Measure at the height of the active canopy. If the canopy is uneven, document the measurement plane instead of moving the sensor to whichever top gives the number you want. You may need a second map for a lower productive layer if canopy penetration is part of the decision.
Map the crop
Record several readings across the planted area, use the same canopy height and fixture setting, keep the sensor level, and note the minimum, maximum, and average.
Chasing the center number
Do not set the entire room from the single highest PPFD directly under a diode board or lamp. A strong center can hide weak corners, and raising the center further may worsen the imbalance.
Use a quantum sensor when the decision matters
A purpose-built quantum sensor is the reference tool for PPFD. It is designed to measure photosynthetic photon flux rather than human visual brightness. Lux meters weight light according to human vision, so their readings cannot be converted to PPFD with one universal factor across different spectra.
Phone applications can be useful for rough checks when calibrated for a known device and light source, but treat them as estimates unless validated against a suitable quantum sensor. They are more useful for comparing “before versus after” in the same setup than for claiming a laboratory-grade absolute PPFD.
“My phone says 800 PPFD. Can I use that as my flowering target?”
Question sent by: Julia Schneider, via contact form.
Use it as an estimate unless the app and phone have been validated for your light source. If the lighting decision will push the canopy toward a high-intensity limit, confirm with a suitable quantum sensor. A measurement error matters much more at the edge of the plant’s tolerance than in the middle of a conservative range.
Control the measurement conditions
Measure after the fixture has reached normal operating conditions. Record the dimmer setting, hanging height, fixture arrangement, canopy height, and any reflective walls or curtains that are part of the normal setup. Keep your body and the meter cable from shading the sensor. If you compare two maps, reproduce the same conditions as closely as possible.
Do not forget canopy growth. A fixture mounted at a fixed height above the floor gets closer to the leaves as the plant stretches. PPFD can rise significantly without touching the dimmer. Re-map after major training, a strong flowering stretch, a fixture-height change, or a meaningful canopy reshape.
| Record | Why it matters | What a repeat measurement can reveal |
|---|---|---|
| Fixture model and actual input setting | Identifies the light source and operating state. | Whether a dimming change produced the expected canopy change. |
| Fixture-to-canopy distance | Distance changes intensity and spread, but is not itself the target. | Whether canopy growth is silently increasing PPFD. |
| Grid readings | Shows spatial distribution. | Hot spots, weak corners, fixture seam problems, or layout drift. |
| Average, minimum, and maximum PPFD | Separates overall dose from uniformity. | Whether an “average improvement” sacrificed edges or overdriven tops. |
| Photoperiod | Required for DLI. | Whether a schedule change altered daily dose even if PPFD stayed constant. |
| Canopy condition and stage | Light capture changes as leaf area and structure change. | Whether the plant acclimated or outgrew the previous target. |
| Temperature, humidity, irrigation demand | High light changes the rest of the room load. | Whether light is driving the environment beyond stable control. |
Field Advice: Save the map, not just the average. If the average is 700 PPFD but the canopy ranges from 420 to 1,050, the management problem is uniformity, not simply “700.”
Light distance is a control variable, not a universal target
There is no reliable rule that says a cannabis LED should always be 12, 18, or 24 inches above the canopy. Fixture power, optics, diode spacing, lens design, reflector geometry, room reflectivity, and dimming all change the result. Distance is useful because you can move a light, but PPFD is the quantity you are trying to manage.
When selecting or arranging a fixture, the broader How to Choose Grow Lights for Cannabis guide explains PPF, PPE, fixture coverage, and system selection. Here, the operating rule is simpler: adjust distance or dimming only after you know what the canopy currently receives.
Set Light for Seedlings and Clones Without Forcing Growth
Seedlings and clones are often grouped together because both are small, but their physiology is different. A seedling has its own developing root system. A fresh cutting may have no functional roots at all. Light management should reflect that difference.
Cannabis Seedling Light Guide: Intensity, Distance, and DLI
For established cannabis seedlings, a practical starting band around 150-250 µmol/m²/s under a 16-18 hour photoperiod produces a DLI of roughly 8.6-16.2 mol/m²/day. The middle of that band, around 180-200 PPFD for 18 hours, delivers about 11.7-13.0 mol/m²/day and is a useful starting scale for a healthy young seedling.
This is not presented as a published cultivar-wide optimum. Direct cannabis seedling intensity trials are limited compared with flowering research. The range is a conservative synthesis of cannabis propagation data, early-stage production practice, and the need to prevent excessive stretch without imposing mature-canopy intensity on a small root system.
Seedlings should generally earn more light by developing leaves and roots. If the seedling remains compact, expands new leaves steadily, maintains normal color, and uses water predictably, intensity can rise gradually as the canopy grows. If growth stalls, leaf edges curl, the upper surface pales, or the root zone is staying wet much longer than expected, do not assume the solution is more PPFD.
Seedling stretch does not prove that PPFD is too low
Low light can cause elongation, but so can interactions among temperature, spectrum, genetics, plant density, and distance to a directional light source. A stretched seedling is a reason to measure PPFD and review the environment, not a reason to immediately lower a high-output fixture by several inches.
Compare several seedlings. If all plants lean toward the center or a brighter side, distribution is suspect. If one seedling stretches while neighboring plants under the same measured light remain compact, genetics or individual vigor may be involved. If stems elongate while the room is unusually warm, the temperature-light balance also deserves attention.
Do not use mature-flower PPFD to “harden” a seedling
A young plant cannot be trained for high light by overwhelming it. Hardening is a gradual acclimation process. Increase intensity only as the seedling develops the root capacity, leaf area, and environmental support to use it.
Clone Lighting: How Much Light Do New Cuttings Need?
Fresh cuttings should be managed around rooting, not maximum photosynthesis. Cannabis rooting studies have successfully used approximately 90-100 µmol/m²/s background PPFD in controlled experiments, while other work maintained cuttings around 120-125 µmol/m²/s under 16-18 hour photoperiods. A commercial-scale interlighting study described clones under about 94 ± 10 µmol/m²/s for 15 days.
Those protocols support a practical starting scale around 90-150 µmol/m²/s for unrooted cuttings. The exact DLI depends on photoperiod. At 100 PPFD for 18 hours, DLI is about 6.5 mol/m²/day. At 150 PPFD for 18 hours, it is about 9.7. One commercial protocol used 24-hour lighting at roughly 94 PPFD, which produces about 8.1 mol/m²/day, but that does not make continuous light a universal recommendation.
Once roots emerge and the cutting begins active shoot growth, the plant can be treated more like early vegetative material. Raise light in measured steps rather than moving it directly from propagation intensity to the flowering end of the scale.
Why rooted and unrooted clones should not share one target
An unrooted cutting loses water through leaves while relying on stored resources and the propagation environment. A rooted clone can begin replacing that water through the root system and support more sustained gas exchange. Humidity, leaf area, cutting size, rooting substrate, temperature, and air movement therefore influence how much light a cutting can tolerate before wilting or desiccating.
That is also why a propagation dome changes the equation. High humidity reduces transpiration demand, but it can also reduce air exchange and increase disease risk when sanitation is poor. Light should be coordinated with rooting conditions rather than increased in isolation.
“My clones are not rooting fast. Should I double the PPFD?”
Question sent by: MapleGrower, via Facebook page.
Not without evidence that light is limiting. Check cutting hydration, temperature, rooting medium, sanitation, cultivar response, and whether the leaves are already receiving a propagation-appropriate light level. Cannabis studies have rooted cuttings under modest PPFD. More light can raise transpiration before the cutting has roots capable of supporting it.
Propagation spectrum can matter without changing the PPFD target
A 2024 medicinal cannabis study tested red, blue, and far-red combinations during rooting. Far-red improved rooting in one of two experiments, particularly when used during the initial rooting period, while the presence or absence of blue did not produce a consistent rooting effect. The response depended on the experiment and substrate context. This is a good example of why PPFD is only one part of propagation lighting.
Do not convert that study into a rule that every clone room needs a specific far-red percentage. It shows that light quality can influence rooting behavior under defined conditions. The intensity lesson remains simpler: propagation can be successful at relatively modest PPFD when the rest of the rooting environment is controlled.
Build Vegetative DLI Around Canopy Development
Vegetative cannabis can use substantially more light than fresh propagation material because leaf area, root mass, branch structure, and daily water use are increasing. This is the stage where growers often underuse DLI because they focus only on preventing stretch, or overuse it because they assume faster vegetative growth always reduces total production time.
Vegetative Stage PPFD and DLI Guide
A practical working band for healthy established vegetative plants is about 300-600 µmol/m²/s. Under an 18-hour photoperiod, that is approximately 19.4-38.9 mol/m²/day. Many successful cannabis research protocols sit near the middle of this range. The 2021 light-intensity study vegetated plants around 425 µmol/m²/s for 18 hours before flowering, equivalent to roughly 27.5 mol/m²/day. A 2024 high-light study used about 423 µmol/m²/s for an 18-hour vegetative phase.
Recent evidence also suggests that vegetative DLI can affect later productivity. A 2025 study comparing a conventional vegetative schedule with a lower-DLI night-break approach reported about 29.4 versus 21.2 mol/m²/day during vegetative growth. The lower-DLI plants were less vigorous and later produced less extractable floral biomass, even though flowering light exposure was closely matched. That does not prove 29.4 is an optimum, but it shows that reducing vegetative photon dose can carry consequences into later production.
Use early veg and late veg as different operating states
A newly rooted clone may be better near the lower end of the vegetative range while it expands roots into the final container. A large trained plant approaching the flip can often use more light because the canopy has more leaf area and greater hydraulic capacity. Instead of changing PPFD because the calendar says “week three,” change it because the plant has created the structure to use it.
Watch water use. A rising DLI usually increases transpiration and growth demand when other conditions allow. If you raise light and irrigation frequency rises in a predictable way while the canopy remains healthy, that is consistent with increased activity. If you raise light and the root zone suddenly remains wet, growth stalls, and leaves lose turgor, another limiting factor is likely blocking the response.
Acclimation
Acclimation is the plant’s physiological and structural adjustment to a new light environment. Leaves developed under low light are not identical to leaves developed under high light. When PPFD rises, give the plant time to produce a stable response before making another large change unless a clear stress signal requires immediate correction.
Vegetative DLI is not only a height-control tool
Higher vegetative light can increase branch development, stem mass, leaf area, and carbohydrate production, but morphology also depends on spectrum, temperature, training, genetics, and plant spacing. A compact plant is not automatically optimally lit, and a taller plant is not automatically underlit.
The goal is to build the canopy you intend to flower. If the plant count is low and each plant must fill a large area, a productive vegetative DLI can shorten the time needed to create that canopy. If plant density is high and the target canopy is small, pushing maximum vegetative growth may only create pruning work, humidity, and self-shading.
Do not change nutrition from the dimmer alone
Higher light can increase nutrient demand because growth accelerates, but a PPFD increase is not an instruction to increase fertilizer concentration automatically. The correct response depends on tissue growth, substrate EC, irrigation strategy, root health, and the nutrient program already in use. Overfeeding a plant because the light is stronger can create salt stress that then looks like a light problem.
The Cannabis Nutrients and Fertilizers Guide covers nutrient management in depth. The lighting rule is to measure both systems. If the canopy is receiving more light but root-zone EC is accumulating and water uptake is unstable, fix the root-zone management rather than continuing to increase PPFD.
Tip: Before flowering, save one final vegetative PPFD map and DLI calculation. It becomes the baseline for understanding what changed after the photoperiod shift.
Why the flip changes DLI even before you touch the dimmer
If a vegetative canopy receives 500 µmol/m²/s for 18 hours, its DLI is 32.4 mol/m²/day. Flip that same intensity to 12 hours and DLI drops to 21.6. This is one reason flowering rooms often use higher PPFD than vegetative rooms. The shorter day reduces daily photons unless instantaneous intensity rises.
Do not compensate automatically on the first day. Flower transition can include rapid stretch, changing leaf angles, training, and environmental shifts. Map the canopy, set a reasonable flowering intensity, then increase as the canopy stabilizes and the room proves it can control the additional load.
Raise Flowering PPFD Only as the Whole System Can Use It
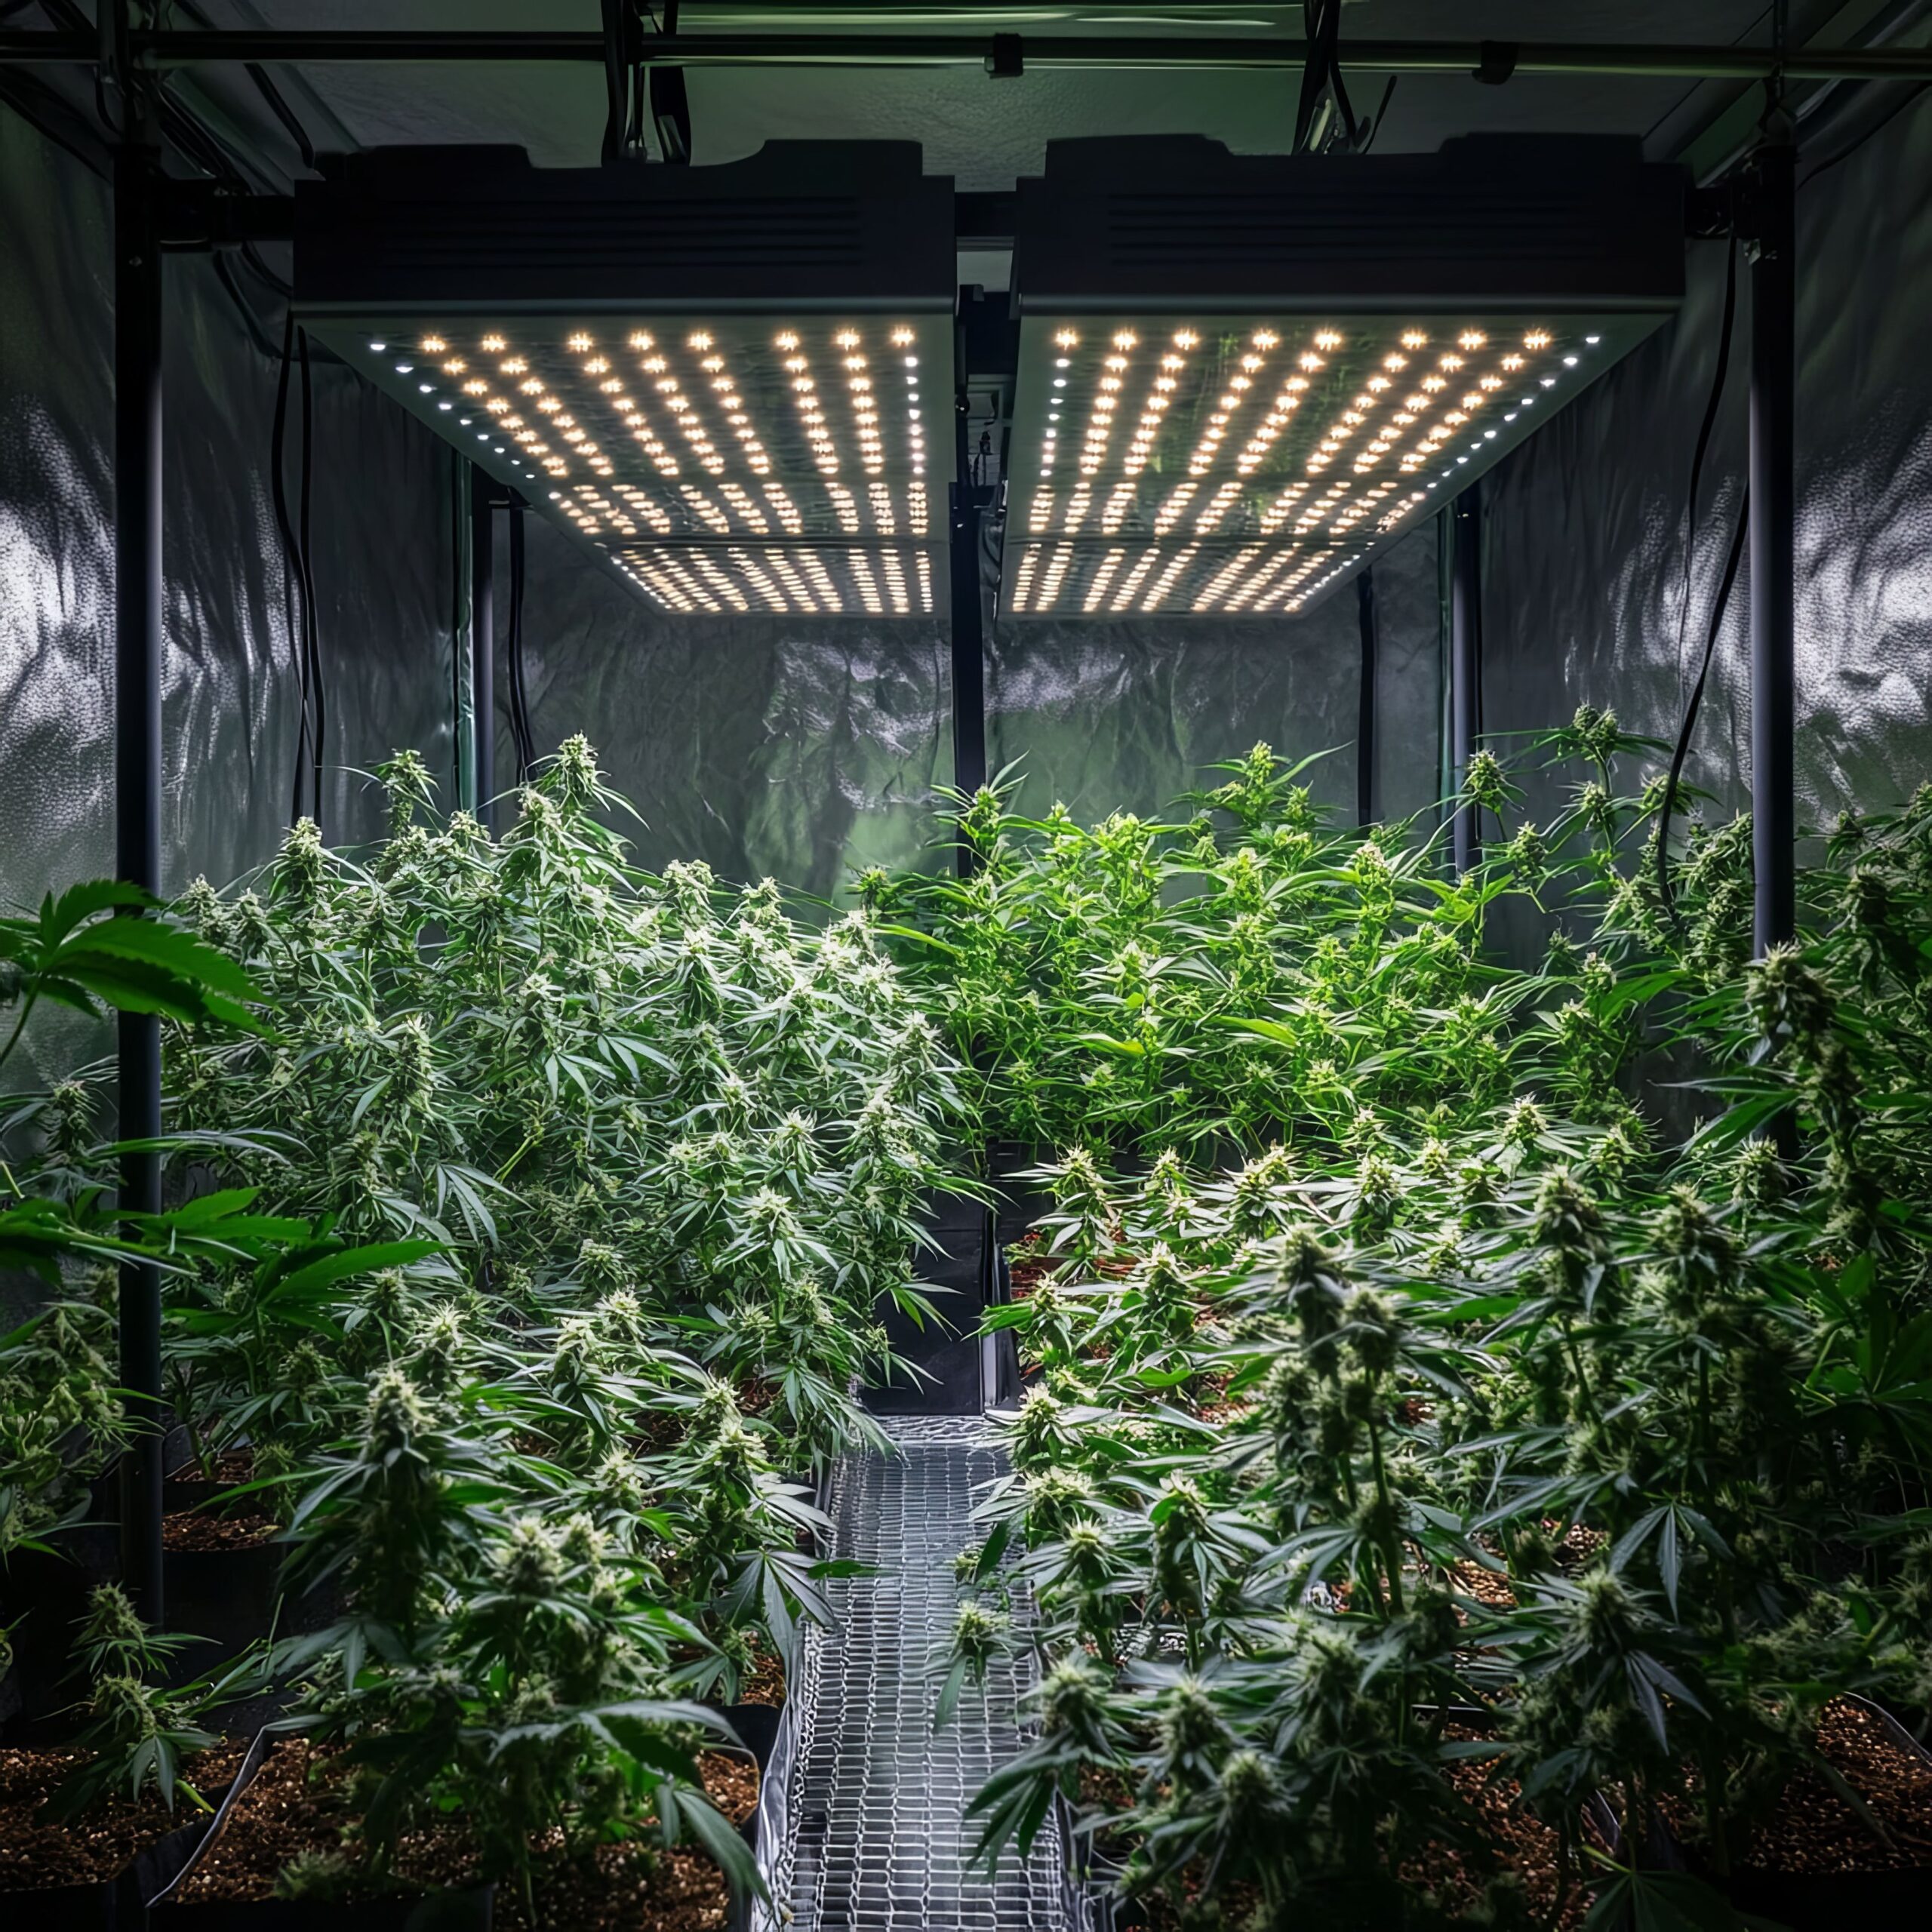
Flowering cannabis has the strongest evidence for high-light response. Multiple controlled studies show increased flower biomass as canopy PPFD rises across ranges that would be extreme for many horticultural crops. The important question is not whether cannabis can use high light. It can. The question is how much light your cultivar and room can convert productively without another factor becoming the limit.
Flowering Stage PPFD and DLI Guide
A practical non-enriched starting band for many healthy indoor flowering canopies is about 600-1,000 µmol/m²/s at canopy level. Under 12 hours, that corresponds to approximately 25.9-43.2 mol/m²/day. This range is well represented in cannabis research: a 2022 study compared 600, 800, and 1,000 PPFD; a 2024 medicinal cannabis study also compared 600, 800, and 1,000 PPFD; both found stronger production at higher tested intensity under their conditions.
The 2021 Guelph study went much further, testing a spatial gradient from about 120 to 1,800 µmol/m²/s during a 12-hour flowering photoperiod. Dry inflorescence yield increased across the tested PPFD range even though leaf-level photosynthesis saturated at a lower intensity. That result is one reason cannabis is considered unusually responsive to high light at the whole-plant level.
However, “yield increased to 1,800” is not the same statement as “1,800 is the correct target.” Economic efficiency, electrical load, HVAC, canopy temperature, CO₂ supply, irrigation capacity, plant density, and cultivar all affect whether the extra photons are worth delivering.
There is no scientifically established universal 1,000 PPFD ceiling
Many grow charts treat 1,000 µmol/m²/s as a hard ambient-CO₂ limit. Cannabis research does not support such a simple universal boundary. Studies have shown productive responses above 1,000 under defined conditions. The practical message is not to ignore CO₂. It is to avoid turning one round number into a law. High PPFD must be evaluated with carbon dioxide, temperature, water, nutrition, cultivar, and economic return together.
CO₂ changes capacity, but it is not permission to overlight a weak room
Carbon dioxide is a substrate for photosynthesis, so its concentration interacts with light and temperature. Supplemental CO₂ can support greater photosynthetic capacity when the room is already able to maintain suitable light, leaf temperature, irrigation, nutrition, and humidity. But enrichment does not repair uneven PPFD, heat stress, root disease, nutrient accumulation, or a poorly ventilated canopy.
CO₂ also creates occupant-safety requirements. The Ventilation Systems for Cannabis guide covers measured enrichment and safety boundaries. For PPFD planning, the key point is that CO₂ belongs in the system model. Do not use an internet chart that says “X PPFD requires Y ppm” as if cultivar, temperature, and leaf physiology disappear.
Higher flowering light increases environmental load
More productive photon input usually means more canopy activity and more heat entering the room from the lighting system. Water use can increase. Dehumidification demand can rise as a larger crop transpires more and flowers become denser. The room may need more cooling, air mixing, irrigation capacity, and moisture removal even when the plant itself appears capable of using the light.
This is where a “perfect” PPFD target can become counterproductive. If 1,000 PPFD produces a humidity problem that leaves dense flowers wet for longer periods, the nominal lighting gain may create a postharvest or disease cost. The highest useful intensity is therefore a property of the cultivation system, not the fixture.
Flowering light and metabolite response are cultivar-dependent
One 2024 study on ‘Critical CBD’ reported that increasing PPFD from 600 to 1,000 increased both inflorescence mass and yields of measured specialized metabolites. Other cannabis studies have found smaller or more complex changes in cannabinoid and terpene concentration. The 2021 PPFD-gradient study did not find cannabinoid potency increasing with intensity in the same way yield increased.
That is not a contradiction that needs to be hidden. It is evidence that genotype, environment, stage, sampling, and which chemical endpoint is measured all matter. Weedth therefore does not promise a specific THC or terpene increase from a PPFD target.
Do not assume 12/12 is the only biologically possible flowering schedule
Twelve hours light and twelve hours dark remains a practical and widely used flowering schedule for photoperiod-sensitive cannabis. It provides a strong flowering signal and makes DLI calculations simple. But research shows some cultivars can flower under longer days. In a 2024 study, two high-THC cultivars flowered under 13-hour photoperiods at 540 PPFD and produced greater yield, although one cultivar initiated flowering slightly later.
This is a useful research result, not a reason to rewrite every timer. Photoperiod sensitivity is cultivar-dependent, and extending the day changes both flowering signal and DLI. Unless a grower has cultivar-specific evidence and a reason to experiment, 12 hours remains the clean reference point for comparing flowering PPFD targets.
Uniformity can matter as much as the average
Average PPFD is useful because it gives one number for the canopy, but plants do not grow in an average location. They grow in individual positions. A room with an average of 800 µmol/m²/s can be relatively uniform, such as 700 at the edges and 900 near the center, or extremely uneven, such as 350 in corners and 1,250 directly under the fixture. Those two rooms should not be managed the same way.
A simple way to track this is to keep the minimum, average, and maximum from the same measurement grid. Some growers also calculate a minimum-to-average ratio as an internal uniformity metric. That ratio is useful for comparing your own layouts, but Weedth does not present one universal pass/fail percentage because fixture geometry, crop architecture, economic goals, and the productive canopy boundary differ.
Improving uniformity can raise total productive light without increasing the brightest point. Raising a fixture slightly may lower the center but improve edge distribution. Adding another well-spaced fixture may fill a dark seam. Training the canopy to a more consistent height can reduce the distance differences that create hot tops and weak side branches. These changes can make the same electrical input more useful before the grower considers a higher wattage setting.
Canopy penetration is not the same as top-canopy PPFD
A top-canopy reading describes what reaches the measurement plane. It does not tell you how many photons reach leaves or flowers deeper in the canopy. Light falls as upper leaves intercept it, and the vertical profile depends on leaf area, leaf angle, training, plant density, spectrum, and fixture directionality. A dense canopy can therefore have an excellent top PPFD while lower productive sites remain heavily shaded.
This does not mean you should push the top until the bottom reaches the same target. That can overdrive upper tissue. Instead, manage canopy depth. Pruning, spacing, branch training, fixture distribution, and cultivar architecture can improve useful interception. Interlighting is another advanced approach, but it changes fixture placement, labor access, and heat distribution and should not be treated as a universal home-grow requirement.
The practical measurement lesson is to decide what layer you are managing. For a typical top-lit indoor canopy, use the upper active canopy as the primary PPFD plane. If lower flower development is a known problem, add a second repeatable measurement layer to understand penetration rather than replacing the top map.
Spectrum changes what a PPFD number means biologically
Conventional PPFD counts photons from 400 to 700 nm equally in the measurement total. Plants do not necessarily use every wavelength identically for photosynthesis or morphology. Blue, green, and red fractions can alter leaf thickness, stomatal behavior, stem elongation, canopy penetration, and architecture. Far-red sits outside conventional 400-700 nm PPFD but can still influence photomorphogenesis and, in some contexts, photosynthetic interactions.
This is why two fixtures both delivering 600 PPFD can produce somewhat different plant form. The PPFD numbers may match while spectrum and distribution differ. Cannabis spectrum studies demonstrate morphological and chemical responses to light quality, while the 2024 cutting study shows that spectrum can influence rooting behavior even when the background photosynthetic intensity remains modest.
Do not respond by abandoning PPFD. It remains one of the most useful measurements for delivered photosynthetic light. Instead, keep the hierarchy clear: PPFD measures delivered photon density, DLI adds time, spectrum describes wavelength composition, and the plant response integrates all of them with the environment.
Why fixture dimming and fixture height are not identical adjustments
Dimming usually changes total photon output while keeping fixture position constant. Raising or lowering the fixture changes intensity and also changes the spatial spread. Depending on optics, raising a fixture can reduce the center hotspot and improve uniformity even as average PPFD falls. Lowering it can raise peak intensity faster than it improves edge light.
That distinction matters during stage transitions. If the entire canopy is uniformly below the intended range, dimmer output may be the cleaner adjustment. If the center is already high while corners are weak, more output can make the problem worse. In that case, height, layout, or canopy shape may deserve attention first.
Remember: “Turn the light up” and “bring the light closer” are not interchangeable instructions. One mainly changes output; the other can change both output at the canopy and distribution across it.
Cultivar and phenotype can move the useful operating window
Cannabis is not one uniform plant. Studies repeatedly report cultivar-dependent responses in flowering timing, morphology, metabolite production, humidity sensitivity, and other traits. Light response is also influenced by genotype and by how the plant was acclimated before the measurement period. A cultivar selected under bright controlled environments may behave differently from a shade-acclimated mother or a plant recently moved from propagation.
Within one room, this can produce a management problem. One cultivar may remain compact and healthy near the high end of the map while another pales or curls in the same zone. Before lowering the whole room, compare repeated observations and check whether the sensitive cultivar can be positioned in a lower-intensity part of the map. Conversely, do not force the entire room upward because one vigorous phenotype can tolerate more.
This is one reason a grow journal should include cultivar, phenotype, measured PPFD, photoperiod, and response. After several cycles, your own repeatable data can become more useful than a generic chart, provided the measurement method stays consistent.
Temperature changes how much of the light environment the plant can use
Light drives photosynthesis, but photosynthetic enzymes, stomata, respiration, and water movement are temperature-sensitive. A canopy that performs well at one leaf temperature may show stress at the same PPFD when the room becomes hotter or colder. Air temperature is only part of this because leaf temperature can differ from room air depending on fixture type, radiation, humidity, and airflow.
Strong LEDs can create high PPFD with less radiant heat than some HID systems, which means old distance rules built around heat may not predict photon intensity. The reverse is also true: a room can be thermally stressful even when PPFD is not unusually high. Measure light and temperature separately instead of using one as a proxy for the other.
When a heatwave, cooling failure, or dehumidifier problem changes the environment, temporarily reducing light can reduce crop demand while the system recovers. The stage chart does not outrank plant safety.
Water supply and root-zone oxygen set a practical light ceiling
Higher PPFD can increase transpiration and carbon gain, which often increases irrigation demand. But roots must supply that water while maintaining oxygen and acceptable salinity. In soil or peat-based media, simply watering more often can create saturation if the container is large or drainage is poor. In coco and hydroponic systems, higher frequency can work well when aeration, EC, drainage, and solution management are designed for it.
This interaction explains why an apparently “light-sensitive” plant can actually have a root problem. When roots are damaged or oxygen-limited, the shoot may lose the capacity to support transpiration under the previous PPFD. The leaves then droop or scorch at a light level that healthy roots could have supported.
Before lowering the long-term target, determine whether the light is truly excessive or whether the root system has temporarily reduced the plant’s capacity. During recovery, reducing intensity can still be appropriate. The difference matters because one solution changes the production target while the other treats a limiting condition.
High DLI has an electrical and HVAC cost even when the plant responds
Biological response is only one optimization objective. Electric lighting consumes power, produces heat somewhere in the system, and can increase cooling and dehumidification requirements indirectly by increasing crop activity. A research treatment that produces more flower at higher PPFD may still have a lower economic return in a room with expensive electricity or limited HVAC capacity.
Think in marginal terms. If moving from 700 to 850 PPFD produces a useful yield increase with little additional climate cost, that can be attractive. If moving from 1,100 to 1,300 requires another air conditioner, more dehumidification, CO₂ enrichment, and an irrigation upgrade, the economic threshold may arrive before the biological one.
This is also why fixture PPE matters. A more photon-efficient fixture can deliver a target PPFD with less electrical input than an inefficient one, but only if its distribution suits the canopy. PPFD, DLI, PPE, and HVAC should eventually meet in the same operating-cost calculation.

Adjust PPFD and DLI With a Repeatable Verification Loop
The best lighting adjustment procedure is deliberately boring: measure, change one variable, let the canopy respond, then measure again. Problems appear when growers change the dimmer, fixture height, irrigation frequency, nutrient strength, fan speed, and temperature setpoint at the same time. If the plant improves or worsens, nobody knows why.
Step 1: Define the reason for the change
Do not increase PPFD merely because a chart says the plant has entered a new week. State the actual reason. Examples include a newly filled canopy, a large drop in DLI after the flowering flip, measurable stretch with low canopy PPFD, a uniform healthy crop using water quickly, or a deliberate production trial.
If the reason is “the buds should be bigger by now,” light may not be the limiting factor. Check root-zone health, irrigation, temperature, humidity, cultivar timing, plant density, nutrition, and disease pressure before assuming the fixture needs to be stronger.
Step 2: Measure the current map and DLI
Record the current average, minimum, maximum, photoperiod, and fixture settings. If the canopy is highly uneven, solve distribution first. A room with 1,100 PPFD in the center and 450 in the corners does not necessarily need a higher average. It may need a different fixture height, layout, canopy shape, or supplemental edge coverage.
Step 3: Make one controlled adjustment
Change dimming, hanging height, fixture arrangement, or photoperiod only if that variable matches the problem. Avoid large jumps unless you are correcting an obvious measurement error or unsafe condition. A measured step gives you a new state that can be compared with the baseline.
After the change, remap at least the points most likely to shift. If fixture height changed, the entire distribution may change. If only dimming changed on a linear fixture, the pattern may remain similar but intensity will rise.
Step 4: Watch new growth and system demand
Old damaged leaves do not become a reliable light meter. Judge the response from new leaves, canopy posture, growth rate, flower development, water use, root-zone behavior, and whether climate control remains stable. A light increase that produces rapid growth but overwhelms irrigation or dehumidification is not yet a successful optimization.
| Observation after a light change | Possible interpretation | What to verify before another adjustment |
|---|---|---|
| Healthy new growth, faster water use, stable climate | The canopy may be using the added photon dose productively. | Repeat PPFD map, root-zone moisture trend, temperature and RH. |
| Bleached or unusually pale upper tissue near the brightest points | Excess light, heat, nutrient interaction, or a combined stress is possible. | Compare PPFD spatial pattern, leaf/canopy temperature, root-zone EC and healthy lower zones. |
| Leaves curl upward mainly in the hottest/brightest zone | High radiant load, VPD, or excessive intensity may be involved. | Measure canopy temperature and PPFD at the exact affected location. |
| Stretch continues in corners but center looks healthy | Uniformity may be the problem rather than average intensity. | Map edges and corners, fixture height, plant spacing, and shade. |
| Water demand jumps but roots remain healthy | Higher photosynthetic and transpiration demand may be normal. | Confirm irrigation capacity without automatically increasing nutrient concentration. |
| Growth stalls while root zone stays wet | Light may not be the limiting factor; roots or climate may be suppressing uptake. | Drainage, oxygen, temperature, disease, EC, and irrigation frequency. |
| Only one cultivar shows stress at the same mapped PPFD | Genotype or phenotype response may differ. | Compare repeated response before lowering the entire room for all plants. |
Common misconception: light stress and heat stress are the same thing
They can occur together, but they are not identical. A leaf may receive high photon flux while remaining at an acceptable temperature under efficient LEDs and good air movement. Another leaf may experience excessive temperature under a lower PPFD because of radiant heat, poor airflow, or a hot room. Measure both the light environment and the thermal environment.
This is one reason old distance rules fail. Moving a hot HID fixture upward can reduce both radiant heat and PPFD. Dimming an efficient LED may mainly reduce photon flux and electrical heat. The plant symptom can look similar while the corrective mechanism differs.
Common misconception: taco leaves prove the light is too strong
Upward leaf-edge curling can occur under high light, heat, high vapor pressure deficit, root-zone stress, or combinations of those conditions. It is a clue, not a diagnosis. If only the highest-PPFD zones show the symptom and the rest of the room is stable, light becomes a stronger suspect. If the entire room shows it during a hot, dry event, the climate may be the dominant factor.
Common misconception: more PPFD means you must feed more immediately
Increased light can support faster growth and eventually greater nutrient demand, but the nutrient concentration should be guided by the root-zone system and crop response. A sudden fertilizer increase can create osmotic stress just as the plant is adapting to more light. Measure input and root-zone chemistry where the cultivation method allows it.
Change one main variable
Make a measured lighting adjustment, remap the canopy, then evaluate new growth and system demand before making another major change.
Stacking corrections
Do not raise PPFD, increase feed strength, alter irrigation, and change temperature together unless safety requires it. Multiple simultaneous changes destroy diagnostic clarity.
When reducing light is the correct move
Reducing PPFD is not a failure. It is appropriate when a plant is newly transplanted, recovering from root damage, entering severe heat stress, unable to maintain water status, showing a repeatable high-light injury pattern, or when the room cannot control temperature and humidity at the current load.
It can also be an economic choice. A PPFD that still increases yield biologically may not increase profit after electricity, cooling, dehumidification, and equipment cost. Research papers can show biological response; they do not set your electricity price or production objective.
Master Advice: The useful ceiling is where another limiting factor, plant response, safety constraint, or economic cost makes the next photon less valuable than the one before it. That ceiling can move as the crop and room change.
Use a Stage-by-Stage Lighting Checklist
A good lighting plan should be repeatable enough that you can explain why the dimmer is where it is. The checklist below converts PPFD and DLI from abstract numbers into a practical operating procedure.
Before seedlings or clones enter the space
- Confirm the fixture can dim low enough or hang high enough to provide propagation-level PPFD without a severe center hot spot.
- Measure the propagation area at the actual tray or canopy height.
- Set the intended photoperiod and calculate DLI from the measured PPFD.
- Check temperature and humidity under the real lighting schedule before plants arrive.
- For cuttings, plan the transition from unrooted propagation to rooted early vegetative growth rather than using one intensity for the entire clone cycle.
Before increasing seedling intensity
- Look for active new leaf expansion rather than relying only on plant age.
- Confirm the root zone is drying and rewetting normally for the container size.
- Measure the current canopy PPFD before moving the fixture.
- Increase light gradually and watch the newest growth.
- If stretching is localized, map distribution before raising the entire room.
Before pushing vegetative DLI
- Confirm the canopy has enough leaf area to use the added light.
- Check whether the current DLI already sits in a productive mid-range rather than assuming more is necessary.
- Record plant spacing, training stage, and whether the goal is faster canopy fill or simply maintaining mothers.
- Verify irrigation and root-zone health before increasing demand.
- Save the final pre-flip map so the flowering transition has a baseline.
Before setting flowering PPFD
- Recalculate DLI after changing the photoperiod.
- Map the canopy after the initial stretch changes plant-to-fixture distance.
- Start in a range the room can cool and dehumidify reliably.
- Increase only while new growth, water use, and flower development remain stable.
- Do not use CO₂ charts as permission to ignore heat, humidity, irrigation, or occupant safety.
- Compare the minimum and maximum PPFD, not only the average.
Before you call the PPFD and DLI plan finished
- PPFD was measured at the actual canopy, not copied from the fixture carton.
- The canopy was mapped across center, edges, and corners.
- Photoperiod was included in the DLI calculation.
- Seedlings and unrooted clones were not treated like mature flowering plants.
- Vegetative DLI was matched to canopy-building goals.
- Flowering PPFD was increased only while climate and root-zone control remained stable.
- Light stress was separated from heat, VPD, nutrient, and root-zone look-alikes.
- High-intensity lighting was not assumed to increase cannabinoid potency in direct proportion.
- Every major lighting change was followed by a repeat measurement and plant-response check.
What the evidence supports most strongly
The strongest cannabis-specific evidence in this topic supports three conclusions. First, established cannabis can use high PPFD and flower yield often rises as light intensity increases across the tested range. Second, DLI during vegetative growth can affect vigor and later production, so the vegetative stage should not be treated as a low-light waiting room. Third, propagation succeeds under much lower PPFD than mature flowering, which is why one life-cycle target cannot work.
The evidence is weaker when a chart claims an exact cultivar-independent target for seedlings, clones, every week of veg, or every week of flower. Those numbers are usually production conventions layered over a smaller scientific evidence base. Weedth treats them as starting ranges that must be verified in the actual room.
PPFD and DLI become useful when they replace guesswork, not when they become new forms of guesswork. Measure the photons where the leaves actually are, account for the full light period, respect the difference between propagation and mature flowering, and let the plant plus the environment decide whether the next increase is productive. The best lighting target is not the highest number your fixture can produce. It is the measured dose your canopy can repeatedly convert into healthy growth and flower without another part of the system failing first.
Share this article
A quick overview of the topics covered in this article.
- Use Stage Targets as Starting Bands, Not Fixed Setpoints
- Understand PPFD, DLI, Photoperiod, and Their Limits
- Measure and Map Light at the Real Cannabis Canopy
- Set Light for Seedlings and Clones Without Forcing Growth
- Build Vegetative DLI Around Canopy Development
- Raise Flowering PPFD Only as the Whole System Can Use It
- Adjust PPFD and DLI With a Repeatable Verification Loop
- Use a Stage-by-Stage Lighting Checklist
Follow us
Latest articles
October 2, 2026
October 2, 2026