
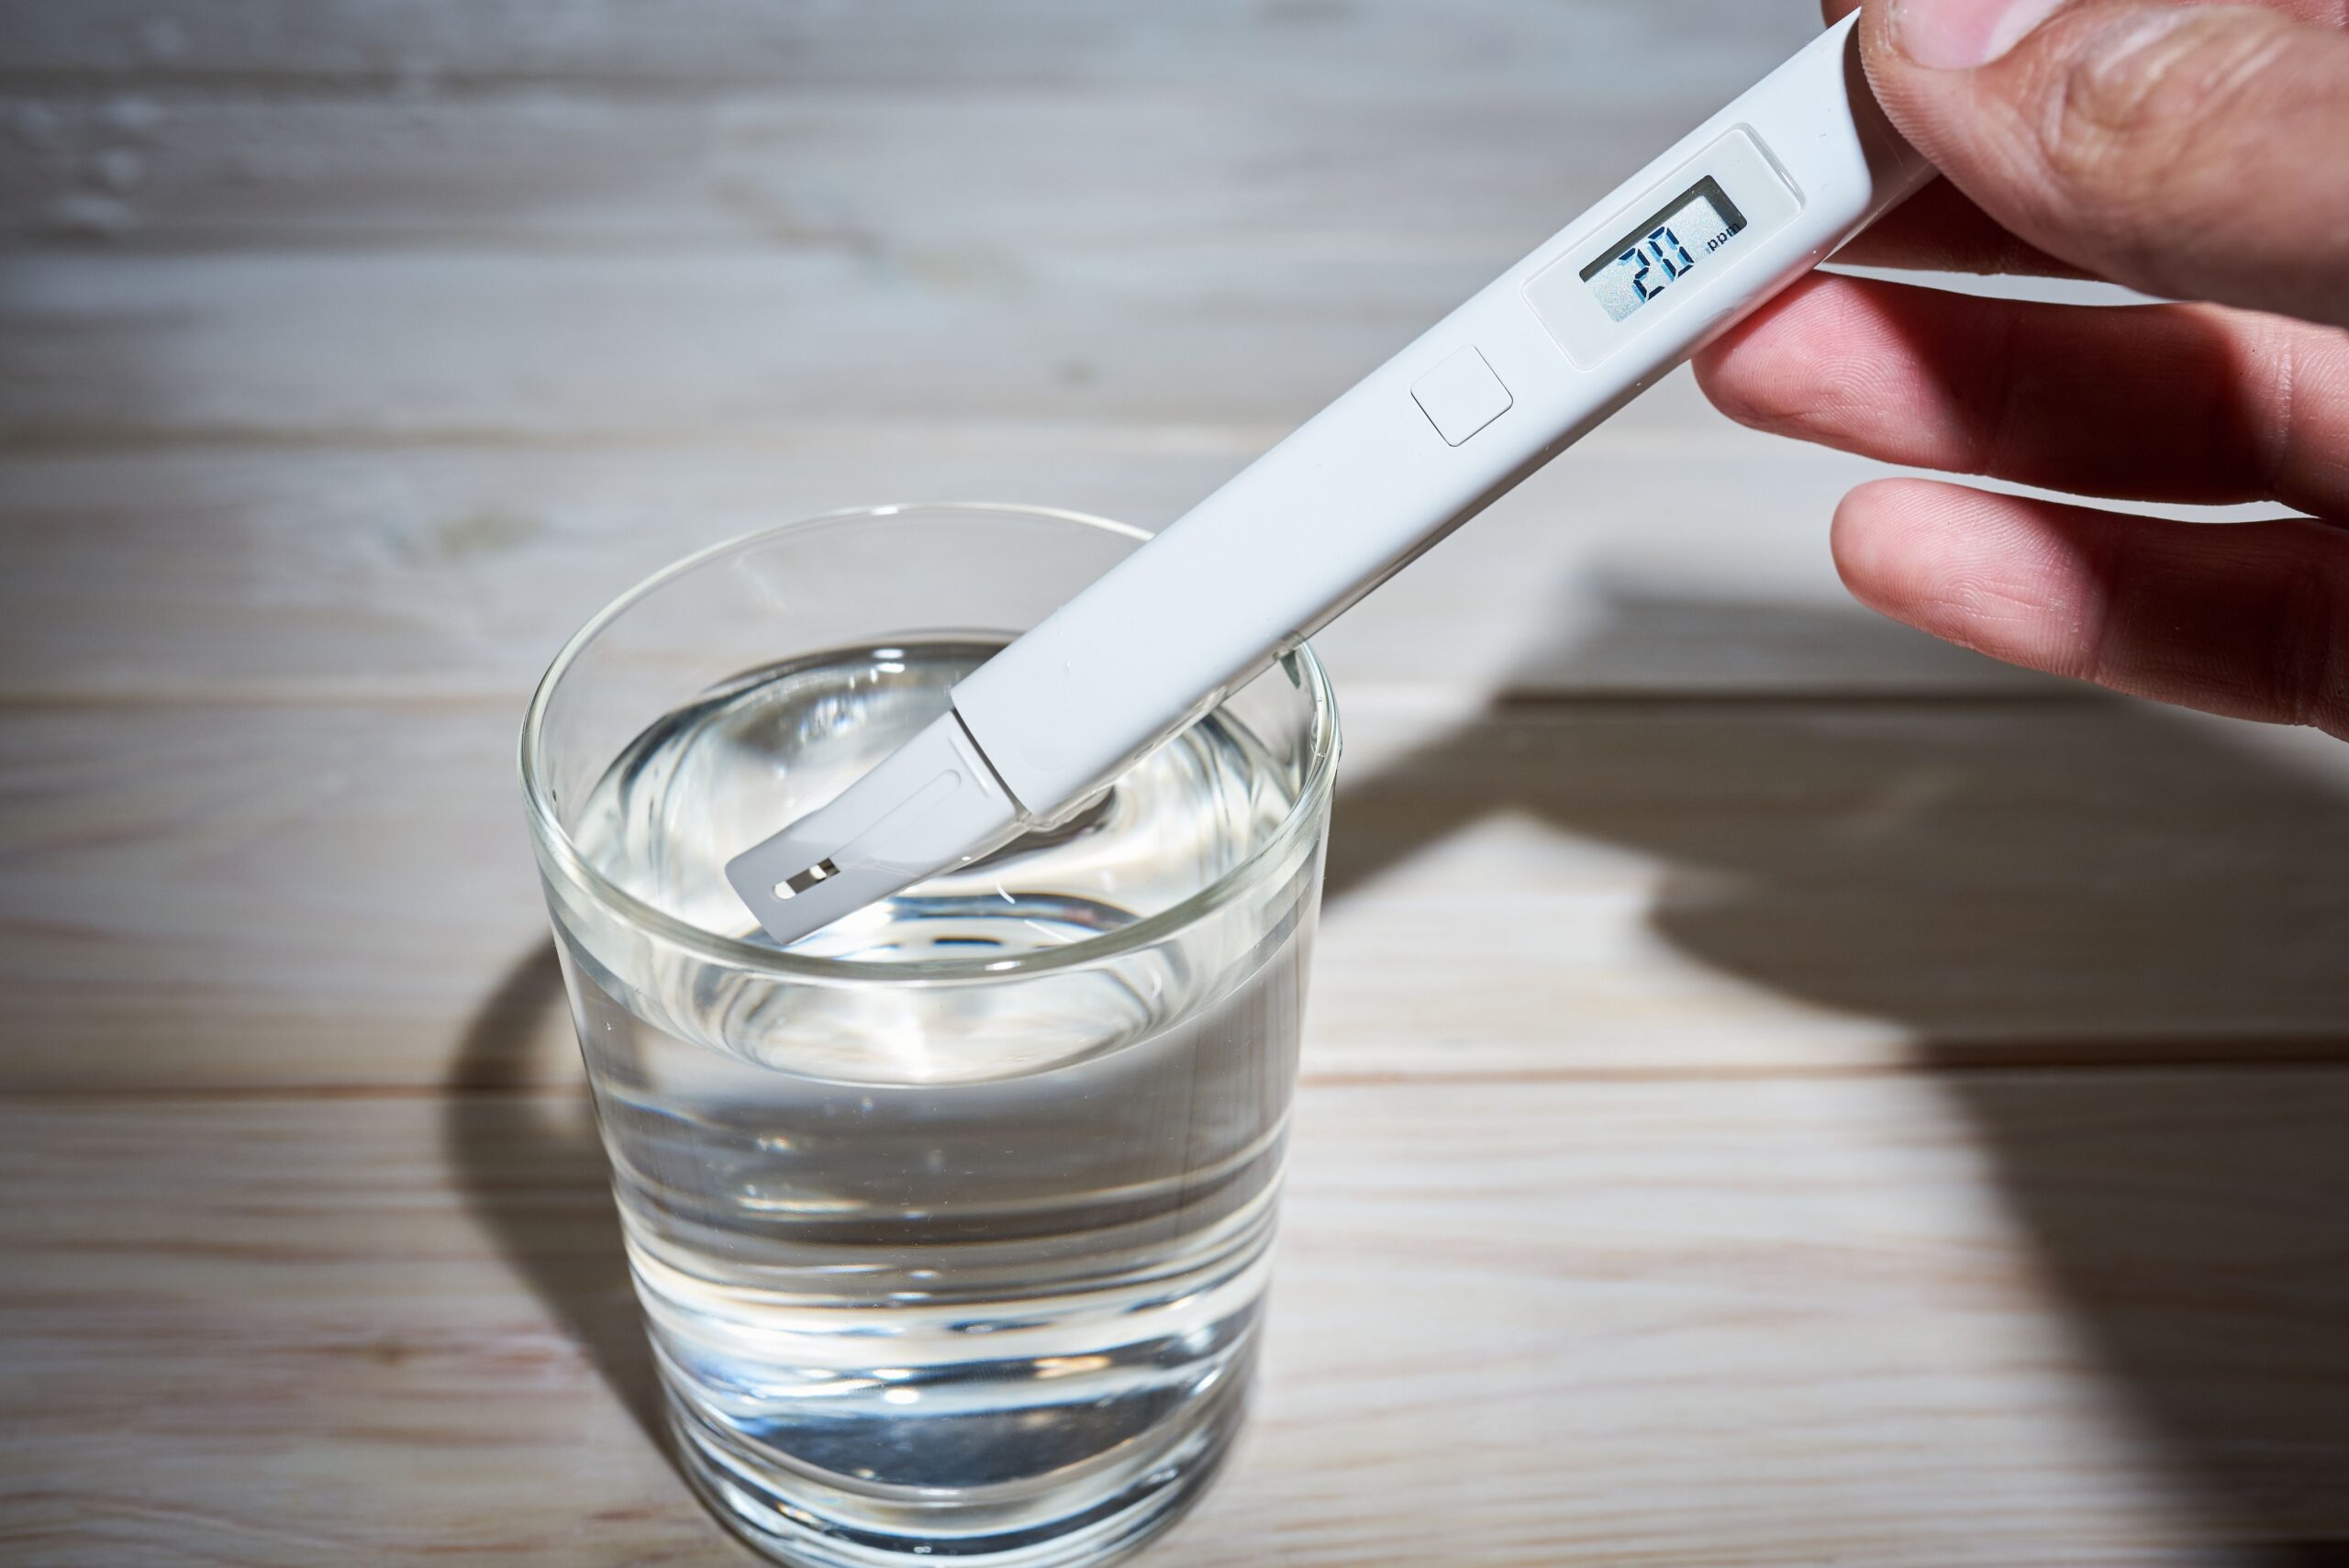
Cannabis Dry-Back and VWC Guide: Moisture Targets, Container Capacity, and Sensors
In modern commercial cannabis cultivation, irrigation management has evolved far beyond the primitive visual inspection of topsoil or lifting pots by hand. Commercial horticulture now treats the root zone as a dynamic, measurable bio-reactor governed by Volumetric Water Content (VWC) and precision dry-back dynamics. In controlled-environment agriculture, the term dry-back describes the controlled percentage drop in substrate moisture between irrigation events, driven by plant transpiration and gravitational drainage. Far from being a passive drying event, dry-back is one of the most powerful hormonal steering mechanisms available to the commercial cultivator. By manipulating daily and overnight dry-back percentages, growers can actively steer cannabis morphology: triggering rapid vegetative structural growth during the canopy expansion phase, or inducing mild osmotic and water-potential stress that signals generative reproductive development, tightens internodal spacing, and stimulates secondary cannabinoid and terpene synthesis. However, executing precision crop steering requires understanding the physics of container capacity, substrate dielectric permittivity, sensor calibration, and pore-water electrical conductivity. This comprehensive guide outlines the scientific principles, sensor technologies, and operational protocols required to master cannabis watering frequency and volume through real-time VWC monitoring, and integrates directly with our interactive cannabis dryback calculator.
Volumetric Water Content, Matric Potential, and Substrate Dry-Back Dynamics
To implement precision irrigation, cultivators must understand the scientific terminology and biophysical units used in digital substrate monitoring:
- Volumetric Water Content (VWC %): The ratio of the volume of liquid water to the total volume of the substrate container, expressed as a percentage: VWC = (Volume of Water / Total Substrate Volume) × 100. If a 10-liter container contains 6.0 liters of water dispersed throughout its pore spaces, the substrate VWC is exactly 60%. Unlike gravimetric water content (which measures water mass relative to dry soil mass), VWC provides an absolute volumetric metric directly comparable across different container geometries and substrate materials.
- Matric Potential (Ψm) and Soil Water Tension: Water within a porous substrate is subjected to capillary and adsorptive forces that bind it to solid substrate fibers. This physical suction is matric potential, expressed in negative pressure units such as kilopascals (kPa) or centibars (cbar). At container capacity, matric tension is near zero (-1 to -3 kPa), allowing root cortical cells to absorb water with minimal energy expenditure. As the substrate dries down during a scheduled dry-back, matric potential becomes increasingly negative (-10 to -35 kPa in coco; -5 to -15 kPa in rockwool), requiring root hairs to exert greater cellular osmotic suction to extract moisture.
- Container Capacity (Field Capacity in Pots): The maximum volumetric water content a substrate can hold against the downward pull of gravity once saturated and allowed to drain freely. In soilless rockwool slabs, container capacity typically peaks between 70% and 85% VWC; in standard 70/30 coco-perlite mixes, it stabilizes between 55% and 68% VWC; and in peat-based living soils, it reaches 45% to 55% VWC. Container capacity represents the 100% hydration baseline from which all dry-backs are calculated.
- Inter-Shot vs. Overnight Dry-Back: Commercial crop steering divides dry-back into two distinct operational metrics: inter-shot dry-back (the 2% to 6% VWC drop that occurs between consecutive daytime irrigation pulses) and overnight dry-back (the 8% to 25% VWC drop that occurs between the final irrigation shot of the day and the first shot of the subsequent photoperiod). Managing overnight dry-back is the primary lever used to control plant vegetative-to-generative balance.
Because plant roots absorb water against the matric suction of the medium, understanding VWC thresholds allows cultivators to keep the rhizosphere within the optimal “plant-available water” window, preventing both hypoxic root drowning and acute stomatal drought closure. Substrate hydraulic conductivity drops exponentially as pore spaces drain, meaning that dry substrates resist water movement until a critical capillary wetting front is re-established.
The Sensor Physics: High-Frequency Dielectric Permittivity
Modern digital substrate sensors (such as TDR and multi-frequency capacitance probes) do not measure moisture by testing electrical resistance: budget resistance probes are easily fooled by dissolved fertilizer salts. Instead, professional sensors measure the dielectric permittivity (ε) of the substrate. The dielectric permittivity of air is 1.0; dry mineral soil particles range from 3.0 to 5.0; while pure water has an exceptionally high permittivity of approximately 80.0 at 20 °C. Because water possesses a dielectric constant nearly twenty times higher than any other substrate component, high-frequency electromagnetic sensors detect changes in water volume with ±1% accuracy, completely unaffected by fluctuations in root-zone fertilizer electrical conductivity.
The Physics of Container Capacity: Saturation Peaks, Drainage, and Dry-Back Curves
When an automated drip system delivers water to a container, the moisture profile follows a predictable three-phase physical curve across the photoperiod:
- Phase 1: Saturation and Gravitational Drainage: During initial morning ramping shots, water rapidly fills substrate macropores and micropores. The sensor graph displays an aggressive vertical ascent, peaking briefly at maximum saturation (often 75% to 80% VWC in coco). Once water injection ceases, gravitational head pressure forces surplus free water out through the bottom drainage perforations. Over the next 15 to 30 minutes, VWC declines smoothly to the stable container capacity plateau. Any water that drains during this window constitutes primary leaching runoff.
- Phase 2: Daytime Transpirational Drawdown: Throughout the peak lighting photoperiod, water is extracted directly by root hairs to sustain canopy transpiration. The rate of VWC decline on the digital telemetry graph correlates directly with ambient vapor pressure deficit (VPD) and photosynthetic photon flux density (PPFD). Under high PPFD (900+ μmol/m2/s), mature flowering canopies draw down substrate moisture at rates of 2.0% to 4.0% VWC per hour.
- Phase 3: The Nocturnal Respiration Dry-Back: After lights switch off, stomata close and transpirational pull drops by over 90%. However, VWC continues to decline slowly (typically 0.3% to 0.8% VWC per hour) due to residual root hydraulic absorption, nocturnal cellular respiration, and passive lateral container surface evaporation. Enforcing an adequate overnight dry-back restores substrate air-filled porosity, allowing atmospheric oxygen to diffuse deep into the root core before the next morning light cycle.
Wolff and colleagues confirmed that oxygen diffusion through drained macropores is 10,000 times faster than through water-filled pores, proving that dry-backs are essential for maintaining cellular respiration.
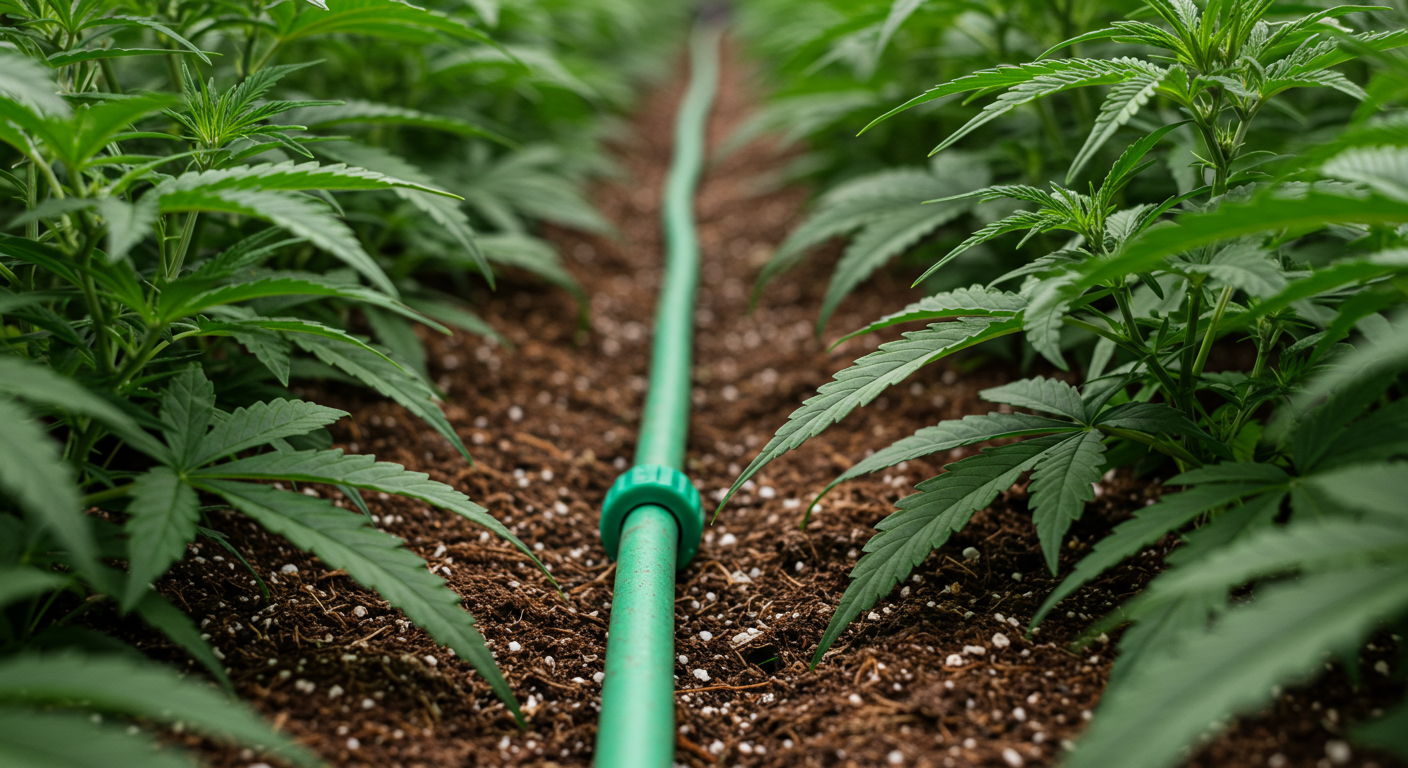
Automated drip irrigation manifold pulsing precision shot volumes to achieve targeted substrate dry-back curves.
Sensor Technology and Measurement Methods: TDR, Capacitance, Scales, and Calibration
To accurately capture real-time VWC and execute precision crop steering, cultivators utilize three distinct categories of instrumentation:
1. Time-Domain Reflectometry (TDR) Sensors
TDR probes (such as Campbell Scientific or True TDR units) emit high-frequency electromagnetic pulses down stainless steel waveguide rods. The sensor measures the precise travel time of the reflected wave along the probe rods, calculating the apparent dielectric constant of the bulk substrate. TDR sensors provide the highest scientific accuracy across wide salinity ranges, making them the gold standard for horticultural research facilities.
2. High-Frequency Capacitance / FDR Probes (Aroya, TrolMaster, Meter Group)
Frequency-Domain Reflectometry (FDR) and capacitance probes (such as the Meter Group TEROS 12, Aroya Solus, or TrolMaster WCS-1) charge an electromagnetic field around the sensor needles at 70 MHz. The sensor measures the charge time of the capacitor formed by the substrate, translating charge velocity into bulk dielectric permittivity, pore-water electrical conductivity, and temperature simultaneously. These compact sensors are ideal for commercial production, streaming telemetry directly to facility environmental management platforms.
3. Continuous Gravimetric Load Cells (Platform Scales)
The absolute physical benchmark for moisture measurement is gravimetric mass: water weighs exactly 1.0 gram per milliliter (1.0 kg per liter). Commercial research facilities place index containers permanently on digital platform load cells. By tracking continuous weight loss in grams, operators calculate exact whole-plant transpirational water loss in real time, validating digital VWC sensors against un-foolable physical mass.
Sensor Placement Rules and Installation Protocols
Even the most sophisticated dielectric sensor produces misleading telemetry if installed incorrectly. Follow these strict horticultural insertion protocols:
- Vertical Height: Insert the probe needles horizontally into the middle-to-lower third of the substrate container. In a standard 2-gallon or 3-gallon pot, insert needles 1.5 to 2.5 inches above the base. Placing probes too high measures rapid surface evaporation rather than root uptake; placing them flush on the container floor catches stagnant perched water tables.
- Orientation: Always insert probe needles parallel to the container base (horizontal plane). Vertical insertion creates artificial vertical drainage channels along the stainless steel needles, distorting VWC readings.
- Eliminating Air Gaps: Ensure dense substrate-to-needle contact. Air voids around probe needles artificially lower dielectric readings, registering false low VWC percentages. When inserting into compressed coco or rockwool, push the probe firmly in a single, straight motion without wiggling.
- Representative Plant Selection: Place index sensors in plants that represent median canopy size, height, and light exposure. Avoid placing sensors in edge plants exposed to high airflow or stunted runts with undersized root systems.
| Substrate Medium | Container Capacity (Peak VWC %) | Vegetative Overnight Dry-Back Target | Generative Overnight Dry-Back Target | Minimum Safe Dry-Back Floor (VWC %) |
|---|---|---|---|---|
| Horticultural Rockwool (Slabs/Blocks) | 75% – 85% VWC | 10% – 15% drop (65% floor) | 20% – 30% drop (50% floor) | 45% VWC (below 40% damages root hairs) |
| Coco Coir / Perlite (70/30) | 60% – 70% VWC | 8% – 12% drop (50% floor) | 15% – 22% drop (42% floor) | 35% VWC (below 30% causes salt lockout) |
| Sphagnum Peat Moss (Pro-Mix) | 50% – 60% VWC | 10% – 15% drop (40% floor) | 18% – 25% drop (32% floor) | 28% VWC (below 25% triggers severe hydrophobicity) |
| Living Organic Super Soil | 45% – 55% VWC | 5% – 8% drop (42% floor) | 8% – 12% drop (38% floor) | 32% VWC (below 30% collapses mycorrhizal fungi) |
The benchmark thresholds in Table 1 represent proven commercial standards across dominant growing formats. However, as substrate moisture declines during a targeted dry-back, cultivators frequently notice alarming spikes on their digital nutrient meters. Understanding the distinction between bulk solution EC and interstitial pore-water EC prevents erroneous corrective flushes.
Why does my substrate sensor show pore-water EC skyrocketing when my VWC drops during overnight dry-back?
Question sent by: Derek Sutton, via email.
“I run an automated crop steering setup in 2-gallon coco pots. My input feed is 2.2 dS/m EC. During the day at full saturation, my substrate sensor reads 2.6 dS/m EC. But after an 18% overnight dry-back, my sensor shows pore-water EC spiking all the way to 5.2 dS/m before lights-on! Are my plants burning in their sleep, or is my sensor broken?”
Your sensor is operating with perfect mathematical accuracy, and your plants are not burning: you are witnessing the fundamental physical chemistry of interstitial pore-water concentration.
Digital crop steering sensors (such as Aroya or TEROS 12) calculate pore-water electrical conductivity (σp) using the Hilhorst model. Pore-water EC represents the actual electrical conductivity of the microscopic water films coating root hairs. During the photoperiod and dark cycle, your cannabis plant transpires pure water molecules rapidly while leaving the majority of dissolved fertilizer ions (calcium, nitrates, potassium, sulfates) behind in the remaining capillary water.
If your substrate starts at 65% VWC with an EC of 2.6 dS/m, and the plant transpires water down to 47% VWC (an 18% dry-back), the same mass of dissolved mineral ions is now dissolved in 28% less liquid volume. Simple chemistry dictates that ion concentration must surge: the pore-water EC naturally climbs toward 5.0+ dS/m. This diurnal EC spike is not a defect; it is the primary physiological trigger of generative steering. The elevated osmotic pressure signals plant roots to synthesize abscisic acid (ABA), tighten floral internodal spacing, and accelerate trichome resin synthesis. As long as your morning P1 irrigation shots flush this concentrated pore water and return substrate EC back to 2.6 dS/m, this diurnal EC oscillation is completely safe and agronomically beneficial.
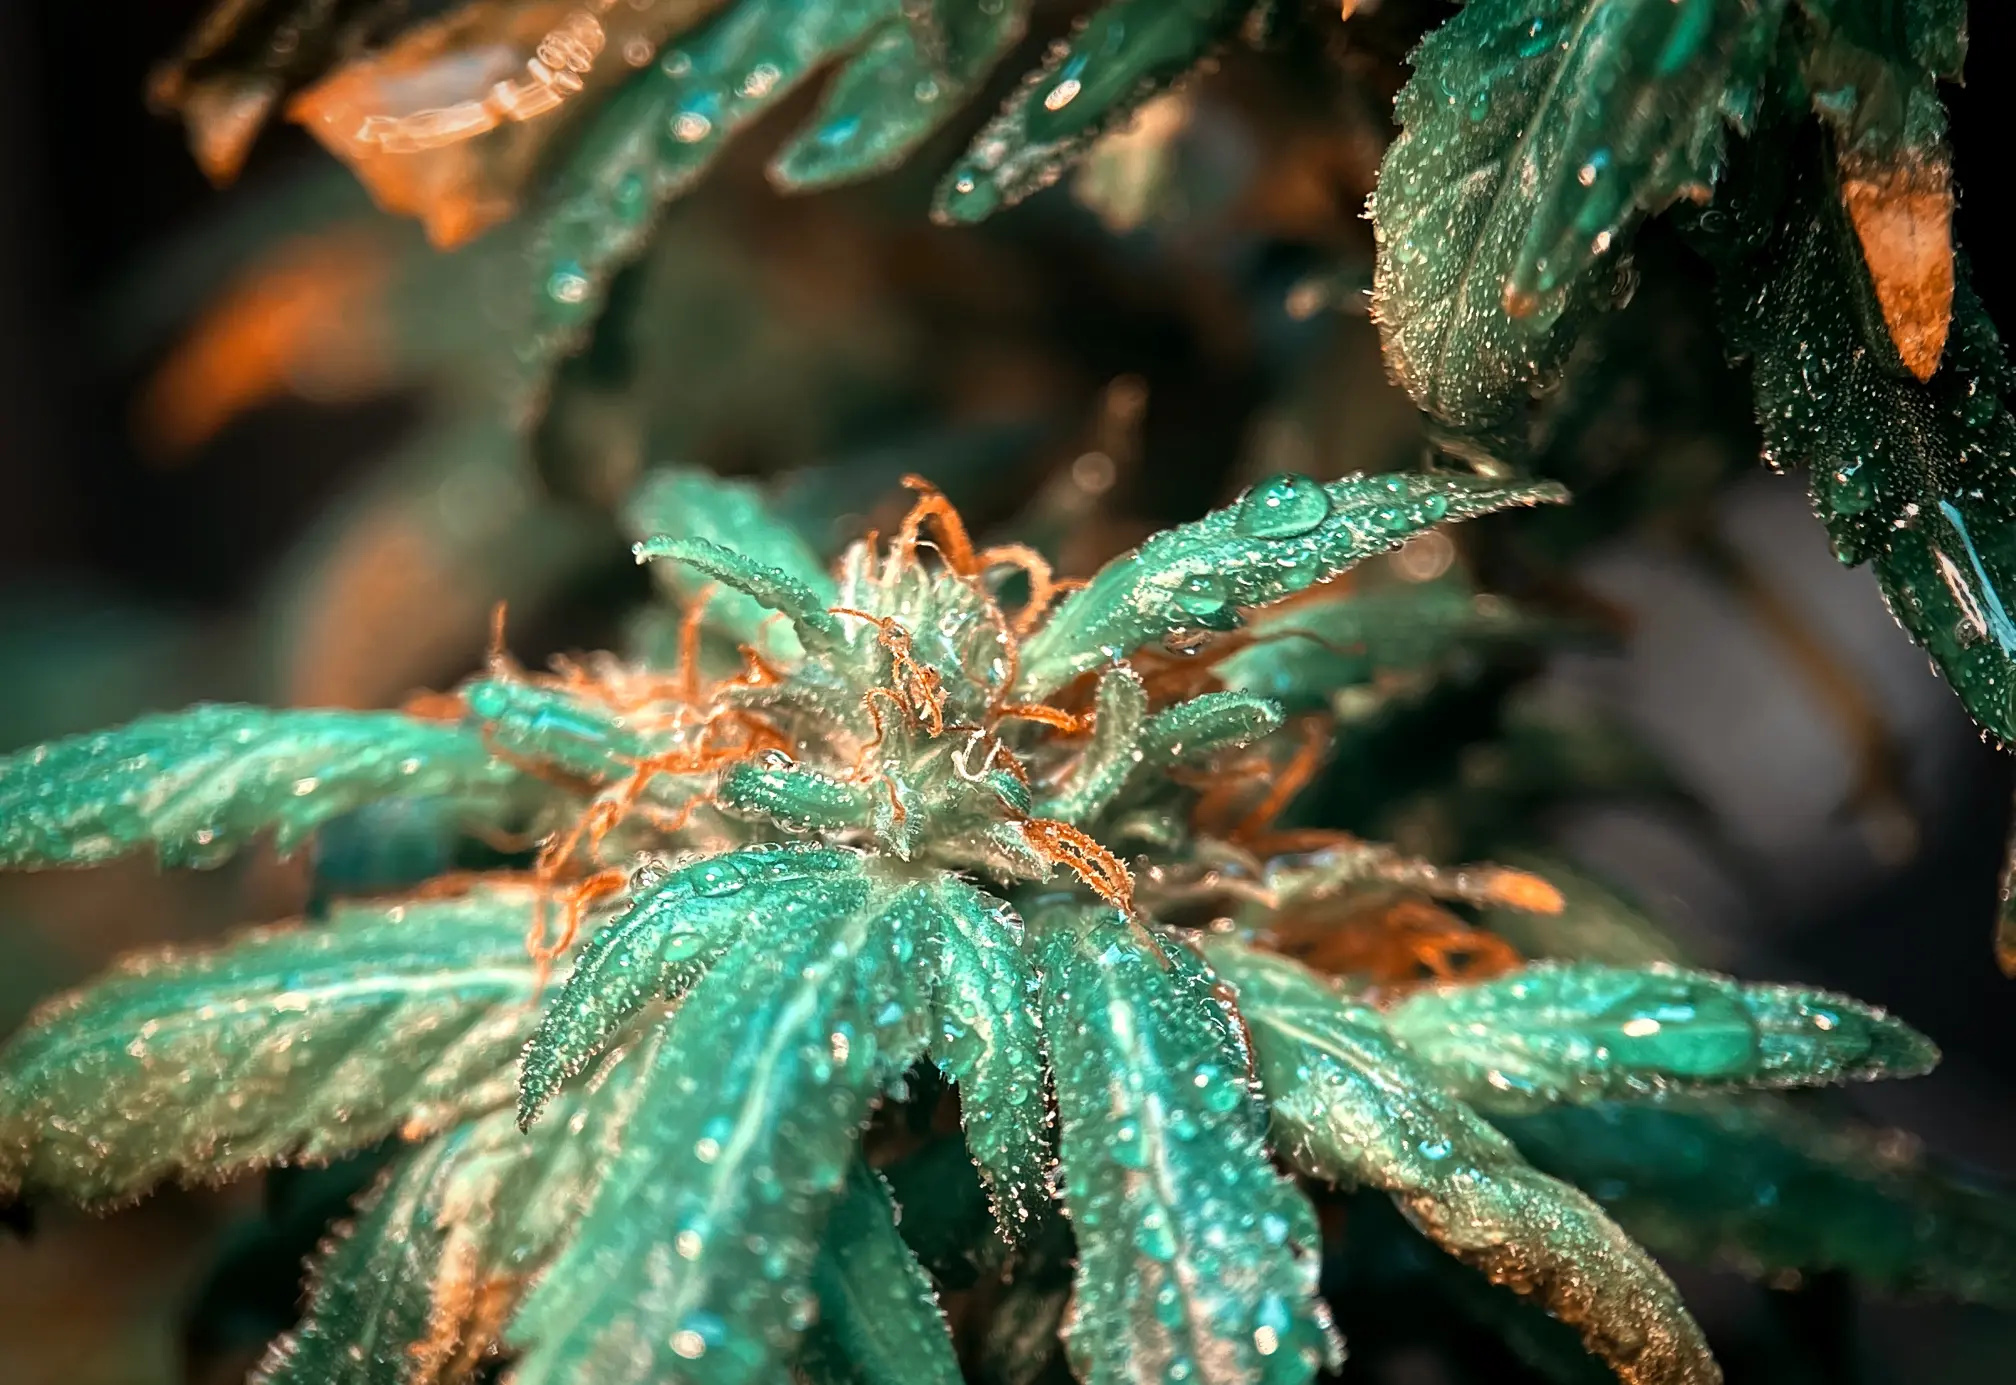
Flowering cannabis canopy responding to generative dry-back stress with accelerated resin synthesis.
Crop Steering Dynamics: Vegetative vs. Generative Dry-Back Targets
Crop steering is the practice of manipulating environmental cues (VPD, temperature, light intensity) and root-zone hydrology (irrigation shot size, frequency, and dry-back) to direct plant energy into either vegetative growth (stems, leaves, canopy size) or generative reproduction (flowers, resin glands, calyx swelling):
- Vegetative Crop Steering (Canopy Building): Deployed during the vegetative phase and late flower bulking (weeks 5 to 7). The objective is to minimize root-zone osmotic stress, encouraging rapid cell division, broad fan leaf expansion, and thick stem elongation. Vegetative steering utilizes smaller overnight dry-backs (8% to 12% in coco; 10% to 15% in rockwool), earlier morning P1 start times (1 hour post lights-on), smaller individual shot sizes (1% to 2% substrate volume), and lower input electrical conductivity. Substrate moisture remains consistently high, allowing root hairs to drink water with minimal negative matric tension.
- Generative Crop Steering (Floral Induction & Hardening): Deployed during the transition stretch (weeks 1 to 3 of flower) to prevent excessive internodal stretching, and during late flower (weeks 7 to 9) to stimulate trichome synthesis and flower ripening. Generative steering enforces large overnight dry-backs (15% to 22% in coco; 20% to 30% in rockwool), delayed P1 start times (2 to 2.5 hours post lights-on), larger shot sizes (3% to 5% volume), higher input EC, and early irrigation cutoffs (3 to 4 hours before lights-off). The resulting osmotic tension prompts the plant to produce compact, rock-hard floral clusters.
| Irrigation Parameter | Vegetative Steering (Canopy Expansion) | Generative Steering (Floral Induction & Hardening) |
|---|---|---|
| Target Overnight Dry-Back | 8% – 12% VWC drop (smaller, gentle dry-back) | 15% – 25% VWC drop (deep, aggressive dry-back) |
| P1 First Shot Start Time | 45 to 60 minutes after lights-on | 120 to 150 minutes after lights-on (delayed) |
| P3 Final Shot Cutoff Time | 1.5 to 2 hours before lights-off | 3.5 to 4.5 hours before lights-off (early cutoff) |
| Shot Size (% Substrate Volume) | Small pulses: 1.0% to 2.5% of container volume | Large pulses: 3.5% to 6.0% of container volume |
| Pore-Water EC Dynamics | Stable baseline: minimal diurnal EC swing (<+1.0 dS/m) | Dynamic swing: pore-water EC concentrates (+2.0 to +3.5 dS/m) |
| Morphological Plant Response | Rapid branch expansion, wide internodes, lush green leaf growth | Tight internodes, early floral bud formation, high resin density |
The Agronomic Golden Rule: Balance Shot Size with Dry-Back Depth
In automated fertigation, shot size must be mathematically scaled to your overnight dry-back target. If your plants achieve an 18% overnight dry-back, your morning P1 ramping shots must deliver enough total volume to replace that 18% plus achieve a 10% to 15% leaching fraction. If you attempt large dry-backs with tiny 1% shots, it will take six hours to reach container capacity, severely compressing your plant peak transpiration window. Use our specialized cannabis dryback calculator to determine exact milliliter shot volumes per plant based on container substrate volume and target dry-back percentages.
The crop steering methodology detailed above was developed primarily in commercial soilless facilities using inert stone wool and coco coir. When organic soil growers observe these dramatic yield and density results, they frequently attempt to replicate aggressive dry-backs in biological soil beds, leading to severe biological consequences.
Can I implement precision dry-back crop steering in living organic soil, or is it only for coco and rockwool?
Question sent by: Chloe Martin, via email.
“I manage a living organic soil facility with 30-gallon smart pots. I keep seeing commercial growers boast about getting 25% overnight dry-backs in rockwool to steer plants generatively. Can I let my living soil beds dry back by 20% to 25% to tighten my bud structure?”
Applying aggressive 20% to 25% dry-backs to living organic soil is an agronomic disaster that will severely degrade your soil biology and permanently damage crop yield.
Precision crop steering with deep dry-backs was engineered specifically for inert, sterile soilless hydroponics (rockwool and coco coir). In soilless media, plants receive 100% bioavailable dissolved mineral ions directly from fertilizer injectors. There is no biological soil food web to protect. When coco dries down to 40% VWC, you are manipulating plant hormones without collateral biological damage.
In living organic soil, plant nutrition depends entirely on living organisms: beneficial bacteria, protozoa, nematodes, and delicate mycorrhizal fungi. Soil microbes require continuous capillary water films to travel, respire, and enzymatically break down organic amendments (kelp, bone meal, crustacean meal). When a living soil bed drops below 32% to 35% VWC, soil water potential becomes so negative that microbial motility halts, fine fungal hyphae desiccate, and nutrient mineralization collapses. Furthermore, severe dry-backs trigger intense soil hydrophobicity in peat and compost, causing subsequent waterings to channel out the sides. In living soil, maintain steady-state capillary moisture between 40% and 52% VWC with gentle, tiny dry-backs (5% to 8% max), steering plants instead through light intensity, ambient VPD, and organic top-dresses.

Potted cannabis container evaluated for gravimetric weight loss and container capacity replenishment.
Hydraulic Failure Modes: Insufficient Dry-Back, Desiccation, and Pore-Water Spikes
When dry-back scheduling is mismanaged, plants exhibit acute physiological and pathological stress symptoms:
- Insufficient Dry-Back (<6% Overnight VWC Drop): If substrate moisture remains above 70% VWC continuously through the dark cycle, root cortical tissues experience chronic hypoxia. Root tips die, adventitious root formation halts, and the plant becomes highly susceptible to Pythium and Phytophthora root rot. Foliar symptoms include thick, leathery leaf clawing, delayed floral transition, and loose, airy “larf” buds.
- Excessive Desiccation (Exceeding the Permanent Wilting Point): Allowing substrate moisture to drop below 35% VWC in rockwool or 30% in coco causes root hairs to collapse through cellular plasmolysis. When roots lose cellular turgor, stomata slam shut, halting carbon dioxide fixation. Re-watering a desiccated root zone takes days to re-establish fine root hair networks, during which plant growth is completely stalled.
- Runaway Pore-Water Salinity Spikes: If cultivators combine deep dry-backs with zero leaching runoff, pore-water EC escalates exponentially. Over several days, un-leached fertilizer salts accumulate, driving interstitial EC past 8.0 to 10.0 dS/m. Root cortical cells suffer osmotic reverse-flow: water is pulled out of root tissue into the medium, causing catastrophic marginal leaf necrosis and scorched calyx tips. Review our master guide on cannabis fertilizer math and elemental PPM to balance reservoir nutrient concentrations with targeted dry-back curves.
Dynamic Dry-Back Optimization: Shot Sizing, P1/P2/P3 Windows, and Systemic Calibration
To program automated fertigation controllers (such as Argus, Priva, Agrowtek, or TrolMaster) for precision dry-back crop steering, follow this standardized four-phase operational sequence:
1. P1 Phase: Ramping to Container Capacity
Initiate P1 shots 60 to 120 minutes after lights-on. Deliver a series of small, uniform pulses (each pulse delivering 1.5% to 3.0% of substrate volume) spaced 15 to 30 minutes apart. The goal of P1 is to steadily elevate substrate VWC from the overnight dry-back floor up to full container capacity, achieving the first leachate runoff by the 3rd or 4th shot. Achieving container capacity during P1 resets root-zone EC and refreshes dissolved oxygen.
2. P2 Phase: Maintenance Hydration
Once container capacity is reached, pause irrigation for 45 to 60 minutes. As the canopy transpires heavily through peak midday radiation, monitor VWC drawdown. Trigger intermittent P2 maintenance pulses (1% to 2% substrate volume) whenever VWC declines by 3% to 4% from container capacity. In vegetative steering, multiple P2 shots maintain high hydration; in generative steering, P2 shots are restricted or completely eliminated to allow an early, continuous drawdown.
3. P3 Phase: The Overnight Dry-Back Window
Enforce an absolute irrigation cutoff 2 to 4 hours before lights-off. Ceasing irrigation before the dark cycle allows the plant to transpire actively while lamps are still running, driving an initial 3% to 5% VWC drop before darkness. Throughout the 12-hour dark cycle, substrate moisture continues to decline, achieving your exact target overnight dry-back (e.g., 18% in coco) just as lights switch on the following morning.
Core Coverage Synthesis: Absorbed Raw Questions and Essential Directives
To consolidate comprehensive technical authority into a single URL without opening competing pages across the index, this section synthesizes the five absorbed raw intents:
Cannabis Dryback Explained for Beginners
Dry-back is simply the percentage of water that a cannabis plant and container lose between watering events. When you water a pot to full saturation, it reaches 100% of its container capacity. As the plant transpires throughout the day and night, the moisture percentage drops. The difference between full saturation and the lowest moisture point right before you water again is the dry-back. Controlled dry-backs pull fresh air and oxygen into the root zone, preventing root rot and telling the plant whether to focus on leaf growth or flower production.
Cannabis Dry-Back Explained: How Much Is Safe?
In soilless media like coco coir, a daily overnight dry-back of 10% to 15% VWC drop is completely safe and optimal for vegetative growth, while a 15% to 22% drop is safe for flowering plants. In rockwool blocks, safe overnight dry-backs range from 15% to 28% VWC drop. Dry-backs become dangerous when substrate moisture drops below the permanent wilting floor (below 35% VWC in rockwool, below 30% in coco, or below 25% in peat), causing root hairs to desorb water, cell membranes to collapse, and fertilizer salts to crystallize.
Cannabis Dry-Back Explained
Dry-back operates as an environmental steering lever. Shallow dry-backs (8% to 12% in coco) signal the plant that water is limitless, encouraging lush, vegetative branch expansion. Deep dry-backs (16% to 22% in coco) subject the plant to controlled, non-damaging osmotic tension. The plant responds by synthesizing abscisic acid, keeping internodal spacing tight during the floral stretch, and directing carbon into trichome heads and secondary aromatic terpenes.
Container Capacity and Available Water Explained
Container capacity is the maximum amount of water a pot can hold against gravity after excess drainage ceases. The water held between container capacity and the permanent wilting point is known as Plant-Available Water (PAW). Cannabis cannot extract 100% of the water in a pot: capillary forces hold the last 15% to 25% of moisture with extreme negative tension that root cells cannot overcome. Precision cultivators manage irrigation to keep substrate VWC safely within the plant-available water envelope.
Volumetric Water Content for Indoor Growers
Volumetric Water Content (VWC) measures the exact volume of water per volume of container space as a percentage. It is captured in real time using high-frequency dielectric permittivity sensors inserted permanently into root blocks. Tracking VWC enables commercial indoor growers to eliminate manual guesswork, automate drip fertigation solenoids, and ensure that every production table achieves identical dry-back curves regardless of seasonal climate shifts.
Substrate Dry-Back and VWC Management Checklist
Audit these critical agronomic checkpoints to maintain precision crop steering and root-zone oxygenation:
- Digital VWC and dielectric permittivity sensors are installed in representative index containers in every grow zone.
- Sensor probes are inserted horizontally into the middle-to-lower third of the root ball, ensuring zero air voids around rods.
- Container capacity baseline is established immediately following free gravitational drainage after morning P1 shots.
- Vegetative overnight dry-backs are maintained between 8% and 12% VWC in coco (10% to 15% in rockwool).
- Generative flowering dry-backs achieve 15% to 22% VWC in coco (18% to 28% in rockwool) to tighten internodal stretch.
- P1 irrigation start time is delayed 60 to 120 minutes post lights-on to allow stomatal opening and transpiration establishment.
- P3 irrigation cutoff is strictly enforced 2 to 4 hours before lights-off to ensure active dry-back before dark dormancy.
- Substrate moisture is never allowed to breach the minimum safe floor (40% VWC in rockwool, 32% VWC in coco).
- Pore-water EC spikes during dry-back are audited to confirm they return smoothly to baseline upon morning P1 saturation.
- Living organic soils are managed with steady-state moisture (40% to 50% VWC); aggressive dry-backs are strictly avoided.
Scientific References
- Bugbee, B. (2004). Nutrient management in recirculating hydroponic culture. Acta Horticulturae, 648, 99-112.
- Hilhorst, M. A. (2000). A pore water conductivity sensor. Soil Science Society of America Journal, 64(6), 1922-1925.
- Kramer, P. J., & Boyer, J. S. (1995). Water Relations of Plants and Soils. Academic Press, San Diego, CA.
- Marschner, H. (2012). Marschner’s Mineral Nutrition of Higher Plants (3rd ed.). Academic Press, London.
- Taiz, L., Zeiger, E., Møller, I. M., & Murphy, A. (2015). Plant Physiology and Development (6th ed.). Sinauer Associates, Sunderland, MA.
- Wolff, D., & Bugbee, B. (2018). Measurement of water content in soilless substrates using time domain reflectometry. HortTechnology, 28(5), 621-628.
- Zheng, Y. (2021). Handbook of Cannabis Production in Controlled Environments. CRC Press, Boca Raton, FL.
Share this article
A quick overview of the topics covered in this article.