Cannabis Fertilizer Math and Elemental PPM: Guaranteed Analysis and Feed Calculations
In commercial and advanced cannabis cultivation, relying on retail bottle feed charts, milliliters-per-gallon guidelines, or arbitrary N-P-K ratios is the single greatest cause of chronic over-fertilization, nutrient antagonisms, and compressed profit margins. Fertilizer manufacturers formulate consumer feed charts with built-in safety margins, commercial product-layering strategies, and misleading oxide percentages that obscure what a plant is actually receiving at the cellular level. Cannabis root plasma membrane transporters do not absorb fertilizer brand names, volumetric liquid shots, or complex oxide compounds; they absorb individual, dissolved elemental ions governed by strict stoichiometric and electrochemical principles. To achieve absolute nutritional control, formulate custom recipes from raw technical dry salts, or diagnose complex deficiency look-alikes, a cultivator must master the mathematics of fertilizer chemistry. Translating guaranteed analysis percentages into true elemental Parts Per Million (PPM or mg/L) converts feeding from an unpredictable art of guesswork into a precise, repeatable scientific discipline.
Plant Physiology and Cellular Uptake: Why Elemental PPM Governs Nutrition
To understand why elemental fertilizer math is essential, one must look at how plant roots interact with the substrate solution. Cannabis roots absorb macro- and micronutrients through specialized trans-membrane transport proteins embedded in the epidermal and cortical cells of root hairs. These transporters operate on exact thermodynamic ion concentrations. For example, high-affinity nitrate transporters (NRT1 and NRT2) couple the inward movement of nitrate anions (NO3–) with protons (H+) driven by the plasma membrane H+-ATPase electrochemical gradient. Similarly, inward-rectifying potassium channels (AKT1) and high-affinity phosphate transporters (Pht1 family) regulate ion influx based on precise ionic activities in the surrounding pore water.
When a cultivator doses fertilizer using vague guidelines like “10 mL per gallon of Part A and 5 mL of Bloom Booster”, the actual concentration of free elemental ions in solution remains completely unknown. Depending on the manufacturer’s formulation, that dose could deliver 120 ppm of elemental nitrogen or 260 ppm; it could supply 40 ppm of elemental phosphorus or a toxic 150 ppm. Operating without elemental PPM calculations leaves the cultivator blind to ion ratios, inviting competitive cation inhibition (Mulder’s antagonism) and osmotic stress.
The Legal Oxide Deception: P2O5 and K2O vs Elemental P and K
The numbers displayed prominently on fertilizer labels (the N-P-K grade, such as 10-30-20) do not represent pure elemental nitrogen, phosphorus, and potassium. By historical agricultural labeling conventions established in the 19th century, nitrogen is reported as elemental nitrogen (N), but phosphorus is legally reported as phosphate oxide (P2O5), and potassium is reported as potash oxide (K2O). Because oxygen makes up a major fraction of the molecular weight of these oxides, an N-P-K label drastically exaggerates the actual quantity of nutrient in the bag. Pure elemental phosphorus constitutes only 43.64% of P2O5; pure elemental potassium constitutes only 83.02% of K2O. Failing to convert oxides to elemental form causes growers to miscalculate actual phosphorus and potassium delivery by up to 130%.
The Universal Oxide-to-Elemental Conversion Factors
To extract truth from fertilizer guaranteed analysis labels, cultivators must memorize and apply the precise gravimetric stoichiometric conversion factors derived from the atomic masses of the elements:
- Phosphorus (P): To convert Phosphate Oxide (P2O5) to Elemental Phosphorus (P), multiply by 0.4364 (or divide by 2.291).
- Potassium (K): To convert Potash Oxide (K2O) to Elemental Potassium (K), multiply by 0.8302 (or divide by 1.205).
- Calcium (Ca): If a label reports Calcium Oxide (CaO), multiply by 0.7147 to find elemental Calcium (Ca).
- Magnesium (Mg): If a label reports Magnesium Oxide (MgO), multiply by 0.6030 to find elemental Magnesium (Mg).
- Sulfur (S): If a label reports Sulfate (SO4), multiply by 0.3338 to find elemental Sulfur (S).
For example, a synthetic bloom booster claiming a guaranteed analysis of 0-50-30 actually delivers only 21.82% elemental phosphorus (50 x 0.4364) and 24.91% elemental potassium (30 x 0.8302). Calculating nutrient recipes directly from raw label numbers without applying these factors results in severe mathematical distortion.

Calculating elemental nitrate and ammonium fractions to maintain balanced vegetative canopy development.
The Core Formulas: Calculating Elemental PPM from Any Fertilizer
In modern agricultural chemistry, one Part Per Million (PPM) is defined as one milligram of solute per liter of solution (1 mg/L), equivalent to one gram of solute per 1,000 liters (1 g/m3). Using metric units eliminates conversion errors and establishes a universal calculation framework:
1. The Master Metric Formula
To calculate the elemental PPM delivered by any dry or liquid fertilizer in a metric reservoir, use the master equation:
Elemental PPM (mg/L) = [Application Rate (g/L)] × [Elemental Decimal Fraction] × 1,000
Where the Elemental Decimal Fraction is the guaranteed percentage on the label (divided by 100), multiplied by the oxide conversion factor if applicable.
2. Step-by-Step Practical Example: Calcium Nitrate
Consider commercial greenhouse-grade Calcium Nitrate with a guaranteed analysis of 15.5-0-0 + 19% Ca. The label indicates 15.5% total nitrogen (14.4% nitrate-N, 1.1% ammoniacal-N) and 19.0% water-soluble calcium. Suppose a cultivator doses 1.0 gram per liter (3.785 grams per gallon):
- Nitrogen PPM: 1.0 g/L × 0.155 × 1,000 = 155 ppm Elemental N (specifically 144 ppm NO3-N and 11 ppm NH4-N).
- Calcium PPM: 1.0 g/L × 0.190 × 1,000 = 190 ppm Elemental Ca.
By dosing exactly 1.0 g/L of calcium nitrate, the cultivator immediately knows they have supplied 155 ppm nitrogen and 190 ppm calcium. No ambiguity, no guessing.
3. US Gallon Conversion Formula
For facilities operating on US gallons (where 1 US gallon = 3.78541 liters), the formula adjusts to account for the volume conversion:
Elemental PPM = [Grams per Gallon / 3.7854] × [Elemental Decimal Fraction] × 1,000
Conversely, if you know your desired target PPM and want to find how many grams to add per gallon, rearrange the formula:
Grams per Gallon = [Target PPM × 3.7854] / [Elemental Decimal Fraction × 1,000]
The Five-Salt Mathematical Walkthrough: Step-by-Step Formulation
To understand how commercial agronomists formulate complete recipes from scratch, follow this five-salt calculation sequence designed to achieve a standard vegetative profile targeting 150 ppm N, 40 ppm P, 180 ppm K, 100 ppm Ca, and 45 ppm Mg in a 100-gallon reservoir:
- Step 1: Solve for Calcium using Calcium Nitrate (15.5-0-0 + 19% Ca). Calcium nitrate is the sole practical source of water-soluble calcium. To supply 100 ppm Ca: Grams per Gallon = (100 × 3.7854) / (0.190 × 1,000) = 1.99 grams per gallon (199 grams for 100 gallons). This dose simultaneously delivers Nitrogen: (1.99 / 3.7854) × 0.155 × 1,000 = 81.5 ppm N. Remaining nitrogen needed: 150 – 81.5 = 68.5 ppm N.
- Step 2: Solve for Phosphorus using Monopotassium Phosphate [MKP] (0-52-34). MKP delivers 22.7% P (52 × 0.4364) and 28.7% K (34 × 0.8302). To supply 40 ppm P: Grams per Gallon = (40 × 3.7854) / (0.227 × 1,000) = 0.67 grams per gallon (67 grams for 100 gallons). This dose simultaneously delivers Potassium: (0.67 / 3.7854) × 0.287 × 1,000 = 50.8 ppm K. Remaining potassium needed: 180 – 50.8 = 129.2 ppm K.
- Step 3: Solve for remaining Nitrogen using Potassium Nitrate [KNO3] (13.7-0-46.2). Potassium nitrate delivers 13.7% N and 38.3% K (46.2 × 0.8302). To supply the remaining 68.5 ppm N: Grams per Gallon = (68.5 × 3.7854) / (0.137 × 1,000) = 1.89 grams per gallon (189 grams for 100 gallons). This dose simultaneously delivers Potassium: (1.89 / 3.7854) × 0.383 × 1,000 = 191.2 ppm K. Total potassium is now: 50.8 + 191.2 = 242 ppm K (slightly higher than the initial 180 ppm target, perfectly matching high-transpiration LED demand).
- Step 4: Solve for Magnesium using Magnesium Sulfate [Epsom Salt] (9.8% Mg, 13% S). To supply 45 ppm Mg: Grams per Gallon = (45 × 3.7854) / (0.098 × 1,000) = 1.74 grams per gallon (174 grams for 100 gallons). This dose simultaneously delivers Sulfur: (1.74 / 3.7854) × 0.130 × 1,000 = 59.7 ppm S.
- Step 5: Add Chelated Micronutrients. Add a technical micronutrient blend (such as Sprint 330 Fe-DTPA at 7% Fe) at 0.043 grams per gallon to deliver 3.0 ppm Elemental Iron, alongside trace zinc (0.15 ppm), manganese (0.35 ppm), boron (0.25 ppm), copper (0.05 ppm), and molybdenum (0.02 ppm).
Total fertilizer mass required for 100 gallons of working solution: 633 grams (approximately 1.4 lbs), costing under $1.50 per 100 gallons compared to $25.00 to $40.00 for commercial bottled liquids.
Stock Tank Concentrate Mathematics: Injection Ratios
In automated fertigation rooms utilizing proportional injectors (such as Dosatron or precision peristaltic skids), fertilizers are not dissolved in the final working reservoir; they are formulated as concentrated stock solutions. Commercial facilities operate on standardized volumetric injection ratios, typically 1:100 (1%) or 1:200 (0.5%):
- At a 1:100 injection ratio, 1 gallon of stock solution is injected into every 99 gallons of fresh water, producing 100 gallons of working solution. Therefore, every stock tank gallon must contain exactly 100 times the mass of fertilizer required for 1 gallon of working feed.
- If a recipe requires 1.99 grams of Calcium Nitrate per gallon of working feed, a 50-gallon stock tank at 1:100 requires: 1.99 g/gal × 100 × 50 gallons = 9,950 grams (9.95 kg or 21.9 lbs) of Calcium Nitrate.
- Solubility Limits: Always verify that target stock masses do not exceed maximum chemical solubility at room temperature (20 °C). For example, Calcium Nitrate has an extreme solubility limit of 1,200 g/L (10 lbs/gal), making high concentrates easy to dissolve. In contrast, Potassium Sulfate has a strict solubility ceiling of only 111 g/L (0.92 lbs/gal); exceeding this mass results in un-dissolved crystals settling on the tank floor and choking injector lines.
Why does my digital EC meter show 1,000 PPM when my elemental nutrient calculations add up to only 450 PPM?
Question sent by: Marcus Vance, via email.
“I built a custom vegetative feed recipe using dry salts targeting 140 ppm N, 35 ppm P, 150 ppm K, 90 ppm Ca, and 45 ppm Mg. When I sum the elemental numbers, the total is 460 ppm. But when I test the reservoir with my digital handheld pen, the meter reads 1,020 PPM! Did I make an enormous math error, and am I burning my plants?”
You did not make a math error; your plants are completely safe. You are encountering the critical difference between Elemental PPM (true chemical mass) and Meter PPM (TDS estimated via Electrical Conductivity).
First, your elemental calculation counts only the weight of the pure nutrient cations and anions (N, P, K, Ca, Mg). It does not include the weight of the carrier counter-ions that are chemically bonded to those elements in the salt. For example, when you add calcium nitrate, you are adding calcium and nitrate, but when you add magnesium sulfate [MgSO4], you are adding magnesium plus sulfate [SO42-]. That sulfate mass adds substantial dissolved solute weight (typically 80 to 120 ppm S) that was not in your initial 460 ppm sum. Total Dissolved Solids (TDS) represents the sum of all dissolved ions in solution, which naturally weighs significantly more than the primary elemental targets alone.
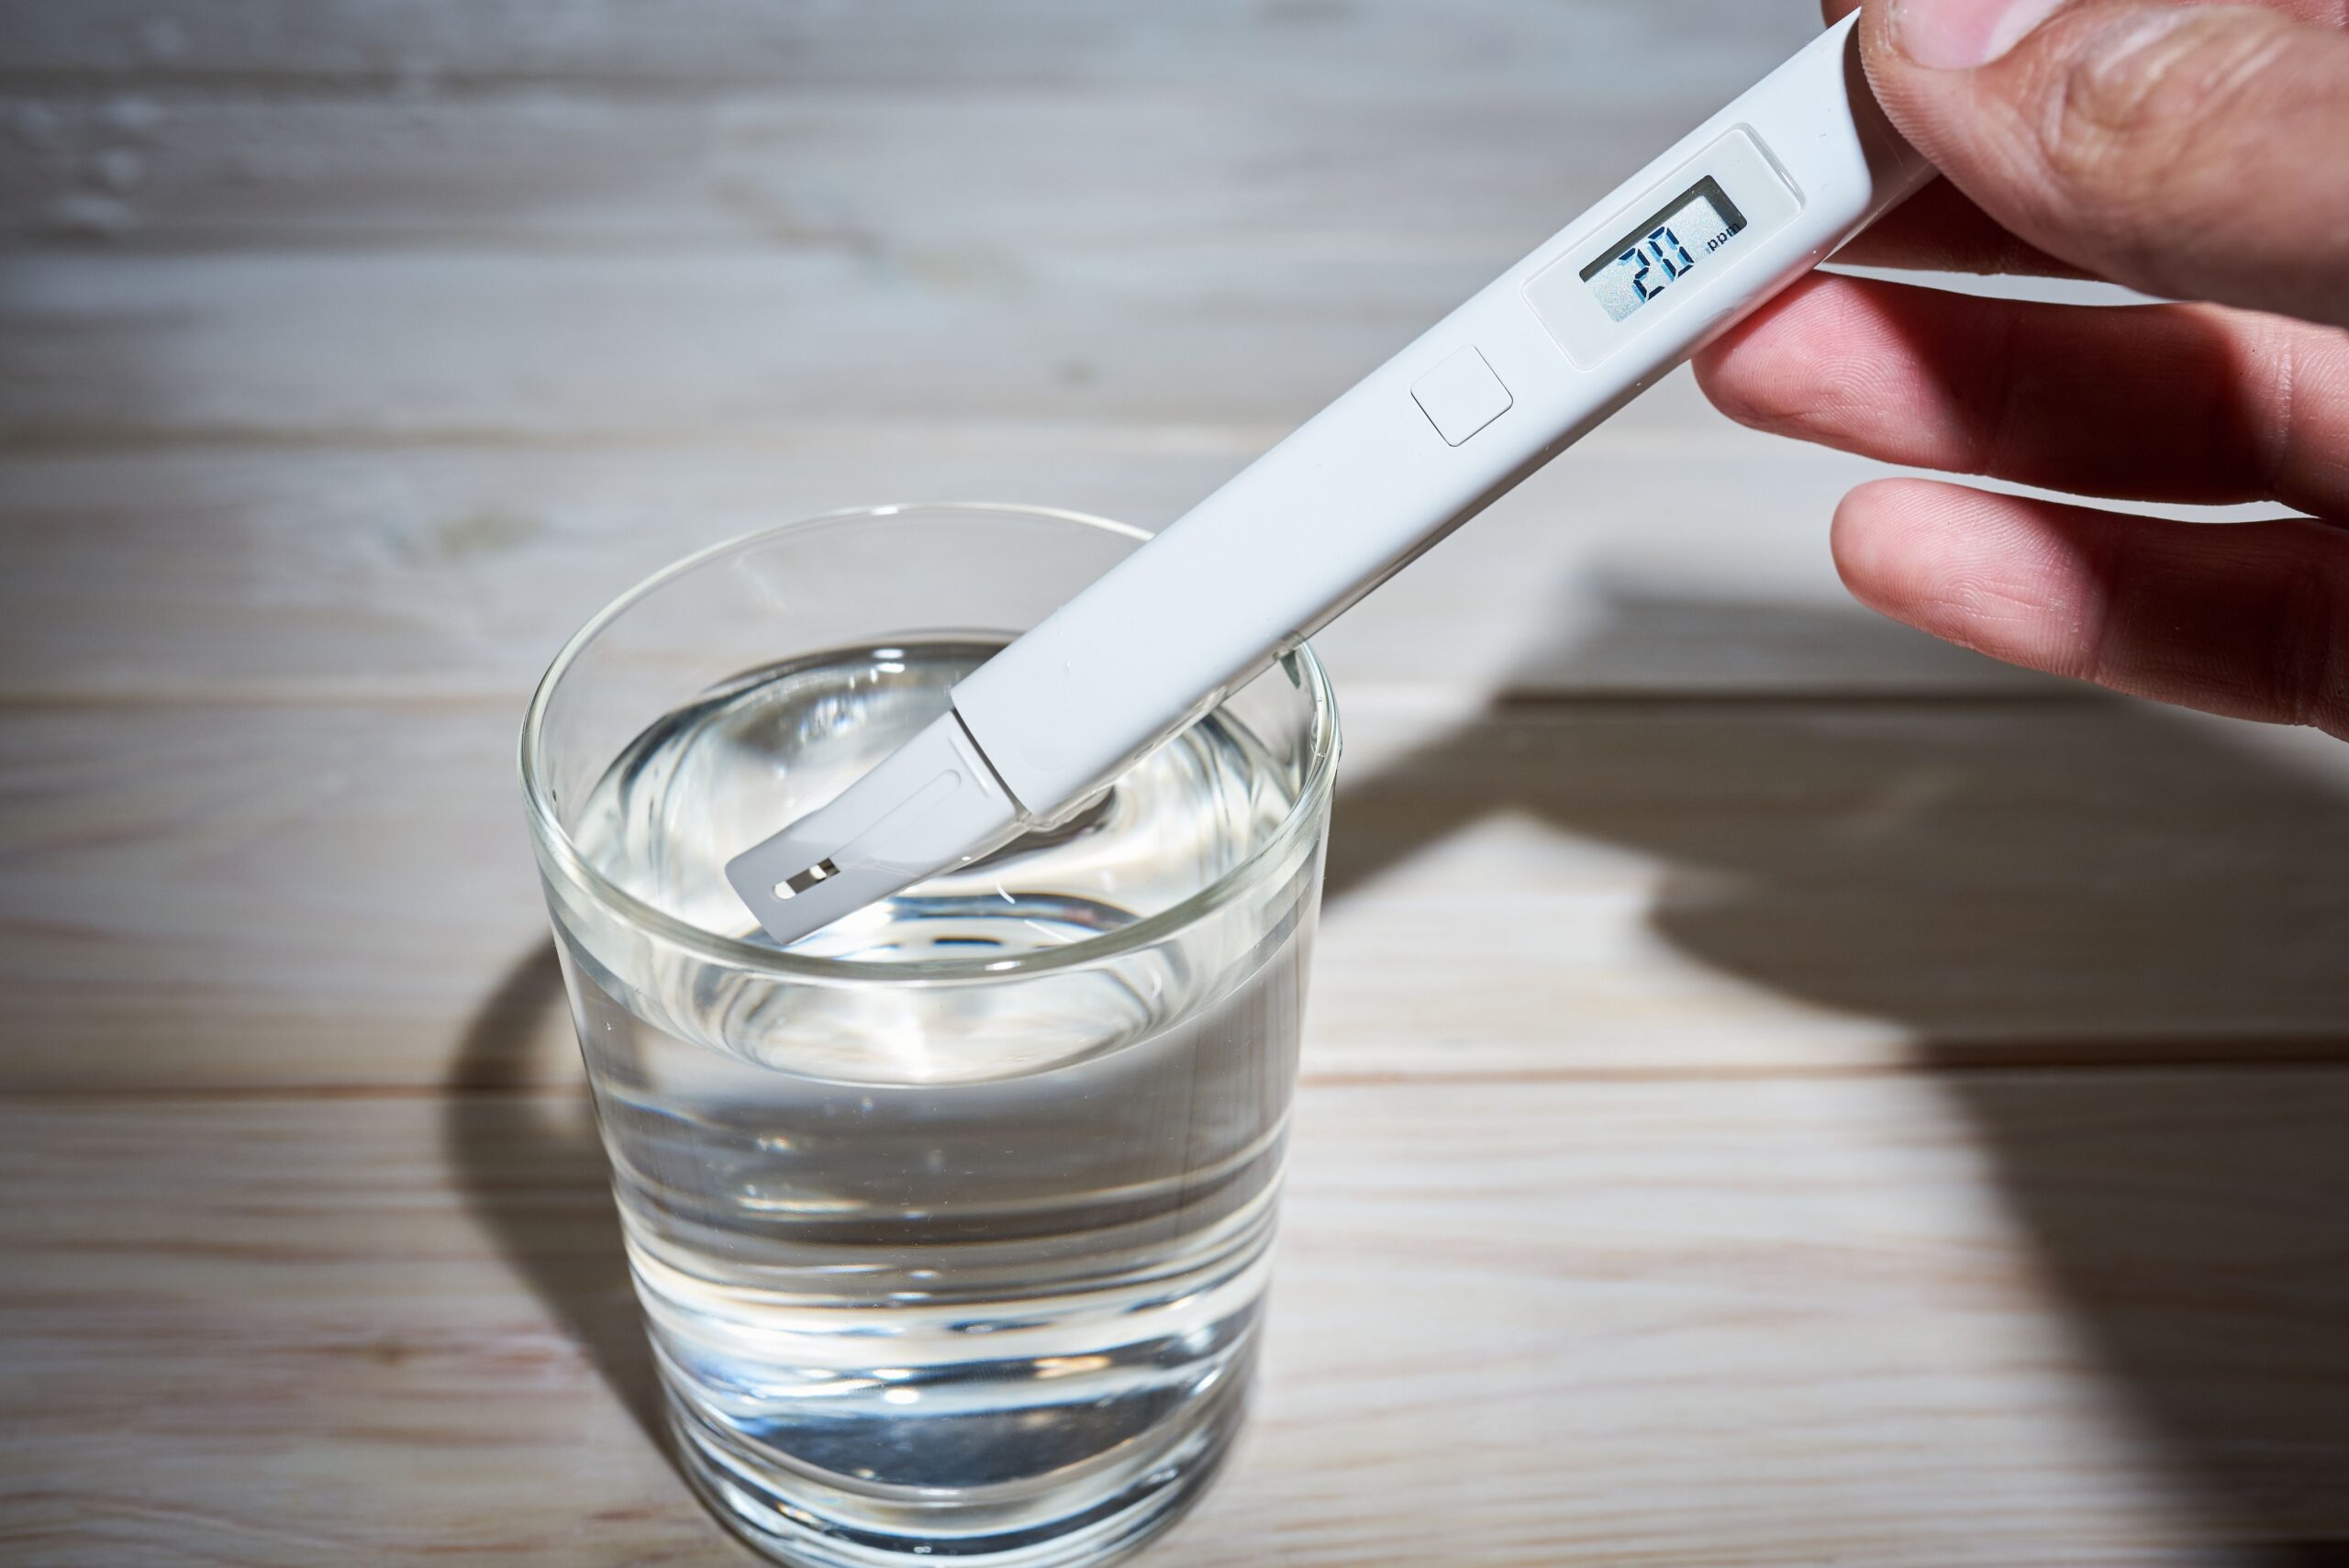
Second, and most importantly, digital pens do not count individual ions; they measure Electrical Conductivity (EC in μS/cm or dS/m) and multiply that electrical signal by a factory-set conversion multiplier (typically the 500-scale [TDS = EC × 500] or the 700-scale [TDS = EC × 700]). If your recipe has a true EC of 1.46 dS/m, a meter programmed on the 700 scale will display 1,022 PPM (1.46 × 700), whereas a meter on the 500 scale will display 730 PPM. For an in-depth breakdown of meter calibration scales and why Electrical Conductivity is the only universal benchmark, review our guide on cannabis EC meters and 500 vs 700 scales.

Formulating elemental potassium and phosphorus targets to optimize floral bulking without inducing cation lockouts.
Stage-Specific Elemental Targets: The Proven Nutritional Benchmarks
Over the past decade, controlled environmental research conducted by academic institutions (e.g., Bugbee, Zheng, Bernstein) has demystified cannabis nutrition, establishing optimal elemental PPM ranges across phenological development phases:
1. Seedlings and Rooted Clones (Early Vegetative)
Young root systems possess fragile epidermal cells and low transpiration rates. High osmotic pressure desiccates developing root caps. The optimal seedling/clone feed maintains an electrical conductivity between 0.8 and 1.2 dS/m:
- Nitrogen (N): 80 to 100 ppm (predominantly nitrate-N; ammonium < 10 ppm)
- Phosphorus (P): 20 to 30 ppm elemental P
- Potassium (K): 80 to 100 ppm elemental K
- Calcium (Ca): 60 to 80 ppm elemental Ca
- Magnesium (Mg): 30 to 40 ppm elemental Mg
- Sulfur (S): 35 to 50 ppm elemental S
2. Peak Vegetative Growth and Transition Stretch (Flower Weeks 1 to 2)
During rapid leaf canopy expansion and the photoperiod floral stretch, demand for nitrogen peaks to build Rubisco enzymes and structural stem tissue. Electrical conductivity scales to 1.6 to 2.0 dS/m:
- Nitrogen (N): 140 to 180 ppm
- Phosphorus (P): 35 to 45 ppm
- Potassium (K): 160 to 200 ppm
- Calcium (Ca): 100 to 130 ppm
- Magnesium (Mg): 45 to 60 ppm
- Sulfur (S): 60 to 80 ppm
- Iron (Fe): 2.5 to 3.5 ppm (chelated DTPA or EDDHA)
3. Peak Floral Bulking (Flower Weeks 3 to 6)
As stem elongation terminates and floral calyx swelling accelerates, nitrogen demand declines while potassium demand reaches maximum velocity to maintain osmotic turgor in swelling bracts. Electrical conductivity peaks at 2.0 to 2.4 dS/m:
- Nitrogen (N): 90 to 120 ppm (tapering downwards)
- Phosphorus (P): 50 to 65 ppm (avoiding extreme 100+ ppm excess)
- Potassium (K): 220 to 260 ppm
- Calcium (Ca): 90 to 110 ppm
- Magnesium (Mg): 50 to 65 ppm
- Sulfur (S): 70 to 90 ppm
4. Late-Flower Ripening and Natural Fade (Flower Weeks 7 to 9)
In the final two to three weeks before harvest, mineral nitrogen must be drastically restricted to trigger remobilization of stored leaf nutrients, allowing natural chlorophyll degradation and anthocyanin expression. Electrical conductivity tapers to 1.0 to 1.2 dS/m:
- Nitrogen (N): 30 to 50 ppm (or 0 ppm in final 7-10 days)
- Phosphorus (P): 30 to 40 ppm
- Potassium (K): 100 to 140 ppm
- Calcium (Ca): 50 to 70 ppm
- Magnesium (Mg): 30 to 40 ppm

In-situ testing of electrical conductivity and substrate pore-water salinity to audit theoretical mathematical formulations.
The Physical Chemistry of Electrical Conductivity: Kohlrausch Molar Conductance
Many cultivators wonder whether they can mathematically predict the exact Electrical Conductivity (EC in dS/m) of a recipe before mixing a single gram of fertilizer. The answer lies in physical solution chemistry, governed by Kohlrausch’s Law of independent migration of ions. At dilute agricultural concentrations, each dissolved ion contributes a specific electrical conductivity proportional to its equivalent ionic mobility (λ0) and valence charge (z):
- Potassium (K+): approximately 0.00187 dS/m per ppm
- Calcium (Ca2+): approximately 0.00298 dS/m per ppm
- Magnesium (Mg2+): approximately 0.00441 dS/m per ppm
- Nitrate (NO3–): approximately 0.00115 dS/m per ppm
- Monobasic Phosphate (H2PO4–): approximately 0.00059 dS/m per ppm
- Sulfate (SO42-): approximately 0.00166 dS/m per ppm
By multiplying each elemental ion PPM by its specific molar conductance factor and summing the products, an agronomist can mathematically predict the final reservoir EC within ±0.05 dS/m. If your physical meter reading diverges significantly from your calculated theoretical EC, you have either made a weighing error, experienced incomplete salt dissolution, or encountered significant unmeasured source water salinity.
Density, Specific Gravity, and Converting Liquid Fertilizer Labels
While dry technical salts report guaranteed analysis as percent by weight (% w/w), commercial bottled liquid nutrients present an additional mathematical hurdle: density. Liquid fertilizer labels in the United States often report guaranteed analysis as percent by weight (% w/w), but growers measure doses by volume (milliliters). If a liquid product has a high Specific Gravity (SG) – for example, a dense liquid bloom booster with a specific gravity of 1.35 g/mL – one liter of that liquid weighs 1,350 grams, not 1,000 grams.
To calculate true elemental PPM from a liquid fertilizer label reporting % w/w, apply the specific gravity correction factor:
PPM (mg/L) = [Dose (mL/L)] × [Specific Gravity (g/mL)] × [Elemental Decimal Fraction] × 1,000
If the label reports percent weight-by-volume (% w/v), the specific gravity is already factored into the percentage, allowing direct calculation without density correction. Always inspect the guaranteed analysis fine print for specific gravity before converting liquid bottle feeding schedules.
How do I account for minerals already present in my tap water when doing fertilizer math?
Question sent by: Elena Rostova, via email.
“My municipal tap water comes out of the faucet at 0.4 dS/m EC (about 200 ppm). A water test showed it contains 45 ppm calcium and 15 ppm magnesium. When calculating my calcium nitrate dose to hit 120 ppm Ca, do I subtract the tap water calcium first, or do I add the full dose on top?”
You must always subtract the background mineral content of your source water from your target elemental profile. Failing to subtract source water minerals is the most common reason growers accidentally induce cation lockouts and root-zone toxicity.
If your target calcium concentration is 120 ppm Ca, and your tap water already delivers 45 ppm of bioavailable dissolved calcium, your fertilizer must only supply the remaining difference: 120 – 45 = 75 ppm Ca. If you add a full 120 ppm Ca dose from calcium nitrate on top of the 45 ppm tap water background, your working solution will actually deliver 165 ppm Ca. That 37% calcium surplus will aggressively compete with magnesium and potassium at root uptake channels (Mulder’s antagonism), triggering severe lower-leaf interveinal chlorosis.
To execute source-water subtraction accurately, obtain a comprehensive agricultural laboratory water test (ICP-OES). Record background concentrations of Ca, Mg, SO4, Na, and alkalinity (as CaCO3). Subtract the source Ca and Mg from your target recipe. If source sodium exceeds 40 ppm or chloride exceeds 50 ppm, the water carries too much un-absorbable ballast salt; you must install a commercial reverse osmosis (RO) system to strip those ions before formulating precision cannabis nutrition.
Technical Dry Salt Characteristics and Elemental Contribution Matrix
The following reference matrix outlines the primary technical-grade dry mineral salts utilized in commercial cannabis facilities to formulate precision elemental recipes, detailing their chemical formulas, guaranteed elemental percentages, and application conversion metrics:
| Raw Mineral Salt | Chemical Formula | Guaranteed Elemental % | PPM Delivered at 1.0 g/L | Grams per Gallon for 100 PPM |
|---|---|---|---|---|
| Calcium Nitrate (Greenhouse Grade) | 5[Ca(NO3)2]•NH4NO3•10H2O | 15.5% N (14.4% NO3, 1.1% NH4), 19.0% Ca | 155 ppm N, 190 ppm Ca | 2.44 g/gal (for 100 ppm N) 1.99 g/gal (for 100 ppm Ca) |
| Potassium Nitrate | KNO3 | 13.7% N, 38.3% K (46.2% K2O) | 137 ppm N, 383 ppm K | 2.76 g/gal (for 100 ppm N) 0.99 g/gal (for 100 ppm K) |
| Monopotassium Phosphate (MKP) | KH2PO4 | 22.7% P (52.0% P2O5), 28.7% K (34.5% K2O) | 227 ppm P, 287 ppm K | 1.67 g/gal (for 100 ppm P) 1.32 g/gal (for 100 ppm K) |
| Magnesium Sulfate (Epsom Salt) | MgSO4•7H2O | 9.8% Mg (16.3% MgO), 13.0% S | 98 ppm Mg, 130 ppm S | 3.86 g/gal (for 100 ppm Mg) 2.91 g/gal (for 100 ppm S) |
| Potassium Sulfate (SOP) | K2SO4 | 41.5% K (50.0% K2O), 17.5% S | 415 ppm K, 175 ppm S | 0.91 g/gal (for 100 ppm K) 2.16 g/gal (for 100 ppm S) |
| Monocalcium Phosphate | Ca(H2PO4)2•H2O | 24.6% P, 15.9% Ca | 246 ppm P, 159 ppm Ca | 1.54 g/gal (for 100 ppm P) 2.38 g/gal (for 100 ppm Ca) |
| Iron Chelate (Fe-DTPA 7%) | Fe-DTPA | 7.0% Fe | 70 ppm Fe (at 1.0 g/L) | 0.16 g/gal (for 3.0 ppm Fe) |
Troubleshooting Math Errors: Antagonisms and Stock Tank Incompatibilities
Translating fertilizer math into physical reality requires avoiding chemical incompatibilities that precipitate nutrients out of solution:
1. The Tank A / Tank B Incompatibility Law
When formulating concentrated stock solutions (e.g., 100x concentrates for automated injection systems), concentrated calcium ions (Ca2+) must never be mixed in the same tank with concentrated sulfate ions (SO42-) or concentrated phosphate ions (HPO42-). If calcium nitrate and magnesium sulfate are dissolved together in a concentrated stock tank, they instantly react to form calcium sulfate (gypsum, CaSO4), an insoluble white precipitate that drops out of solution as heavy sediment. Similarly, concentrated calcium mixed with monopotassium phosphate precipitates as insoluble calcium phosphate [Ca3(PO4)2].
Commercial facilities strictly maintain a dual-tank stock architecture: Tank A contains Calcium Nitrate, Potassium Nitrate, and Iron Chelates; Tank B contains Monopotassium Phosphate, Magnesium Sulfate, Potassium Sulfate, and Micronutrients. These concentrates only meet inside the high-volume water line where rapid dilution prevents precipitation.
2. Cation Antagonism Ratios: Mulder’s Triangle
When designing custom recipes, calculating individual element PPM is only half the battle; cultivators must audit elemental ratios. The three major positively charged cations – Potassium (K+), Calcium (Ca2+), and Magnesium (Mg2+) – compete directly for entry at root cortical membrane channels. Maintain the following elemental weight ratios to ensure balanced uptake without competitive suppression:
- Vegetative Ratio (K : Ca : Mg): Approximately 4 : 2 : 1 (e.g., 160 ppm K, 80-100 ppm Ca, 40-50 ppm Mg).
- Mid-Flower Ratio (K : Ca : Mg): Shifts to approximately 4 : 1.5 : 1 (e.g., 240 ppm K, 90 ppm Ca, 60 ppm Mg).
- If Potassium exceeds Calcium by more than 3:1 in vegetative growth, expect rapid calcium tip burn on new shoot tips. If Potassium exceeds Magnesium by more than 5:1 in flowering, expect acute interveinal chlorosis on lower fan leaves.
Fertilizer Math and Elemental PPM Standard Operating Checklist
Enforce these standardized mathematical and mixing checkpoints when formulating nutrient solutions:
- Guaranteed analysis labels are converted from oxide forms: P2O5 is multiplied by 0.4364; K2O is multiplied by 0.8302.
- Source water is tested via laboratory ICP-OES; background Ca and Mg are subtracted from target recipe calculations.
- All recipe formulations are calculated and recorded in true elemental Parts Per Million (mg/L), not vague bottle ratios.
- Digital analytical scales are calibrated with certified calibration weights before weighing raw mineral dry salts.
- Dual stock tank separation is strictly enforced: Calcium and Iron in Tank A; Phosphorus, Potassium, and Sulfates in Tank B.
- Ammoniacal nitrogen (NH4-N) is limited to less than 10% to 15% of total nitrogen to prevent substrate acidification.
- Elemental cation ratios (K:Ca:Mg) are audited to prevent competitive ion inhibition (Mulder’s antagonism).
- Handheld digital EC meters are verified using standardized conductivity calibration solution (1,413 μS/cm).
- Meter TDS PPM conversion scale (500-scale vs 700-scale) is identified and standardized across all facility logs.
- Final reservoir solution is verified: electrical conductivity, pH (5.8 to 6.2), and dissolved oxygen (>8.5 mg/L) are logged.
Scientific References
- Barker, A. V., & Pilbeam, D. J. (2015). Handbook of Plant Nutrition (2nd ed.). CRC Press, Boca Raton, FL.
- Bernstein, N., Gorelick, J., Zerahia, R., & Koch, S. (2019). Impact of environmental conditions and nutrient availability on secondary metabolite production in medical cannabis. Industrial Crops and Products, 138, 111467.
- Bugbee, B. (2004). Nutrient management in recirculating hydroponic culture. Acta Horticulturae, 648, 99-112.
- Marschner, H. (2012). Marschner’s Mineral Nutrition of Higher Plants (3rd ed.). Academic Press, London.
- Sonneveld, C., & Voogt, W. (2009). Plant Nutrition of Greenhouse Crops. Springer, Dordrecht, Netherlands.
- Taiz, L., Zeiger, E., Møller, I. M., & Murphy, A. (2015). Plant Physiology and Development (6th ed.). Sinauer Associates, Sunderland, MA.
- Zheng, Y. (2021). Handbook of Cannabis Production in Controlled Environments. CRC Press, Boca Raton, FL.
Share this article
A quick overview of the topics covered in this article.