Cannabis EC Meter Guide: EC, TDS, PPM, Calibration, and 500 vs 700 Scales
Direct Answer: Electrical Conductivity, TDS, and Conversion Scales
In controlled environment cannabis agriculture, Electrical Conductivity (EC) is the universal scientific gold standard for quantifying the total ionic mineral salt concentration dissolved within irrigation water and root-zone pore solutions. Pure water (H2O) is an electrical insulator that does not conduct electricity. When mineral fertilizers dissolve in water, they dissociate into charged cations (such as K+, Ca2+, Mg2+, NH4+) and anions (such as NO3–, H2PO4–, SO42-). An EC meter passes a tiny alternating electrical current between two platinum or graphite electrodes, measuring the ease with which current flows through these dissolved mineral ions, expressed in milliSiemens per centimeter (mS/cm) or microSiemens per centimeter (μS/cm), where 1.0 mS/cm = 1,000 μS/cm.
In contrast, Total Dissolved Solids (TDS) and Parts Per Million (PPM) are mathematically estimated, unstandardized calculations derived by multiplying raw electrical conductivity by an arbitrary manufacturer conversion multiplier. Because different meter manufacturers utilize different conversion scales (primarily the 500 Scale / Hanna based on potassium chloride KCl, vs the 700 Scale / Truncheon based on sodium chloride NaCl), communicating in PPM creates widespread, catastrophic feeding errors. For instance, an identical solution reading 2.0 mS/cm EC reads as 1,000 PPM on a 500-scale meter, but reads as 1,400 PPM on a 700-scale meter. Cultivators must abandon PPM entirely and manage crop fertigation exclusively using absolute EC (mS/cm).
| Crop Growth Stage | Absolute EC (mS/cm) | 500 Scale (PPM 500 / Hanna) | 640 Scale (PPM 640 / Eutech) | 700 Scale (PPM 700 / Truncheon) | Osmotic Potential (kPa / bar) | Typical Nutrient Target |
|---|---|---|---|---|---|---|
| Seedlings & Unrooted Clones | 0.4 to 0.8 mS/cm | 200 to 400 PPM | 256 to 512 PPM | 280 to 560 PPM | -15 to -30 kPa (-0.15 to -0.30 bar) | Ultra-light mineral baseline; high moisture |
| Early Vegetative Canopy | 1.0 to 1.4 mS/cm | 500 to 700 PPM | 640 to 896 PPM | 700 to 980 PPM | -38 to -53 kPa (-0.38 to -0.53 bar) | Nitrogen-dominant vegetative expansion |
| Late Vegetative / Transition | 1.4 to 1.8 mS/cm | 700 to 900 PPM | 896 to 1,152 PPM | 980 to 1,260 PPM | -53 to -68 kPa (-0.53 to -0.68 bar) | Balanced N-P-K under increasing PPFD |
| Mid-Flowering (Peak Bulk, Wks 3-6) | 1.8 to 2.4 mS/cm | 900 to 1,200 PPM | 1,152 to 1,536 PPM | 1,260 to 1,680 PPM | -68 to -91 kPa (-0.68 to -0.91 bar) | Potassium and phosphorus floral loading |
| High-DLI Enriched CO₂ Bloom | 2.4 to 3.0 mS/cm | 1,200 to 1,500 PPM | 1,536 to 1,920 PPM | 1,680 to 2,100 PPM | -91 to -114 kPa (-0.91 to -1.14 bar) | Extreme PPFD (>1,000 μmol) + 1,400 ppm CO₂ |
| Pre-Harvest Ripening / Flush | 0.2 to 0.6 mS/cm | 100 to 300 PPM | 128 to 384 PPM | 140 to 420 PPM | -8 to -23 kPa (-0.08 to -0.23 bar) | Low electrical conductivity root clearing |
Never ask a grower “What PPM are you feeding?” without first verifying which conversion factor their meter uses. A reading of 1,000 PPM on an AC Infinity or Hanna meter (500 scale) represents 2.0 mS/cm EC. That exact same 2.0 mS/cm nutrient solution displays as 1,400 PPM on a Bluelab Truncheon (700 scale). If a grower using a 500-scale meter attempts to follow a 700-scale feeding schedule, they will accidentally overfeed their crop by 40%, causing severe leaf tip burn, magnesium lockout, and root dieback. Always configure your meter display to raw EC (mS/cm).

Plant Physiology and Root-Zone Chemistry: Osmotic Pressure and Ion Transport
To master electrical conductivity, cultivators must understand the biological physics governing root water absorption: osmotic potential (Psis). In botanical fluid dynamics, water movement is governed by total water potential (Psiw), moving spontaneously from regions of higher (less negative) water potential toward regions of lower (more negative) water potential:
Psiw = Psis + Psip + Psim
Where Psis is solute (osmotic) potential, Psip is hydrostatic turgor pressure, and Psim is matric potential. The van ‘t Hoff equation defines osmotic pressure (Pi) created by dissolved mineral ions:
Pi = i · M · R · T
Where i is the van ‘t Hoff dissociation factor, M is molar solute concentration, R is the universal gas constant, and T is absolute temperature in Kelvin. As dissolved fertilizer salts increase inside the root zone (higher EC), the pore water’s osmotic potential becomes increasingly negative:
- Optimal Osmotic Gradient (EC 1.4 to 2.2 mS/cm): Root epidermal cells maintain internal solute potentials of approximately -80 to -120 kPa (-0.8 to -1.2 bar). Because the external substrate solution maintains a higher water potential (-50 to -80 kPa), water molecules readily diffuse across root cell plasma membranes through aquaporin channels via natural forward osmosis, carrying dissolved mineral ions into vascular xylem tissue.
- Osmotic Drought and Reverse Osmosis (EC > 3.0 mS/cm): When fertilizer salts accumulate in the substrate, the external osmotic potential plunges below root cellular potential (dropping to -150 to -250 kPa). The thermodynamic pressure gradient reverses: water is physically pulled out of plant root cells into the surrounding salty substrate. Even if the container is dripping wet, the plant wilts severely from physiological drought, causing necrotic leaf tip margins (salt burn) and root tip plasmolysis.
3. Kohlrausch’s Law of Independent Migration and Molar Conductivity
To understand why two different fertilizer blends with identical chemical weights yield different EC readings, we examine Kohlrausch’s Law of Independent Migration of Ions. At infinite dilution, the total molar conductivity of an electrolyte solution equals the sum of the individual molar conductivities of its constituent cations and anions:
Lambdam = sum nu+ lambda+ + sum nu– lambda–
Where \nu is the stoichiometric coefficient and lambda is the limiting ionic conductivity of each ion species (measured in S·cm2/mol at 25 °C):
- Potassium Cation (ext{K}+): 73.5 imes 10-4 ext{ m}2 ext{S/mol}. Highly mobile monovalent cation with rapid uptake kinetics.
- Calcium Divalent Cation (ext{Ca}2+): 119.0 imes 10-4 ext{ m}2 ext{S/mol}. Carries a double positive charge, exerting higher electrostatic attraction and electrical conductance per mole.
- Nitrate Anion (ext{NO}3–): 71.4 imes 10-4 ext{ m}2 ext{S/mol}. Primary vegetative nitrogen source; moves rapidly through substrate solution.
- Sulfate Divalent Anion (ext{SO}42-): 160.0 imes 10-4 ext{ m}2 ext{S/mol}. Exhibits exceptionally high ionic conductance due to its double negative valence shell.
Because divalent ions (ext{Ca}2+, ext{Mg}2+, ext{SO}42-) conduct electricity almost twice as effectively as monovalent ions (ext{K}+, ext{NO}3–), a bloom fertilizer heavy in magnesium sulfate (Epsom salts) generates a significantly higher EC reading than a vegetative formula containing identical molar nitrogen, explaining why bloom solutions must be monitored with rigorous elemental awareness.
4. Mathematical Temperature Compensation Physics (Temperature Slope Coefficients)
Water viscosity decreases as temperature increases, allowing dissolved mineral ions to move faster and conduct more electrical current. The relationship between solution temperature and electrical conductivity is governed by the Linear Temperature Compensation Formula:
EC25 = (ECT / 1 + alpha (T – 25))
Where ECT is measured raw conductivity at temperature T (°C), EC25 is standardized conductivity at 25 °C (77 °F), and alpha is the temperature compensation coefficient (typically 0.019 to 0.021 / °C, or roughly 1.9% to 2.0% per degree Celsius).
If an uncompensated EC meter measures cold reservoir water at 15 °C (59 °F) reading 1.6 mS/cm, the actual normalized conductivity at standard 25 °C is 2.0 mS/cm. Cultivators using cheap meters without true Automatic Temperature Compensation (ATC) mistakenly believe their nutrient mix is weak, add more concentrated fertilizer salts, and accidentally incinerate seedling root tips when the water warms up inside the container.
How Nutritional Demand Changes: Stage, Medium, Water, and Environment
Target electrical conductivity is not a static number written on a fertilizer bottle; it is a dynamic equilibrium dictated by environmental transpiration and substrate buffering capacity:
1. Photosynthetic Photon Flux Density (PPFD) and Daily Light Integral (DLI)
Under intense lighting (PPFD 800 to 1,100 μmol/m²/s), plant photosynthetic rate accelerates, dramatically increasing transpirational water demand. When Vapor Pressure Deficit (VPD) is high (hot, dry air >1.5 kPa), plants transpire massive volumes of water to cool their foliage. If nutrient solution EC is kept high (>2.2 mS/cm) during hot periods, plants absorb water faster than mineral salts, causing toxic salt accumulation in the root zone. Under high transpiration conditions, cultivators must lower input EC (1.4 to 1.8 mS/cm) while increasing irrigation frequency. Conversely, under low PPFD or cool, humid conditions, transpiration slows, requiring higher solution EC (2.0 to 2.4 mS/cm) to deliver adequate daily mineral nutrition.
2. Substrate Physics: Inert Hydroponics vs Buffered Living Soil
- Inert Hydroponics (Rockwool, Coco Coir, DWC): Possess zero native nutritional buffer. Substrate pore solution EC fluctuates rapidly with every irrigation event. Cultivators must maintain strict daily input and runoff EC testing, ensuring runoff EC does not exceed input EC by more than 0.3 to 0.5 mS/cm.
- Organic Living Soil: Governed by soil organic matter and microbial mineralization. Nutrients are locked in complex organic matrices (feather meal, bone meal, humates) that do not conduct electricity until broken down by microbes. Soil slurry EC typically reads low (0.8 to 1.4 mS/cm), yet plants thrive without mineral deficiencies. Measuring soil EC with standard liquid probes can produce misleadingly low readings.
Deficiencies, Toxicities, and Antagonisms: Reading Root-Zone Salt Signals
A frequent error among beginner cultivators is misdiagnosing fertilizer excess as nutrient deficiency. When excess mineral salts accumulate, they trigger chemical antagonisms (ion competition) at root uptake sites:
| Excess Ion (High EC Culprit) | Blocked Mineral Ion (Antagonized Element) | Visual Foliar Symptom | Common Grower Misdiagnosis |
|---|---|---|---|
| Excess Potassium (K+) | Calcium (Ca2+) and Magnesium (Mg2+) | Brown necrotic spotting on new leaves; interveinal chlorosis on lower leaves | Grower adds Cal-Mag, worsening the salt buildup |
| Excess Nitrogen (NH4+) | Potassium (K+), Calcium (Ca2+), and Molybdenum | Dark green downward “clawing” leaves; edge necrosis | Grower assumes potassium deficiency and increases bloom booster |
| Excess Phosphorus (H2PO4–) | Iron (Fe2+), Zinc (Zn2+), and Copper (Cu2+) | Interveinal chlorosis at shoot tips; bleached upper growth | Grower adds micronutrient iron chelate while phosphorus binds it insoluble |
| Excess Calcium (Ca2+) | Magnesium (Mg2+) and Potassium (K+) | Upward leaf curling, rust-colored margins on mid-level foliage | Grower assumes fungal rust disease or light stress |
Never mix concentrated calcium nitrate (Part B) and potassium monophosphate (Part A) directly together in an un-diluted mixing container. When calcium ions (Ca2+) encounter orthophosphate ions (PO43-) or sulfate ions (SO42-) at high concentrations, they chemically precipitate into insoluble calcium phosphate (Ca3(PO4)2) or calcium sulfate (gypsum, CaSO4). This chemical reaction locks both minerals out of solution as an un-dissolvable white sediment that clogs dripper emitters and starves your crop. Always dissolve Part A fully in water before adding Part B.
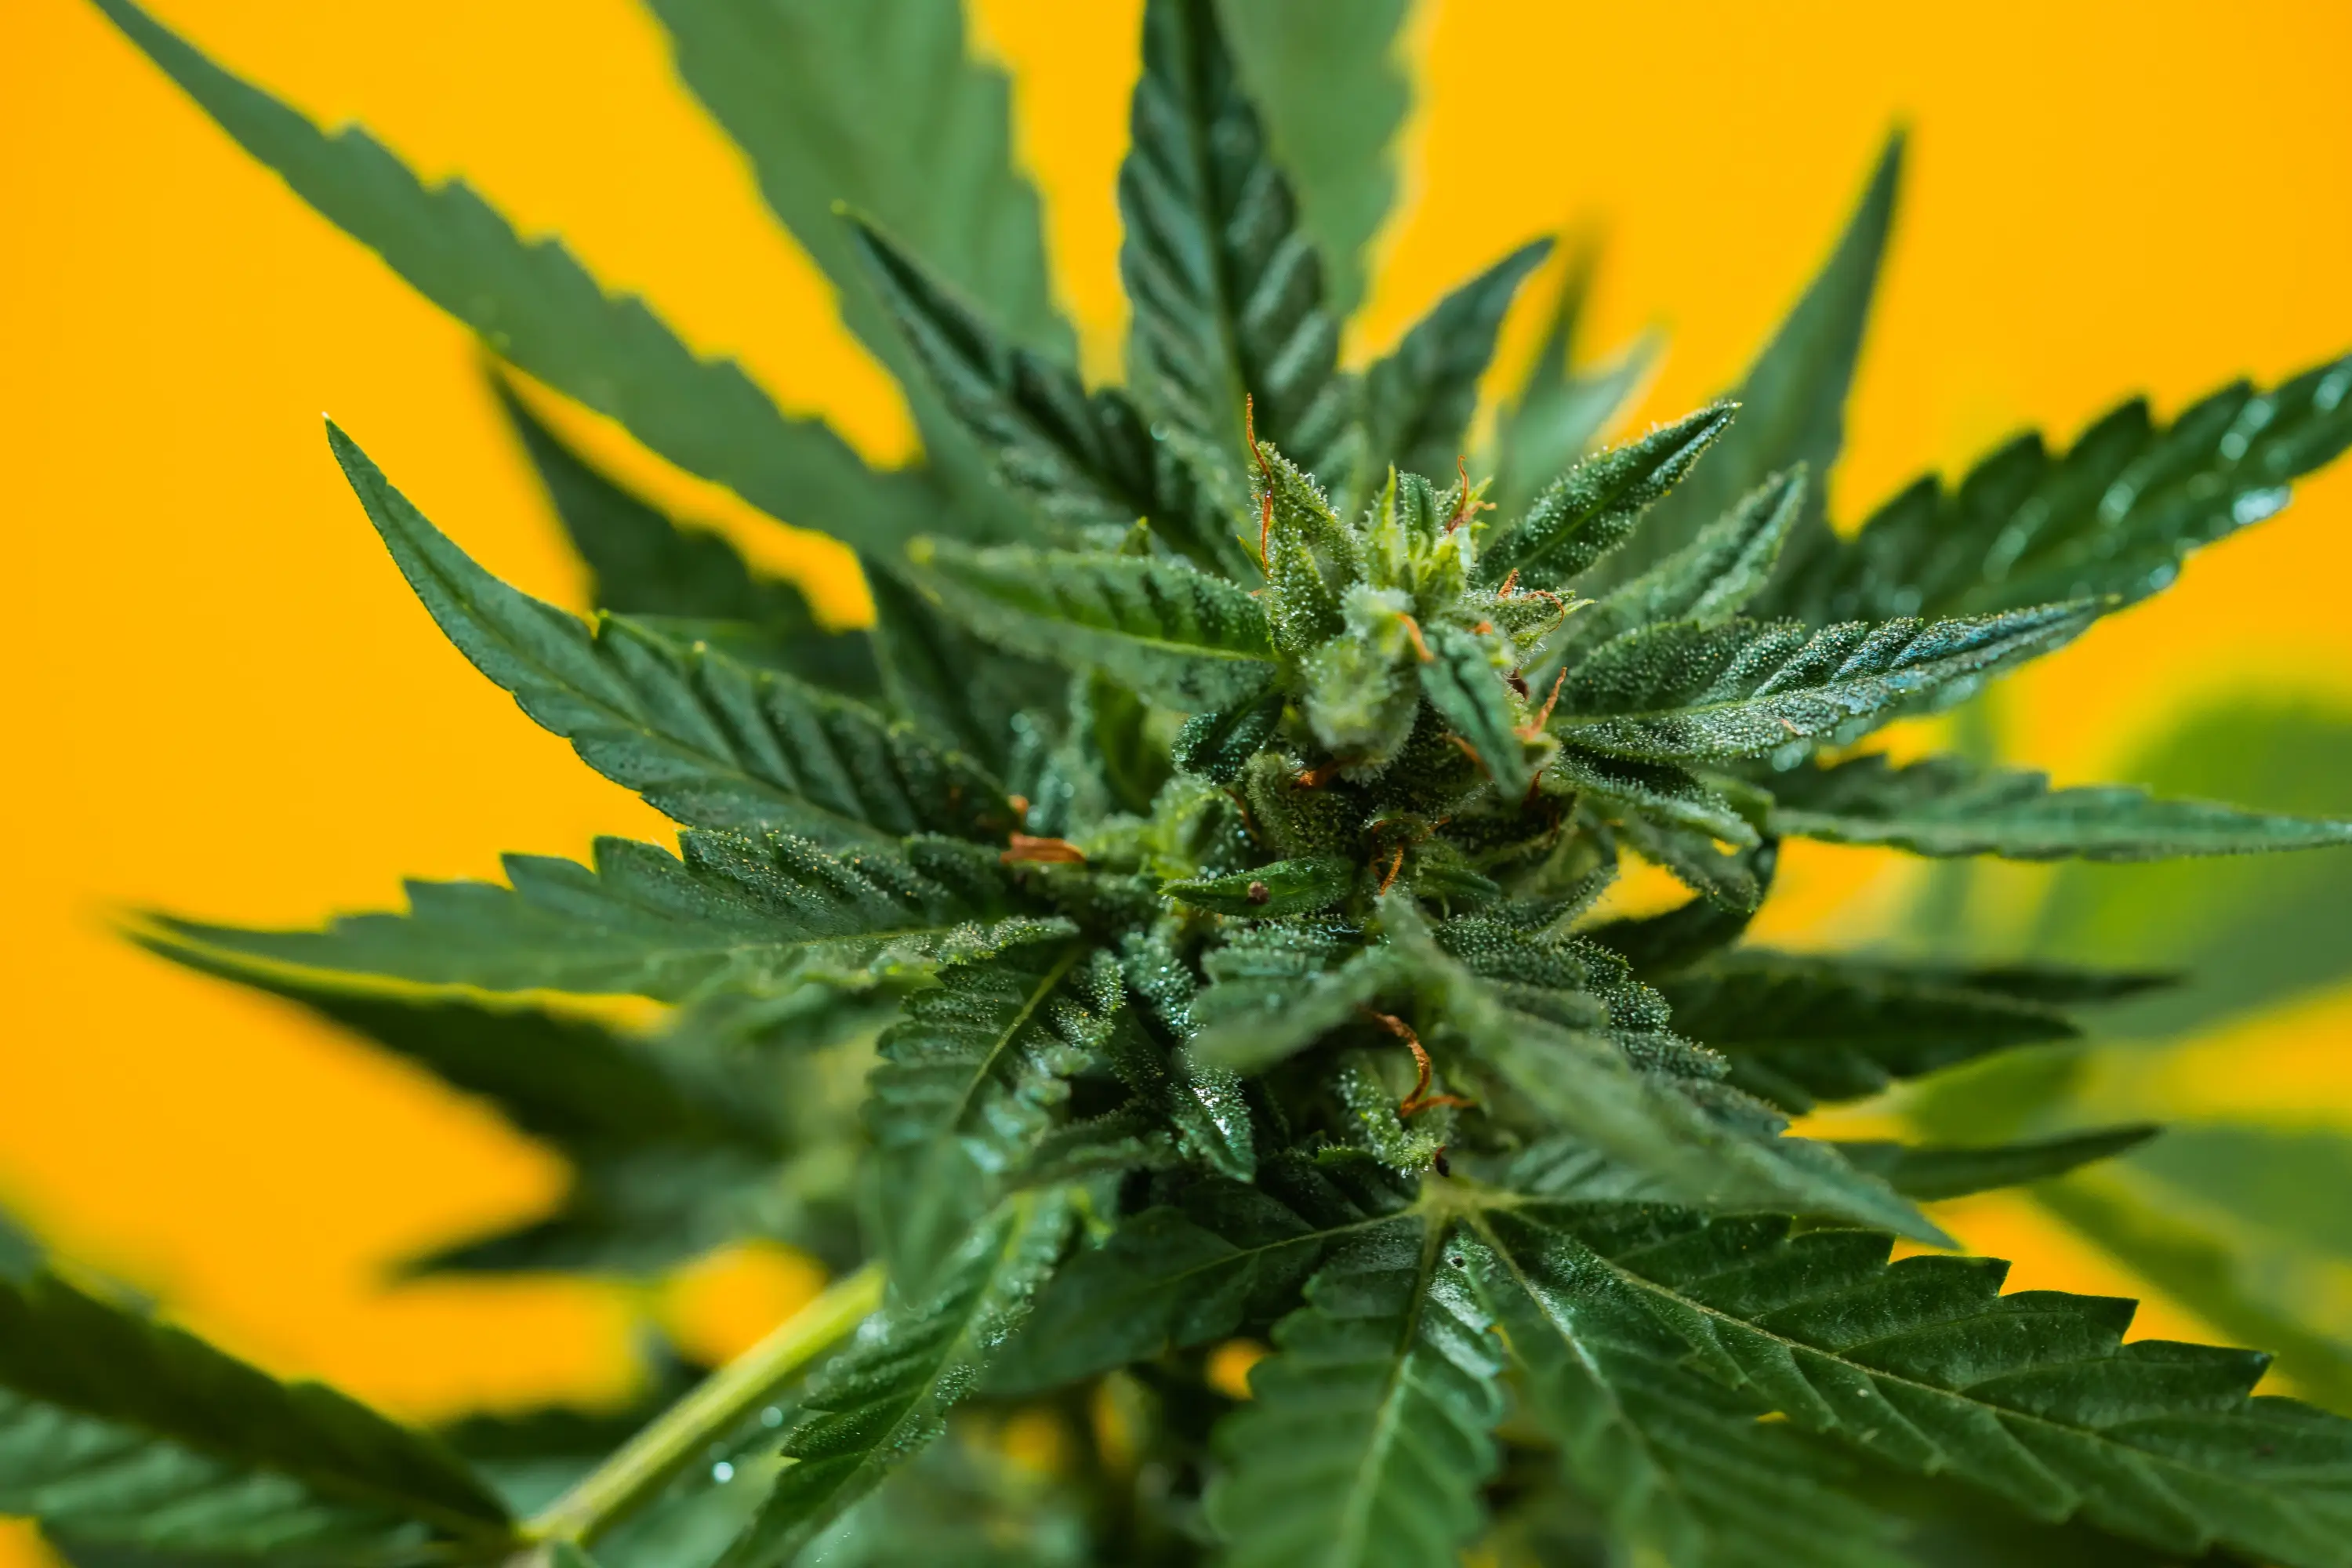
Diagnostic Measurement Sequence: Input, Runoff, and Slurry Testing
Managing root-zone EC requires consistent sampling protocols. Cultivators must execute a three-point diagnostic sequence:
1. Input Fertigation EC Testing
Always measure and log your source water baseline before adding fertilizers. If municipal tap water measures 0.4 mS/cm, adding 1.6 mS/cm of mineral nutrients yields an input reading of 2.0 mS/cm. Temperature compensation is vital: ensure your EC meter features Automatic Temperature Compensation (ATC) calibrated to the international reference temperature of 25 °F (77 °F). For every 1 °C increase in solution temperature, uncompensated electrical conductivity artificially rises by approximately 1.9% to 2.0%.
2. Runoff Leachate EC Monitoring
In inert media (coco, perlite, rockwool), measure leachate from the bottom 15% to 20% drainage runoff:
- Runoff EC Equal to Input EC (±0.2 mS/cm): Perfect equilibrium. Plants are consuming water and nutrients in exact stoichiometric balance. Maintain current feed strength.
- Runoff EC Substantially Lower than Input EC (>0.4 mS/cm drop): Plants are consuming minerals faster than water. Increase input EC by 0.2 to 0.4 mS/cm on the next feeding.
- Runoff EC Significantly Higher than Input EC (>0.6 mS/cm rise): Dangerous salt accumulation. Transpiration is outpacing mineral uptake. Leach the container with a 20% runoff volume of mild nutrient solution (EC 1.0 mS/cm) to flush residual salts out of the rhizosphere.
3. The 1:2 Saturated Media Extract (SME) Slurry Test
When diagnosing container soil or coco coir without collecting runoff, perform a standard 1:2 volume slurry test:
- Extract a 50 mL core sample of root-zone substrate from 2 to 4 inches below the surface.
- Add 100 mL of pure deionized or reverse osmosis water (0.0 mS/cm EC) to a clean glass beaker.
- Mix thoroughly with a clean glass rod and let the slurry equilibrate for 30 minutes.
- Filter the liquid through a coffee filter or fine mesh screen and measure the EC of the extracted liquid. Target SME slurry EC for mature flowering cannabis sits between 1.2 and 1.8 mS/cm.
Fertilizer Types Compared: Dry Salts, Bottled Liquids, and Organics
Different fertilizer chemistries interact differently with electrical conductivity probes:
| Nutrient Methodology | EC Meter Compatibility | Primary Ionic Compounds | Cost per Gallon Mixed | Optimal Application Substrate |
|---|---|---|---|---|
| Technical Dry Mineral Salts | 100% Direct EC Reading: Fully dissociated ions | Calcium Nitrate, Potassium Nitrate, Monopotassium Phosphate | $0.025 to $0.040 | Coco coir, rockwool slabs, flood-and-drain, DWC |
| Bottled Liquid Synthetics | 100% Direct EC Reading: Pre-dissolved mineral salts | Liquid mineral chelates, ammonium phosphate | $0.35 to $0.55 | Hydroponics, amended peat, soilless mixes |
| Amended Organic Super Soil | Poor: Organic molecules lack ionic charge until broken down | Fish meal, alfalfa meal, bat guano, kelp meal, rock dust | $0.00 (Water-only top dress) | Living organic soil beds, large fabric aeration containers (≥15 gal) |
| Liquid Organic Bottled Lines | Deceptive: Reads 40% lower EC than actual biological release | Molasses, hydrolyzed fish proteins, amino acid chelates | $0.45 to $0.75 | Soil and coco mixes with active microbial inoculation |
Systematic Root-Zone Troubleshooting Protocol
When foliar stress occurs, execute this rigorous scientific troubleshooting sequence to identify and correct root-zone anomalies:
- Step 1: Recalibrate Diagnostic Instruments: Never alter your nutrient formula based on a meter that has not been calibrated within 14 days. Test your EC probe in fresh 1.413 mS/cm standard solution; calibrate your pH probe in 7.00 and 4.01 buffers.
- Step 2: Measure Runoff vs Input Delta: Collect and measure runoff leachate EC and pH across multiple containers. If runoff EC is >3.0 mS/cm while input is 1.8 mS/cm, root-zone salt buildup is confirmed.
- Step 3: Alter Exactly One Variable: Never change light intensity, nutrient strength, watering frequency, and pH simultaneously. If runoff EC is high, reduce input feed strength by 30% while maintaining identical watering volume and environmental setpoints.
- Step 4: Allow 72-Hour Biological Recovery: Plant vascular systems require 48 to 72 hours to re-establish cellular turgor and metabolic homeostasis. Observe new vegetative meristem growth; damaged older leaves will never recover green pigmentation.
Evidence Check: Plant Nutrition Science vs Feeding Folklore
Controlled academic research from Utah State University (Dr. Bruce Bugbee) and the University of Guelph has demystified long-standing grower folklore:
- Myth: “Plants Require Extreme EC (>3.0 mS/cm) to Produce Dense Flowers”: University trials demonstrate that cannabis photosynthetic rate plateaus at approximately 2.0 to 2.4 mS/cm EC under standard indoor light levels. Forcing EC to 3.2 mS/cm increases leaf tip necrosis, reduces secondary metabolite synthesis, and wastes expensive fertilizer without increasing dry flower yield.
- Myth: “Organic Nutrients Do Not Cause Nutrient Burn”: Organic compounds break down into identical inorganic mineral ions (NH4+, NO3–, K+). Excess organic meals release high concentrations of ammonium and potassium that create identical osmotic drought stress and salt burn as synthetic salts.
Comprehensive Topic Deep Dives: EC, PPM, and Calibration SOP
To cover all educational dimensions of electrical conductivity without splintering information across multiple standalone URLs, we provide exhaustive technical deep dives into the five primary focus topics below:
1. How to Calibrate and Test an EC Meter
A conductivity meter requires routine calibration to account for electrode oxidation, surface fouling, and electronic drift. Follow this clinical calibration standard operating procedure (SOP):
- Clean Electrodes: Soak the probe tip in 70% isopropyl alcohol for 5 minutes. Use a soft-bristle nylon brush or microfiber cloth to remove oil films and dried mineral scale from the two metal pins. Rinse thoroughly with pure reverse osmosis or deionized water.
- Use Fresh 1.413 mS/cm Calibration Standard: Never dip your probe directly into the master calibration bottle; dipping contaminates the entire bottle. Pour 25 mL of unexpired 1.413 mS/cm (1,413 μS/cm) potassium chloride (KCl) reference standard into a clean plastic cup.
- Temperature Thermal Equilibration: Submerge the probe in the solution and stir gently for 30 seconds to release trapped air bubbles from the electrode surface. Wait 60 seconds for the meter’s internal thermistor to match standard temperature (25 °C / 77 °F).
- Lock Calibration: Press the CAL button. The meter should display 1.41 mS/cm (or 707 PPM on 500 scale / 990 PPM on 700 scale). Discard used calibration fluid.
2. EC vs PPM for Cannabis Growers
The debate between Electrical Conductivity (EC) and Parts Per Million (PPM) is fundamentally a choice between true scientific measurement and estimated conversion. An EC meter measures physical electrical resistance across a 1 cm path of fluid. It does not measure the actual weight of dissolved solids.
PPM was developed for water treatment plants assessing drinking water purity. Because an electrical meter cannot weigh individual ions in solution, it multiplies EC by an estimated mathematical curve. Because cannabis nutrient solutions contain diverse ionic species with varying mobility and molecular weights, PPM is inherently inaccurate. Managing your crop in EC provides absolute clarity regardless of equipment brand or geographic location.
3. EC, TDS, and PPM Explained for Growers
To understand the relationship between these three acronyms, consider their physical definitions:
- EC (Electrical Conductivity): The physical measure of solution conductance, reported in mS/cm. This is the direct sensor reading.
- TDS (Total Dissolved Solids): The mass ratio of dissolved minerals relative to total water volume, expressed in milligrams per liter (mg/L) or parts per million (PPM), where 1 mg/L = 1 PPM. True laboratory TDS requires evaporating a water sample in an oven and weighing the dry mineral residue on an analytical balance.
- PPM (Parts Per Million): An electronic estimate of TDS generated by multiplying EC by 500, 640, or 700.
4. 500 Scale vs 700 Scale PPM Conversion
The confusion between conversion scales originates from different benchmark salt solutions:
- The 500 Scale (TDS / Hanna / USA): Based on a potassium chloride (KCl) reference standard. Formula:
PPM500 = EC (mS/cm) × 500
. At 1.0 mS/cm EC, the display reads 500 PPM.
- The 700 Scale (Truncheon / Bluelab / UK / Australia): Based on a sodium chloride (NaCl) reference standard. Formula:
PPM700 = EC (mS/cm) × 700
. At 1.0 mS/cm EC, the display reads 700 PPM.
- The 640 Scale (Eutech / European): Based on a 442 “natural water” mix (40% sodium sulfate, 40% sodium bicarbonate, 20% sodium chloride). Formula:
PPM640 = EC (mS/cm) × 640
.
To convert from one scale to another:
PPM700 = PPM500 × 1.40
and
PPM500 = PPM700 div 1.40
.
5. What Is EC and PPM in Cannabis Growing?
In practical day-to-day cultivation, EC and PPM serve as your “fuel gauge” for plant nutrition. Just as a vehicle engine demands more fuel during heavy acceleration, a cannabis canopy demands higher electrical conductivity during rapid floral expansion (weeks 3 to 6 of flowering). Monitoring EC ensures that your nutrient solution delivers sufficient macronutrients (N, P, K, Ca, Mg) to support rapid biomass synthesis without exceeding the root zone’s osmotic threshold.
6. Electrode Geometry, Cell Constant (K), and Probe Longevity
Every commercial electrical conductivity probe operates based on a specific physical geometry known as the cell constant (K), defined mathematically by the distance between electrodes divided by effective surface area:
K = (d / A)
Where d is the physical gap separating conducting pins (in cm) and A is the exposed electrode area (in ext{cm}2). Agricultural hydroponic probes are manufactured with a standardized cell constant of K = 1.0 cm-1, balancing dynamic range and measurement sensitivity between 0.1 and 5.0 mS/cm. In contrast, ultra-pure water laboratory sensors use K = 0.1 cm-1, while high-salinity industrial probes use K = 10.0 cm-1.
During active crop cycles, organic biofilms, precipitated calcium sulfate, and humic coatings attach to platinum or graphite electrode surfaces. This contamination alters effective surface area A, shifting the probe’s calibrated cell constant and causing severe measurement depression. Cultivators observing gradual EC drift must perform ultrasonic or solvent cleaning to restore baseline geometry before attempting electronic recalibration.
Question: My municipal tap water reads 0.5 mS/cm EC straight out of the faucet. When my feeding chart calls for 1.8 mS/cm, should I feed 1.8 total, or 1.8 plus the 0.5 tap water (2.3 total)?
You must feed 1.8 mS/cm total EC, never 2.3 mS/cm. The plant root system cannot distinguish whether dissolved ions are beneficial plant nutrients or municipal calcium carbonate and sodium chloride; roots experience total osmotic pressure (Pi). If you add 1.8 mS/cm of fertilizer on top of 0.5 mS/cm hard tap water, your roots experience 2.3 mS/cm of osmotic resistance, which frequently triggers leaf tip burn and calcium-magnesium lockout in young plants.
Furthermore, because your tap water already contains high background calcium and bicarbonate, subtract approximately 100 PPM of calcium from your fertilizer regimen or invest in a reverse osmosis (RO) system to strip tap water down to 0.0 mS/cm, giving you 100% control over elemental nutrition.

Final Decision Checklist and Next Weedth Resources
Execute this practical checklist across every fertigation cycle to ensure your nutritional management delivers maximum genetic expression without salt stress.
Scientific References
- Zheng, Y. (Ed.). (2021). Handbook of Cannabis Production in Controlled Environments. CRC Press, Boca Raton, FL.
- Bugbee, B. (2004). Nutrient management in recirculating hydroponic culture. Acta Horticulturae, 648, 99-112.
- Marschner, P. (2012). Marschner’s Mineral Nutrition of Higher Plants (3rd ed.). Academic Press, London, UK.
- Sonneveld, C., & Voogt, W. (2009). Plant Nutrition of Greenhouse Crops. Springer, Dordrecht, Netherlands.
- Taiz, L., Zeiger, E., Møller, I. M., & Murphy, A. (2018). Plant Physiology and Development (6th ed.). Sinauer Associates, Sunderland, MA.
- Bryson, G. M., & Barker, A. V. (2014). Plant Analysis Handbook IV. Micro-Macro Publishing, Athens, GA.
Share this article
A quick overview of the topics covered in this article.