Cannabis Grow Light Metrics: PAR, PPF, PPFD, DLI, PPE, Lux, and Lumens
Grow light specifications become much easier to read once every number is assigned to the question it actually answers. PAR describes a conventional waveband. PPF describes total photon output. PPFD describes photon flux arriving at a surface. DLI adds that incoming photon flux across the day. PPE compares photon output with electrical input. Lumens and lux describe light through the weighting of human vision. They are related, but they are not interchangeable.
The most common lighting mistakes happen when one metric is asked to do another metric’s job. A high PPF does not prove that a canopy is evenly lit. A high center PPFD does not describe the whole grow area. A strong PPE number does not prove that a fixture delivers useful coverage. A large lumen value does not tell you how many photosynthetic photons reach cannabis leaves. Wattage tells you electrical input, not plant-light delivery.
This resource turns those numbers into a practical chain. Start with the fixture’s electrical input and tested output. Check where the photons actually land. Add time to calculate the daily dose. Then compare efficiency, uniformity, spectrum, heat, and crop response before deciding whether the lighting system is doing what you need.
The article deliberately stays separate from stage-specific target setting. Seedling, clone, vegetative, and flowering PPFD/DLI targets belong in the dedicated stage resource. Detailed DLI calculation and variable-light integration belong in the dedicated DLI procedure. Here, the goal is to understand the metrics themselves and use the right metric for buying, setup, verification, and troubleshooting.
PAR: Know the Waveband Before You Read the Numbers
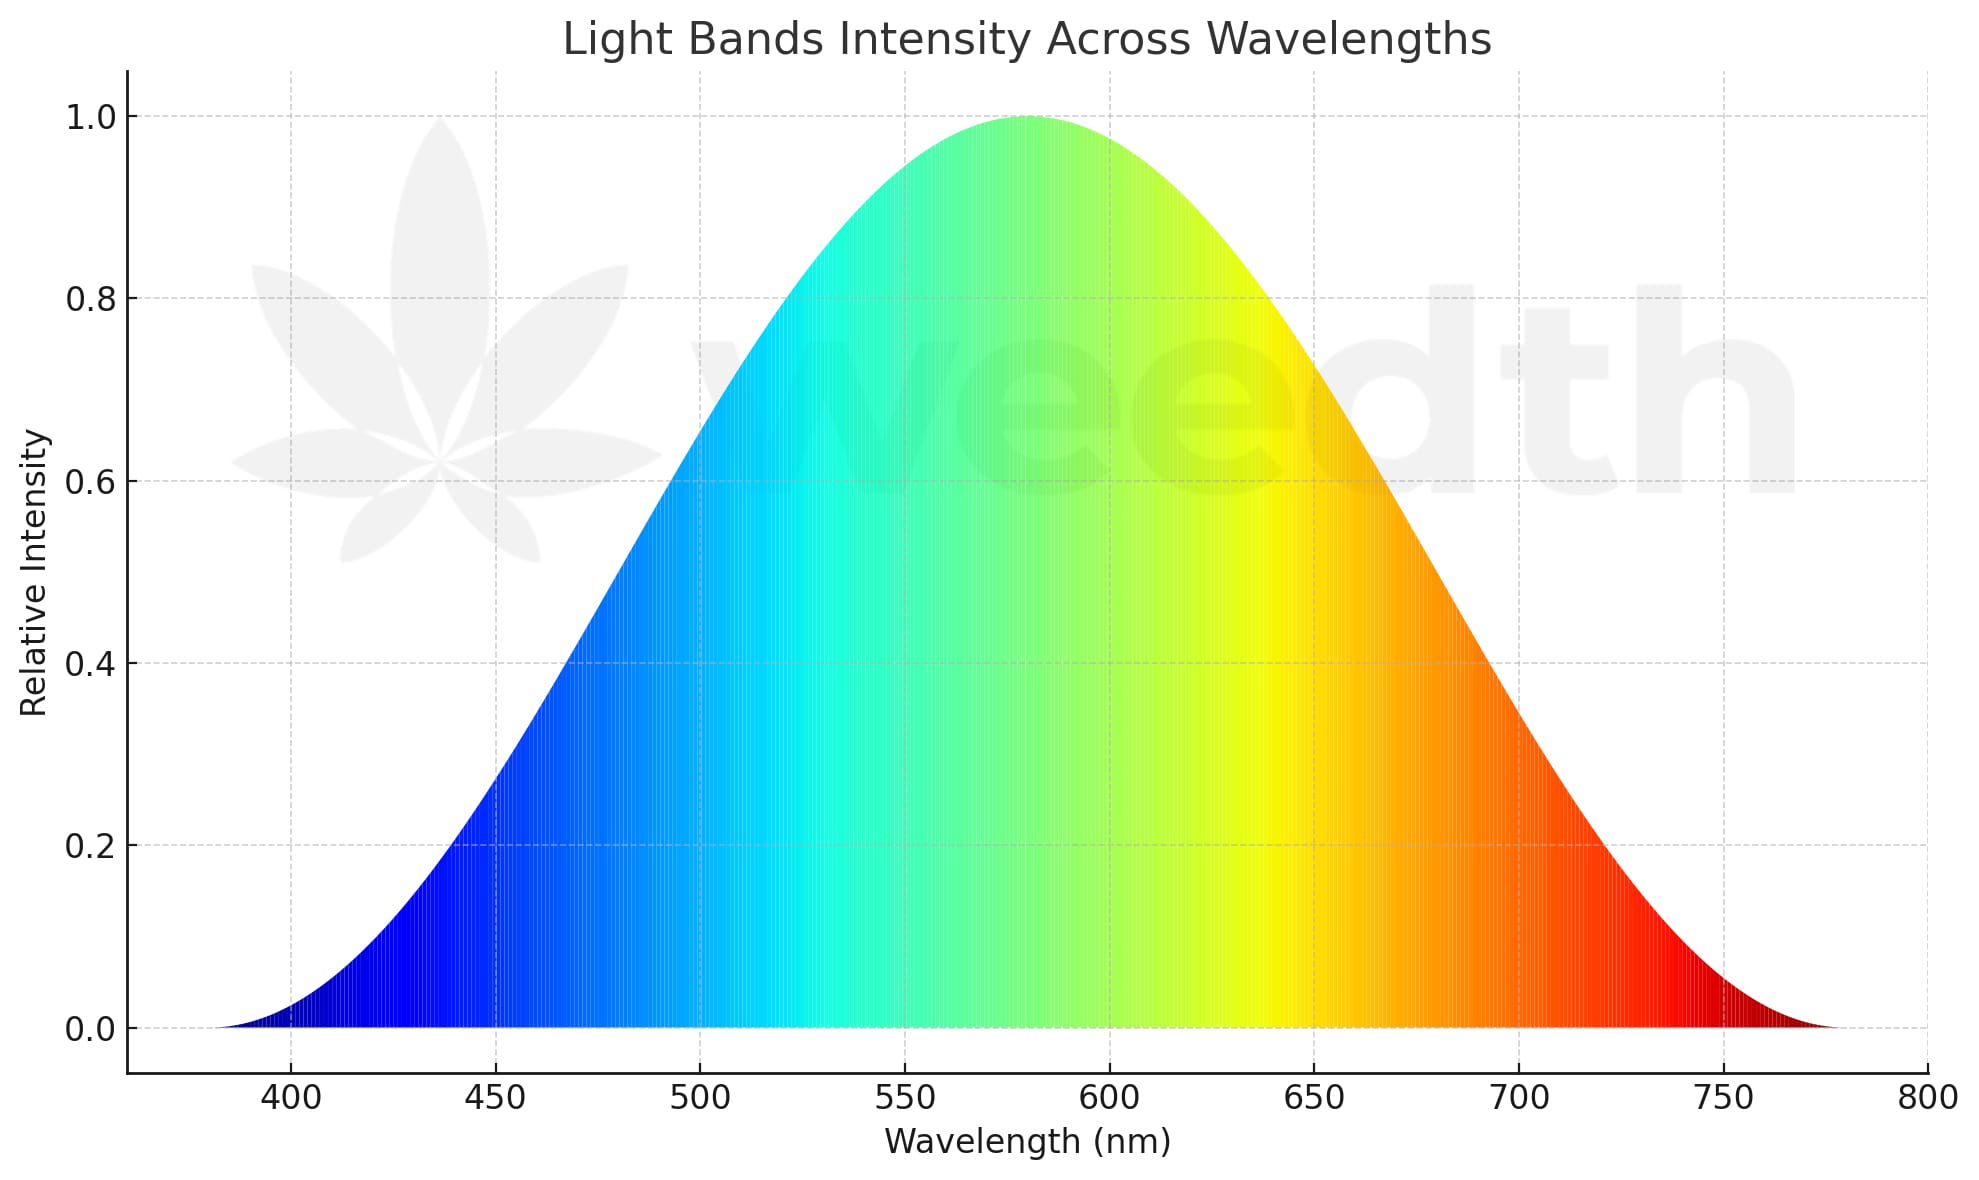
PAR stands for photosynthetically active radiation. In conventional horticultural measurement, PAR refers to the 400-700 nm waveband. It does not tell you how much light a fixture produces, how much reaches the canopy, how evenly the light is distributed, or how efficiently electricity is converted into photons. PAR is the spectral boundary inside which common PPF and PPFD metrics are counted.
Photosynthetically Active Radiation
PAR is the conventional 400-700 nm waveband used for photosynthetic photon measurements in horticulture. When a specification reports PPF, PPFD, or PPE without another waveband being stated, check the test method and confirm whether the value is based on this conventional range.
What Is Photosynthetically Active Radiation?
PAR is often described casually as “light plants can use,” but that phrase is too broad if taken literally. Plants respond to radiation outside 400-700 nm as well. Ultraviolet wavelengths can affect morphology and chemistry. Far-red radiation can influence shade responses, leaf expansion, flowering behavior, and photosynthesis when combined with shorter wavelengths. The conventional PAR range remains useful because it gives growers and lighting manufacturers a common measurement language.
It is better to think of PAR as a standardized counting window than as a complete border between useful and useless plant radiation. That distinction prevents a grower from assuming that photons at 699 nm are biologically meaningful while photons at 701 nm suddenly have no effect.
PAR is a waveband, not an intensity number
One of the most persistent lighting mistakes is saying that a fixture “has 900 PAR.” The intended value is usually 900 µmol/m²/s PPFD. PAR itself is not the canopy intensity number. A quantum meter placed under a grow light usually reports PPFD within the PAR waveband, so people sometimes call the reading a “PAR reading.” The shorthand is common, but the actual measured quantity matters.
| Term | What it actually describes | Typical unit | What it does not answer |
|---|---|---|---|
| PAR | Conventional photosynthetic waveband | Usually specified as 400-700 nm | How much light reaches the canopy |
| PPF | Total photosynthetic photon output rate | µmol/s | Where those photons land |
| PPFD | Photosynthetic photon flux per area at a surface | µmol/m²/s | Daily photon dose |
| DLI | Daily integrated photosynthetic photon dose | mol/m²/day | Spectrum or uniformity by itself |
| PPE | Photosynthetic photon output per electrical joule | µmol/J | Canopy coverage or crop efficiency |
Photon quantities and energy quantities are not the same thing
Light can be described as radiant energy or as photons. Those are related descriptions, but they do not produce the same metric. A photon at a shorter wavelength carries more energy than a photon at a longer wavelength. Conventional PPF and PPFD deliberately count photons because photosynthetic chemistry is driven by photon absorption rather than by treating every optical joule as biologically equivalent.
This helps explain why electrical watts, optical watts, and micromoles of photons should not be mixed casually. A fixture can consume 500 electrical watts, emit some fraction of that energy as optical radiation, and produce a PPF that depends on both the amount of optical output and its wavelength distribution. The conversion from optical watts to photon flux changes with spectrum because photon energy changes with wavelength.
For growers, the practical lesson is simple: use electrical watts for power and heat planning. Use PPF and PPE for fixture photon output. Use PPFD for canopy delivery. Do not try to infer all four from one number.
Why one micromole is such a large number of photons
A mole is a counting unit. One mole contains approximately 6.022 × 10²³ entities. A micromole is one millionth of that amount, so one micromole still represents about 6.022 × 10¹⁷ photons. When a canopy receives 800 µmol/m²/s, the number may look small only because micromoles are a compact way to describe an enormous photon flow.
This is also why PPFD values are not percentages. A reading of 800 µmol/m²/s is a physical photon-flux density. It is not “80 percent light” and it cannot be compared directly with a dimmer percentage unless that dimmer has been mapped to actual fixture output.
Conventional PAR does not weight every wavelength by plant response
Conventional PPF and PPFD count photons within the chosen 400-700 nm range rather than assigning a different value to every wavelength according to a cannabis action spectrum. A blue photon and a red photon are each counted as one photon in PPF or PPFD if they fall inside the defined range. That does not mean blue, green, and red photons always produce identical morphology, penetration, photoreceptor signaling, or crop response.
This is why a PPFD value should be paired with the fixture’s spectral distribution when spectrum is part of the decision. Two fixtures can deliver the same PPFD while presenting different blue fractions, green fractions, red fractions, and radiation outside the conventional PAR range.
Remember: PPFD is a photon quantity metric, not a full spectral description. If two fixtures have the same PPFD, you still need the spectrum and distribution data before assuming the plants experience the same light environment.
Where ePAR fits into the conversation
Research has strengthened the case that far-red photons between roughly 700 and 750 nm can contribute to canopy photosynthesis when supplied with photons in the traditional PAR range. This has led to the term extended PAR, or ePAR, commonly referring to 400-750 nm in the research discussion.
That does not mean every published PPFD or PPE number now includes far-red. Conventional horticultural fixture reporting still commonly uses 400-700 nm PPF and PPE. If one manufacturer reports a 400-700 nm value and another reports an extended photon metric, those numbers should not be compared as if their counting windows were identical.
Always check the wavelength basis
A fixture that emits meaningful far-red can look less efficient under a 400-700 nm PPE metric because the photons beyond 700 nm are not counted in conventional PPF. Do not solve this by silently mixing conventional PPF with ePPF. Label the waveband and compare like with like.
PAR does not replace spectral data
A fixture can technically emit strongly inside 400-700 nm and still have a spectrum that behaves differently from another fixture with the same total photon output. For cannabis growers, spectral distribution matters most when comparing morphology, fixture design, cultivar response, or supplemental channels such as UV and far-red. For basic photon budgeting, conventional PPF, PPFD, and DLI remain useful because they provide a consistent accounting framework.
PPF: Read Total Fixture Photon Output Correctly
Photosynthetic photon flux, or PPF, describes the total rate at which a light source emits photons inside the conventional photosynthetic waveband. Its unit is µmol/s. PPF is the closest horticultural equivalent to asking, “How large is the fixture’s total photon engine?” It is useful for comparing total output, but it says nothing about how that output is distributed across your canopy.
The four metrics form a useful chain. PPF starts at the fixture. PPFD moves to the receiving surface. DLI adds time. PPE brings electrical input into the fixture-output comparison.
| Question | Metric | Why |
|---|---|---|
| How many conventional PAR photons leave the fixture each second? | PPF | Total output rate in µmol/s |
| How many reach this square meter of canopy each second? | PPFD | Delivery rate per unit area |
| How many reach that area over the whole day? | DLI | Time-integrated daily dose |
| How many photons are produced per joule of electrical input? | PPE | Fixture photon efficacy |
PPF is output, not coverage
A 2,000 µmol/s fixture does not automatically produce 1,000 µmol/m²/s across a two-square-meter canopy. Some photons miss the occupied area. Some strike walls, aisles, fixtures, pots, or nonproductive surfaces. The beam pattern may create a strong center and weak edges. Reflective surfaces may return part of the light. Multiple fixtures may overlap.
PPF therefore helps with system sizing and fixture comparison, but the canopy still needs a PPFD map. Treating PPF as coverage is similar to knowing how much water a pump can move without knowing where the irrigation emitters deliver it.
How fixture testing produces a more useful PPF number
Credible fixture specifications should be based on standardized optical and electrical testing rather than a sum of nominal diode ratings. Horticultural lighting programs use laboratory measurements that characterize total spectral output and angular distribution. This matters because the installed fixture includes the driver, thermal conditions, optics, and real operating state.
If a product advertises only “equivalent wattage” or an unqualified brightness claim while withholding tested input power, PPF, spectrum, and PPFD distribution, the specification is incomplete for serious plant-light planning.
Field Advice: When comparing fixtures, record input watts, tested PPF, PPE, spectrum, dimmer state, tested hanging height, and the PPFD map together. A single headline number is easy to market and easy to misuse.
PPF can be calculated from PPE and input power when both are trustworthy
PPE has units of µmol/J. A watt is one joule per second. That makes the relationship straightforward:
PPF = input power × PPE
If a fixture draws 720 W at the tested state and the reported PPE is 2.8 µmol/J, the corresponding PPF is 2,016 µmol/s. The calculation is useful as a cross-check, but only when the PPE and wattage describe the same fixture configuration and operating state. A dimmed wattage paired with full-power PPE, or a spectrum-adjusted channel paired with another test state, can produce a misleading result.
PPF maintenance matters after the fixture is no longer new
A new-fixture PPF specification describes output at a defined test state. Real fixtures age. Diodes, optics, drivers, thermal interfaces, dust, and contamination can change output over time. Professional horticultural lighting programs therefore treat photon-flux maintenance as a separate performance topic rather than assuming that day-one PPF lasts forever.
For a home or small commercial grow, you do not need laboratory aging equipment to use the concept. Save the original input-power reading and a repeatable canopy PPFD map. Recheck both periodically. If power draw stays similar while the entire map falls, output depreciation or optical contamination becomes more plausible. If one zone falls while others remain stable, inspect layout, driver channels, bars, connectors, and obstruction before blaming overall fixture aging.
Nominal diode efficacy is not fixture PPE
Diode manufacturers may publish highly efficient component values under specific laboratory currents and temperatures. A finished grow light includes many additional realities: drive current, junction temperature, driver losses, wiring, optical losses, mechanical design, and sometimes protective covers. The fixture-level PPE is the number that belongs in room planning.
This is another reason to prefer standardized fixture test data over marketing claims built by multiplying diode counts by component specifications. The installed crop does not operate individual diodes on a datasheet. It operates the complete fixture.
Why PPF cannot tell you the safe hanging height
Hanging height changes the distribution of photons across the measurement plane. Moving a fixture closer usually raises peak PPFD and often worsens uniformity across a fixed footprint. Moving it farther away can reduce the center peak and improve spread, but more photons may escape the intended area. Optics, fixture dimensions, bar spacing, wall reflectance, and neighboring fixtures all change the result.
That means there is no equation that converts fixture PPF into a universally safe cannabis hanging distance. Use the manufacturer’s tested distribution data as a starting point and verify the real canopy with a suitable sensor.
“My new fixture has much higher PPF. Can I assume it covers a larger tent?”
Question sent by: Ethan Brooks, via email.
No. Higher PPF means more total counted photons leave the fixture. Coverage depends on distribution, mounting height, footprint, overlap, and the PPFD level you are trying to maintain. Compare full PPFD maps at the intended hanging height instead of assigning square footage from PPF alone.
PPF is useful for photon budgeting across multiple fixtures
When several fixtures are installed in one room, their total PPF gives a first estimate of the available photon supply. For example, four fixtures rated at 1,500 µmol/s provide 6,000 µmol/s of emitted PPF in total. That still does not mean the canopy receives all 6,000 µmol/s. Layout and losses determine how much of that output reaches the productive plane.
This distinction becomes useful when a room has enough total fixture output but still shows weak edge PPFD. The problem may be distribution rather than a shortage of total PPF.
PPFD: Measure What Actually Reaches the Cannabis Canopy
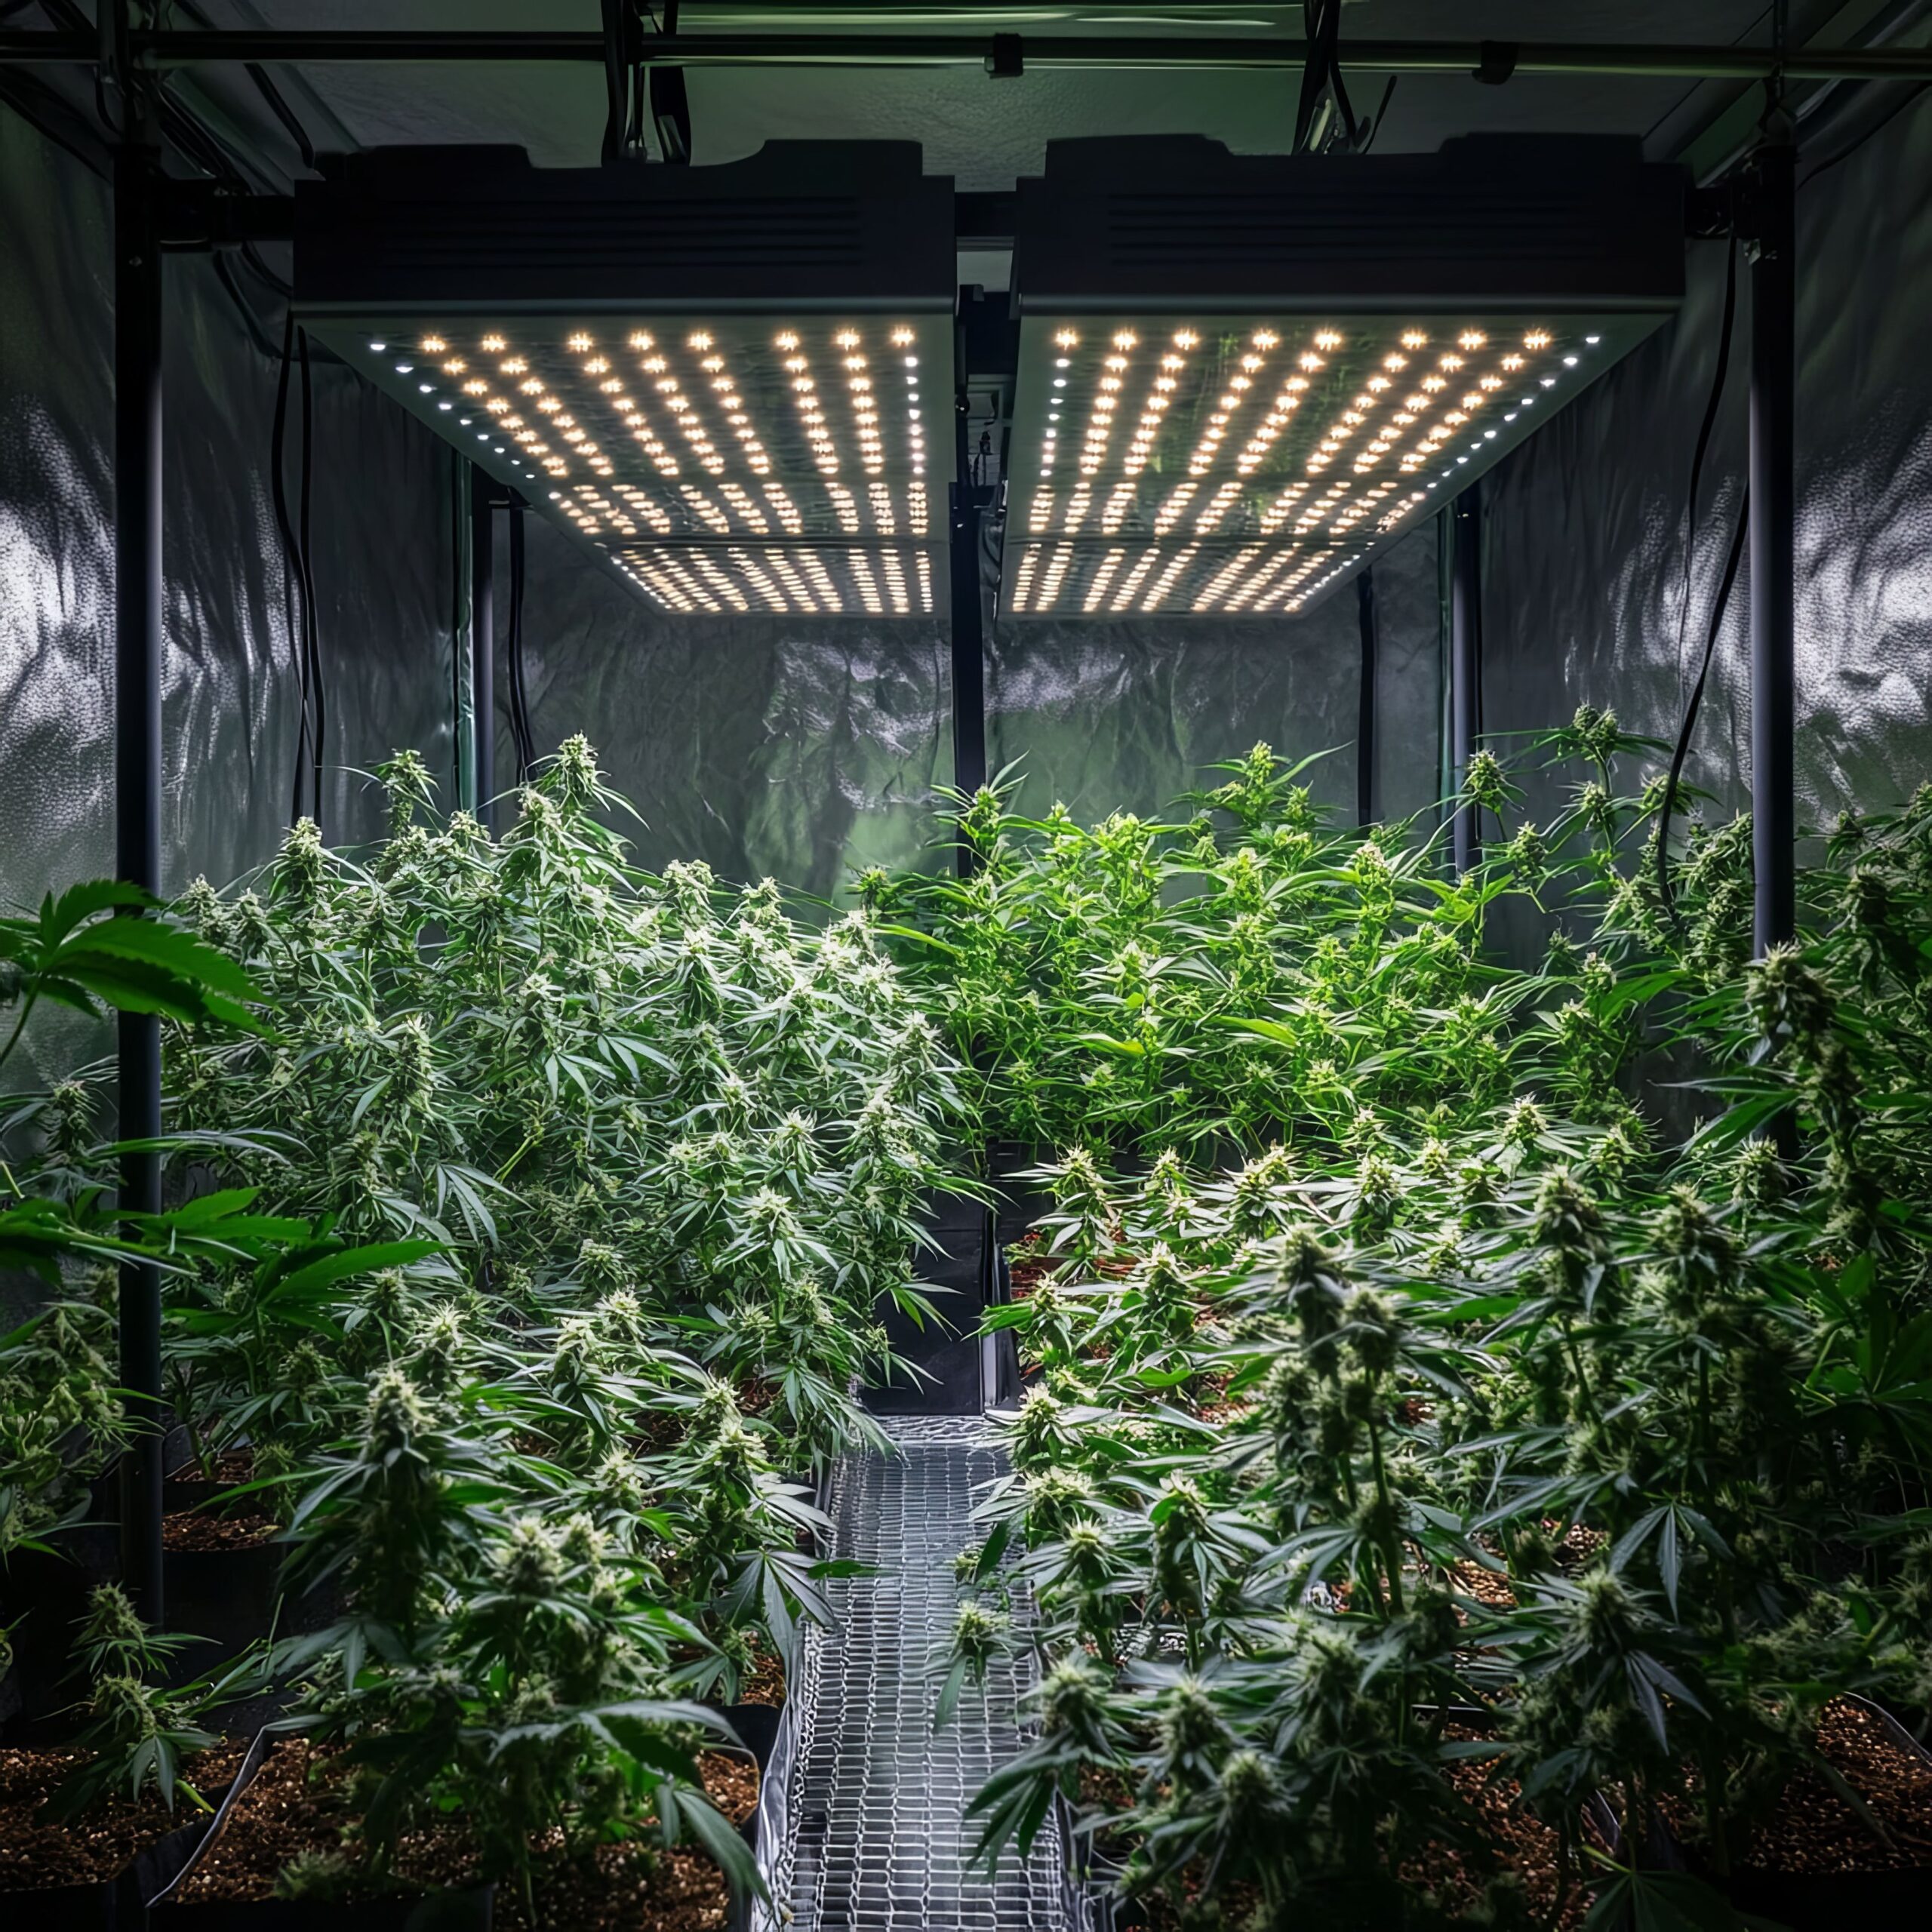
Photosynthetic photon flux density, or PPFD, describes the rate of conventional PAR photons incident on a surface per unit area. The standard unit is µmol/m²/s. For day-to-day grow-room decisions, PPFD is usually more actionable than PPF because it tells you what arrives where the leaves actually are.
PAR defines the counting window. PPF tells you total emitted photons in that window. PPFD tells you how concentrated those photons are at a location. DLI tells you how many accumulate over time. This hierarchy is worth memorizing because nearly every grow-light specification can be checked against it.
PPFD is a spatial measurement
A canopy is not one point. If the center measures 1,150 µmol/m²/s while the corners measure 650, the room does not have “1,150 PPFD.” It has a distribution. The correct summary should include at least the measurement height, grid size, minimum, average, maximum, fixture setting, and footprint.
Uniformity matters because plants at different locations can receive meaningfully different photon doses even though they share the same timer and nutrient reservoir. A room with a moderate average but weak corners may produce less consistent morphology and flower development than a room with the same average and tighter distribution.
| PPFD value | What it reveals | What it can hide |
|---|---|---|
| Center | Peak or near-peak condition under many fixtures | Weak edges and corners |
| Average | Overall photon rate across the sampled plane | Hotspots and low points |
| Minimum | Weakest sampled zone | How widespread the weak zone is |
| Maximum | Strongest sampled zone | Whether it represents meaningful canopy area |
| Min ÷ average | Simple uniformity indicator | Full spatial pattern |
Measure at the actual canopy plane
A PPFD map measured 30 cm below the fixture and a map measured 60 cm below it are different lighting systems from the canopy’s point of view. Record the distance between the light-emitting plane and the measurement plane. When the canopy rises, training changes, or the fixture height changes, repeat the map.
Keep the sensor level unless you are intentionally measuring a differently oriented leaf surface. Do not shade the sensor with your hand or body. Keep the diffuser clean. Allow the fixture to reach normal operating conditions. Use the same grid when comparing before and after adjustments so the change is real rather than a sampling artifact.
Build a repeatable canopy map
Use fixed grid points, the real fixture setting, the real canopy height, and the same sensor orientation. Record minimum, average, and maximum PPFD.
Chasing one impressive center reading
A single hotspot can make a fixture look stronger while telling you almost nothing about edge delivery, usable footprint, or daily uniformity.
Average PPFD should represent area, not just a convenient set of points
A simple arithmetic mean is reasonable when measurement points represent equal areas of a rectangular canopy. Problems appear when a grid is irregular or when many readings are clustered in the center while large edge areas receive only one point. In those cases, an unweighted average can make the canopy look brighter than it really is.
Use a regular grid whenever possible. If the geometry is irregular, use area-weighted sampling or divide the canopy into zones. Record the occupied plant area rather than including empty aisles when the purpose is crop exposure. Conversely, include edge plants if they are part of the productive footprint. The sampling boundary should match the question.
Uniformity is not just a cosmetic statistic
Two rooms can share the same average PPFD while one has tight distribution and the other has a severe hotspot. The second room forces a compromise: set the dimmer for the center and starve the edges, or set it for the edges and overdrive the center. Better uniformity increases the useful operating range because more of the canopy can live near the intended condition at the same time.
Common summary metrics include minimum divided by average and minimum divided by maximum. Different industries and software may use different uniformity definitions, so always state the formula rather than reporting a bare “90 percent uniformity” claim. A map is more informative than one uniformity number because it shows where the weak and strong zones actually occur.
Three-dimensional cannabis canopies complicate a flat PPFD map
Most fixture maps are measured on a horizontal plane, while cannabis leaves and flowers occupy depth. A flat map remains useful because it gives a repeatable reference at the top canopy, but it cannot describe every photon received deeper in the plant. Training style, leaf angle, internode length, defoliation, interlighting, and fixture geometry affect how light penetrates below the top layer.
Do not solve this by pointing the quantum sensor in random directions and averaging the readings. Define the measurement plane and purpose first. Top-canopy PPFD is the standard planning reference. Under-canopy or side-light measurements can be added as separate diagnostics when the system uses interlighting or when penetration itself is the question.
Quantum sensors are designed for PPFD, but sensor quality still matters
A quantum sensor attempts to count photons across the defined waveband with an appropriate spectral response and cosine response. No field sensor is perfect. Spectral mismatch, cosine error, temperature response, calibration drift, and poor positioning can all affect the result.
This matters most when comparing very different spectra. An older sensor calibrated mainly for sunlight may respond poorly to narrow red or blue LED channels. A credible instrument should state its spectral response, calibration uncertainty, directional response, measurement range, and intended light sources.
Manufacturer PPFD maps are useful only when the test conditions match the comparison
A PPFD map without a stated hanging height, footprint, fixture power, and environment is hard to interpret. Reflective test tents can produce different edge readings than an open room. Multiple-fixture layouts can create overlap that a single-fixture map cannot predict. A map at full power cannot describe a heavily dimmed flowering or propagation setting unless the fixture’s dimming behavior is known.
Use manufacturer maps to shortlist fixtures and set an initial installation. Then verify the installed canopy. The final room is the measurement that matters.
Pro Tip: Save a baseline PPFD map when a new fixture is installed. Repeating the same grid later can reveal output decline, a driver problem, height drift, or a layout change long before the fixture looks dim to your eyes.
PPFD does not tell you leaf temperature or heat load
Two fixtures can produce similar canopy PPFD while creating different radiant and convective heat conditions. PPFD counts photons in a waveband. It is not a thermometer. Always interpret high PPFD with leaf temperature, air temperature, humidity, airflow, CO₂ strategy, root-zone water supply, and plant response.
DLI: Add PPFD and Photoperiod Into a Daily Photon Dose
Daily light integral, or DLI, converts a PPFD schedule into the total conventional photosynthetic photon dose received per square meter per day. The unit is mol/m²/day. For stable electric lighting, the calculation is:
DLI = PPFD × light hours × 0.0036
PPFD is an instantaneous rate. DLI is the daily accumulation. At the same PPFD, a longer photoperiod delivers a larger DLI. At the same photoperiod, a higher PPFD delivers a larger DLI. This is why a timer change can alter the daily photon dose even if the dimmer never moves.
For example, 600 µmol/m²/s for 12 hours equals 25.92 mol/m²/day. The same 600 µmol/m²/s for 18 hours equals 38.88 mol/m²/day. The canopy sees the same instantaneous photon rate while the daily total changes by 50 percent.
DLI is not a universal cannabis target
DLI is a measurement framework. It does not become a crop recommendation until stage, cultivar, PPFD, photoperiod, environment, and production goal are added. A flowering cannabis study that uses a 12-hour day cannot automatically be converted into an 18-hour vegetative recipe by matching the same DLI.
Research in cannabis also shows that whole-canopy yield responses can continue across high PPFD ranges under controlled conditions. That does not mean the largest experimental DLI is the correct target for every room. Energy price, cooling capacity, CO₂, irrigation, canopy architecture, cultivar, and marginal yield per additional photon decide the practical ceiling.
Equal DLI does not mean equal light treatment
Consider 600 µmol/m²/s for 12 hours and 400 µmol/m²/s for 18 hours. Both equal 25.92 mol/m²/day. The daily counted photon total is equal, but instantaneous PPFD and photoperiod are different. In photoperiod-sensitive cannabis, that difference is biologically important. The two programs should not be treated as interchangeable simply because the DLI matches.
“If my DLI is right, do I still need to care about PPFD?”
Question sent by: Julia Schneider, via contact form.
Yes. DLI tells you the daily total. PPFD tells you the instantaneous delivery rate and reveals hotspots that a daily average can hide. Keep both visible, especially when changing photoperiod or dimming.
Variable light requires integration, not one spot reading multiplied by hours
The simple formula assumes PPFD is reasonably constant. Sunlight, cloud movement, sunrise and sunset, scheduled dimming, and greenhouse supplemental lighting create changing photon flux. In those cases, DLI should be integrated from repeated PPFD measurements over time rather than estimated from one peak reading.
This is one reason a greenhouse or outdoor DLI logger is more useful than a single noon reading. A clear noon can look extremely bright while the total day remains modest because of morning cloud, shade, season, or short day length.
A DLI map can be more revealing than one room-average DLI
If electric PPFD is stable, every mapped PPFD point can be converted to a local DLI with the same photoperiod. This turns a spatial intensity map into a spatial daily-dose map. A 12-hour room with points at 700, 900, and 1,100 µmol/m²/s delivers approximately 30.2, 38.9, and 47.5 mol/m²/day at those locations. The timer is identical, but the plants do not receive the same daily photon dose.
This is useful during troubleshooting because a growth pattern that follows the DLI map strengthens the case for a lighting contribution. If symptoms ignore the light pattern, investigate root-zone, irrigation, temperature, pest, or disease causes instead of assuming every canopy difference is light-driven.
Photoperiod changes create a hidden DLI step
When a photoperiod-sensitive cannabis crop moves from a long vegetative day to a shorter flowering day, DLI falls automatically unless PPFD increases. For example, 500 µmol/m²/s provides 32.4 mol/m²/day over 18 hours but only 21.6 over 12 hours. The 12-hour schedule delivers one-third less daily photon quantity at the same PPFD.
This explains why growers often raise flowering PPFD, but it does not mean the previous vegetative DLI must be restored exactly. Stage, acclimation, cultivar, room environment, CO₂, irrigation, and economics still decide the useful level. The DLI arithmetic identifies the size of the change. It does not choose the target for you.
DLI inherits every error in the PPFD input
If the PPFD value is wrong, the DLI is wrong. If a center hotspot is used as the representative PPFD, the calculated room DLI is inflated. If a lux meter is converted with the wrong spectral factor, the error carries into DLI. If the fixture ramps during the day but you use full-power PPFD for every hour, the daily total is overstated.
For a complete calculation workflow, use the dedicated DLI procedure once its live URL is verified. This metrics resource keeps the DLI section focused on how the number fits into the larger lighting system rather than repeating the full measurement protocol.
PPE / µmol/J: Compare Photon Output per Unit of Electricity
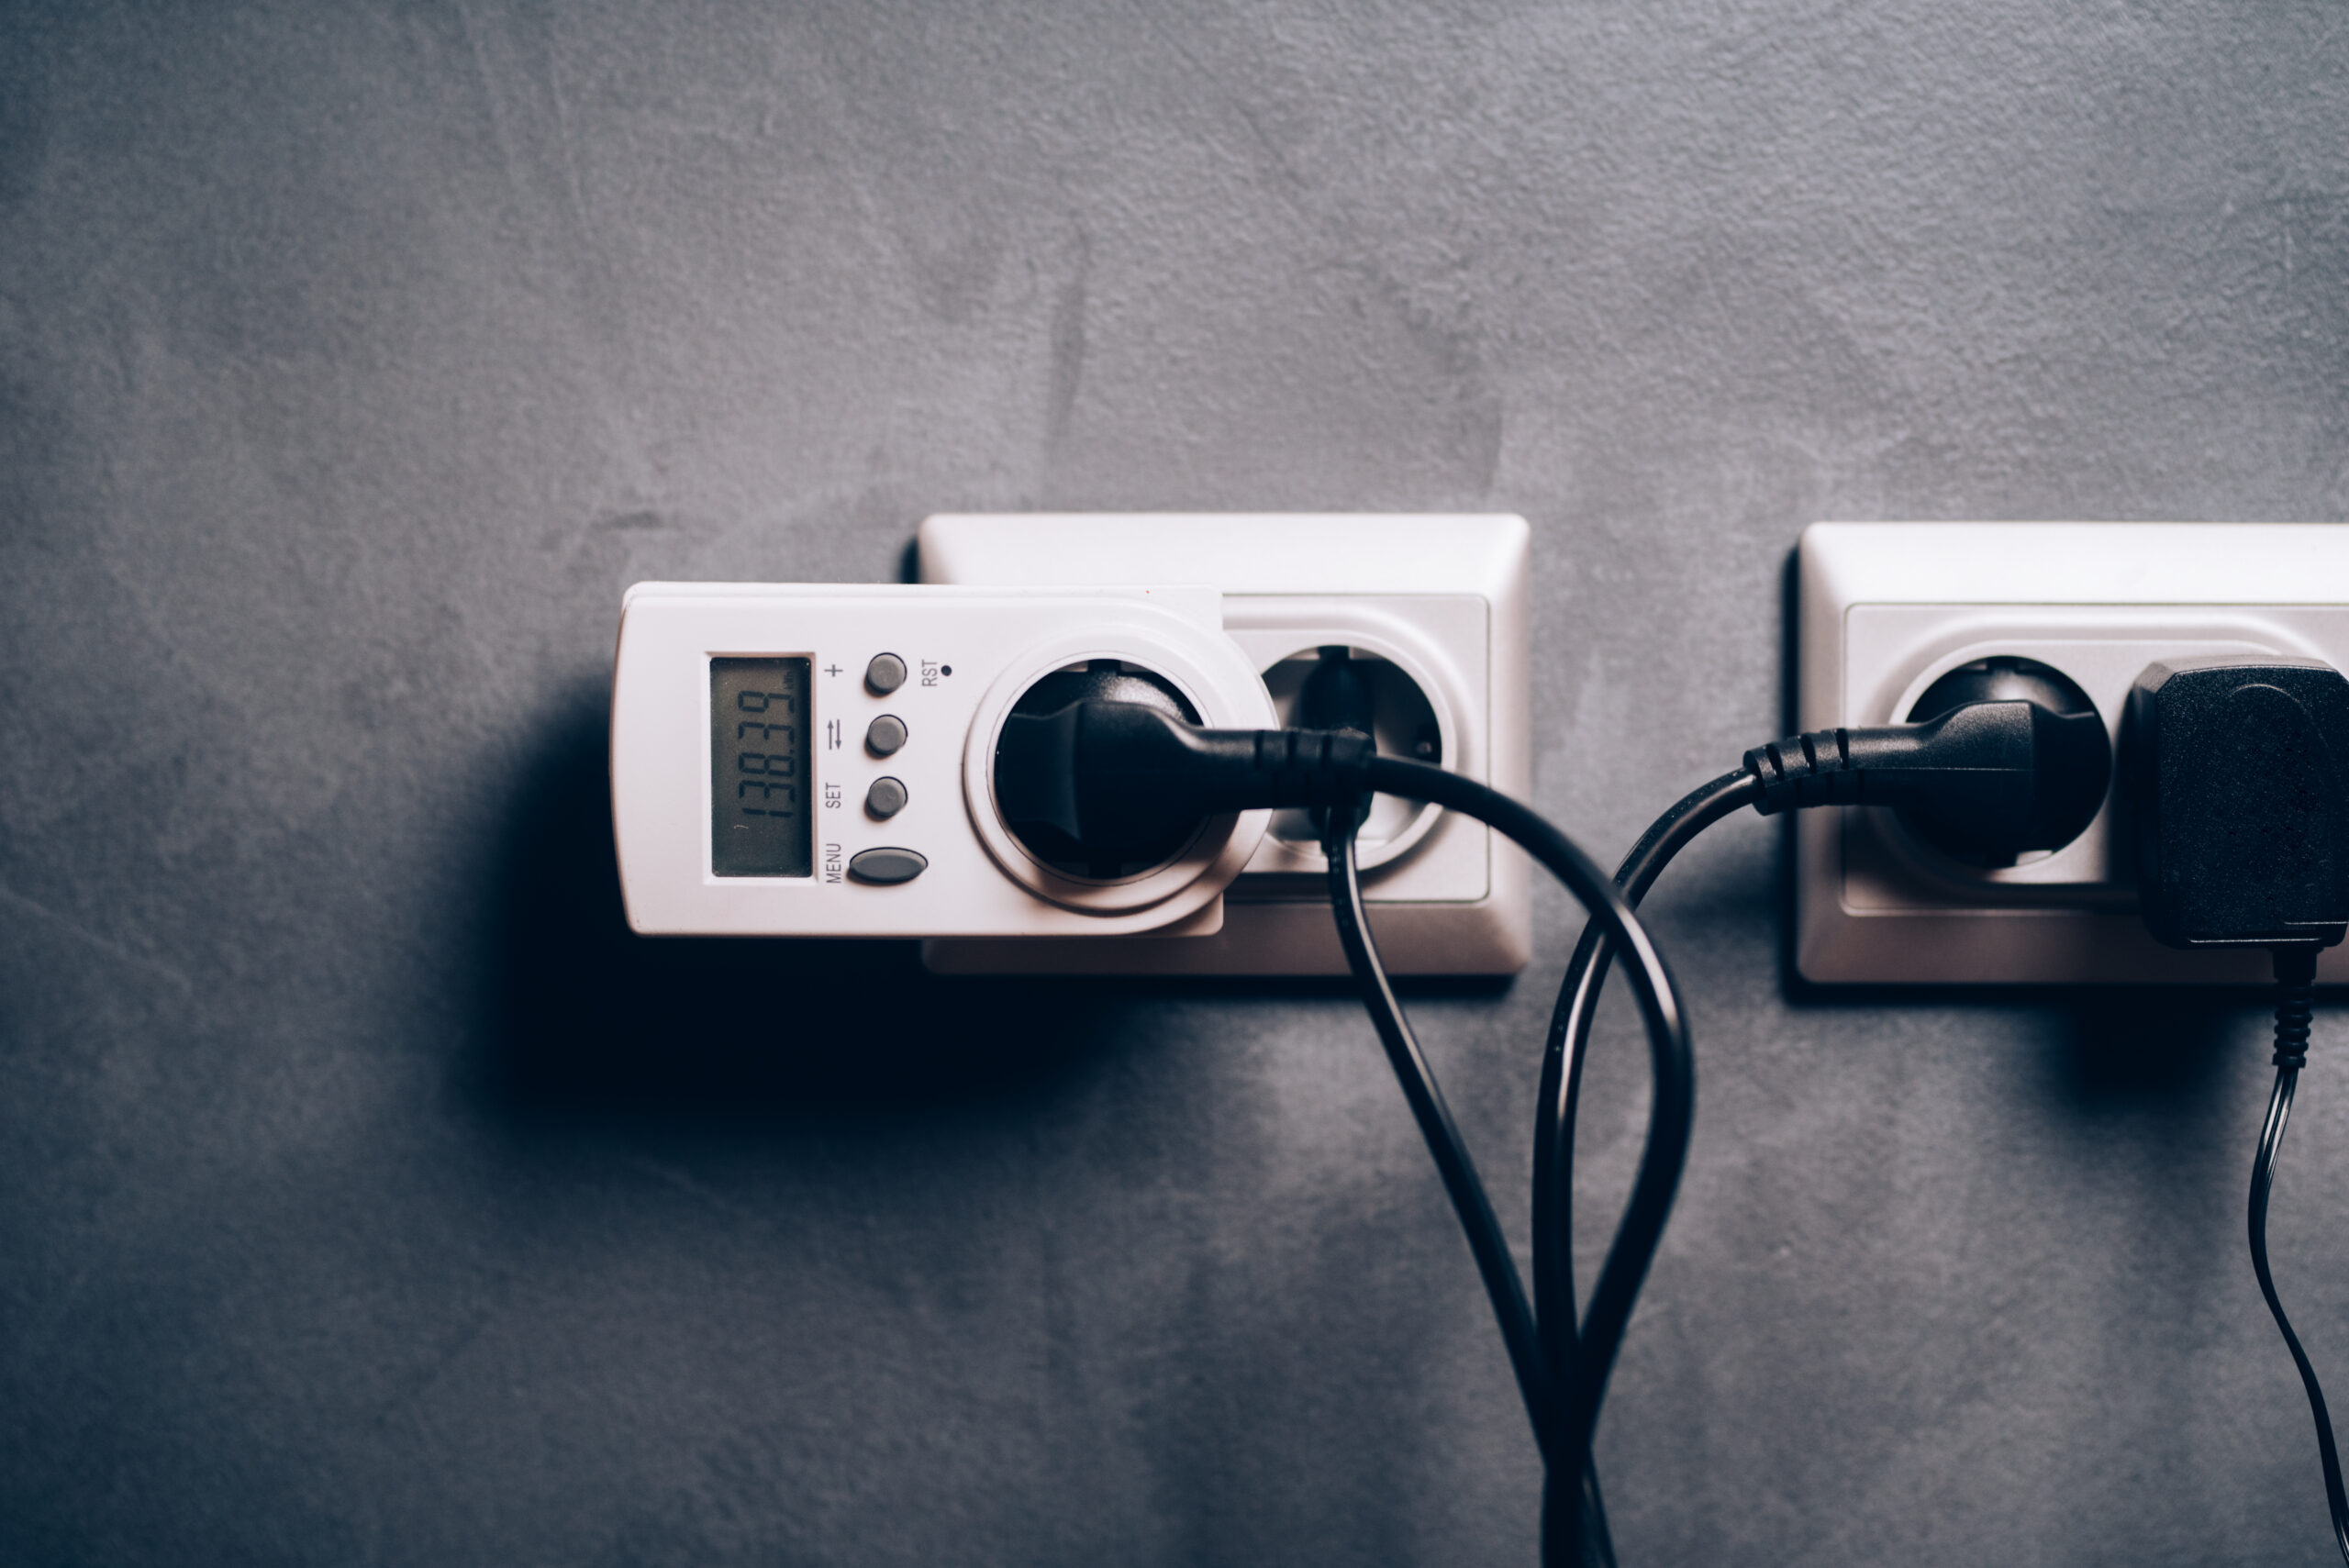
Photosynthetic photon efficacy, or PPE, compares conventional PPF with electrical input power. Its unit is µmol/J. Because one watt equals one joule per second, PPE tells you how many photosynthetic photons the fixture emits for each joule of electrical energy it consumes at the tested state.
The basic relationship is:
PPE = PPF ÷ input power
A 600 W fixture producing 1,500 µmol/s has a PPE of 2.5 µmol/J. A 600 W fixture producing 1,800 µmol/s has a PPE of 3.0 µmol/J. If both values were measured under comparable standardized conditions, the second fixture produces more counted photosynthetic photons from the same instantaneous electrical power.
PPE is often called efficiency in grow-light marketing, but efficacy is the more precise term because the output and input use different physical quantities. The input is electrical energy. The output is a photon count within a defined waveband. A PPE of 3.0 µmol/J does not mean the fixture is “300 percent efficient.” It also does not tell you the percentage of electricity converted into optical watts.
Photon energy changes with wavelength. Blue photons carry more energy per photon than red photons. Because PPF counts photons rather than optical joules, fixtures with different spectra can have different PPE values even when their radiometric energy conversion behaves differently.
Important: PPE is an excellent fixture-level energy metric, but it is not the same as wall-plug efficiency, canopy photon capture efficiency, grams per kWh, or profit per kWh.
A current industry threshold is not a cannabis optimum
The DesignLights Consortium’s Horticultural Lighting V4.0 requirements use a minimum PPE threshold of 2.5 µmol/J for eligible LED horticultural products. That is useful market context. It is not a universal line separating good and bad cannabis fixtures, and it is not a crop-performance target. The program has product eligibility, testing, and application rules that are broader than one home grow.
A fixture below a current qualification threshold may still grow plants. A fixture above it can still be a poor choice if coverage, reliability, dimming, spectrum, safety, physical size, or installed cost do not fit the room.
PPE tells you nothing about where the photons go
Imagine two fixtures with identical 2.8 µmol/J PPE and identical PPF. One produces an even rectangle that matches the canopy. The other concentrates photons in the center and loses output beyond the grow area. Their fixture efficacy is the same while their useful canopy delivery differs.
This is why a buying decision should combine PPE with PPF, PPFD maps, intended hanging height, fixture dimensions, dimming behavior, spectrum, electrical requirements, thermal management, and safety certification.
PPE can reduce electricity for the same emitted PPF
The practical energy benefit of PPE becomes clear when you reverse the equation. Suppose the room needs 2,000 µmol/s of fixture PPF. At 2.0 µmol/J, producing that output requires about 1,000 W of input power. At 2.5 µmol/J, it requires about 800 W. At 3.0 µmol/J, it requires about 667 W. The photon target stayed the same while electrical input fell as efficacy improved.
That difference can also change sensible heat added by the electrical equipment and the cooling requirement, although the exact HVAC effect depends on where drivers are located, how heat leaves the room, and the facility design. Do not turn the simple watt comparison into a universal cooling formula.
PPE does not include the room’s delivery losses
Fixture PPE stops at emitted PPF. It does not care whether the photons strike leaves, floor, walls, aisles, or another fixture. A second useful concept is system-level photon delivery: how much of the emitted flux reaches the productive canopy. That quantity is much harder to measure because it depends on spatial distribution and the real room.
A lower-PPE fixture with an excellent footprint can occasionally deliver a more useful canopy than a higher-PPE fixture installed badly. The correct comparison is not an argument against PPE. It is a reminder that fixture efficacy and application efficiency are separate steps.
Higher PPE does not guarantee lower total crop energy
If a more efficient fixture encourages the grower to raise PPFD substantially, total lighting energy can stay the same or even rise because the room is delivering more photons. Energy use depends on both fixture efficacy and the chosen photon dose. The equation is similar to a more fuel-efficient vehicle that is driven much farther: better efficiency per unit does not guarantee lower total consumption.
For an apples-to-apples comparison, hold the desired PPF or delivered DLI constant first. Then compare the electrical input required by each system. After that, consider the value of any additional photons separately.
PPE can change with fixture state
Some LED fixtures maintain similar efficacy when dimmed. Others shift because driver efficiency and diode operating conditions change. Spectrally tunable fixtures can also produce different PPF and PPE when channels are mixed differently. Do not assume that the full-power PPE remains exactly the same at every dimmer setting or spectrum recipe unless test data support that assumption.
Crop energy efficiency is a different calculation
A high-PPE fixture lowers the electrical energy needed to emit a given PPF compared with a lower-PPE fixture. But crop energy performance depends on more than the fixture. If the room wastes photons on walls, over-lights part of the canopy, requires more cooling, or runs an unnecessarily high DLI, the crop can still have poor energy productivity.
For a grower, useful energy questions include photons delivered per kWh, uniformity at the crop, harvestable yield per kWh, quality per kWh, and total HVAC load. PPE is one important link, not the final answer.
Do not buy on µmol/J alone
A spectacular PPE number cannot compensate for an unsuitable footprint, unsafe electrical design, weak warranty, poor dimming, or a PPFD map that does not fit your canopy. Efficiency belongs inside the decision, not above every other requirement.
Lux and Lumens: Keep Human Brightness Separate From Plant Light
Lux and lumens belong to photometry, the measurement system designed around human visual response. They remain useful in architecture, workplaces, cameras, and general illumination. They are not useless numbers. They simply answer a different question from PPF and PPFD.
A lumen is a unit of luminous flux, which weights optical radiation according to standardized human vision. Lux is luminous flux per unit area, with one lux equal to one lumen per square meter. The photopic human visual response is especially sensitive around the green portion of the visible spectrum, so equal photon quantities at different wavelengths do not contribute equally to a lumen or lux reading.
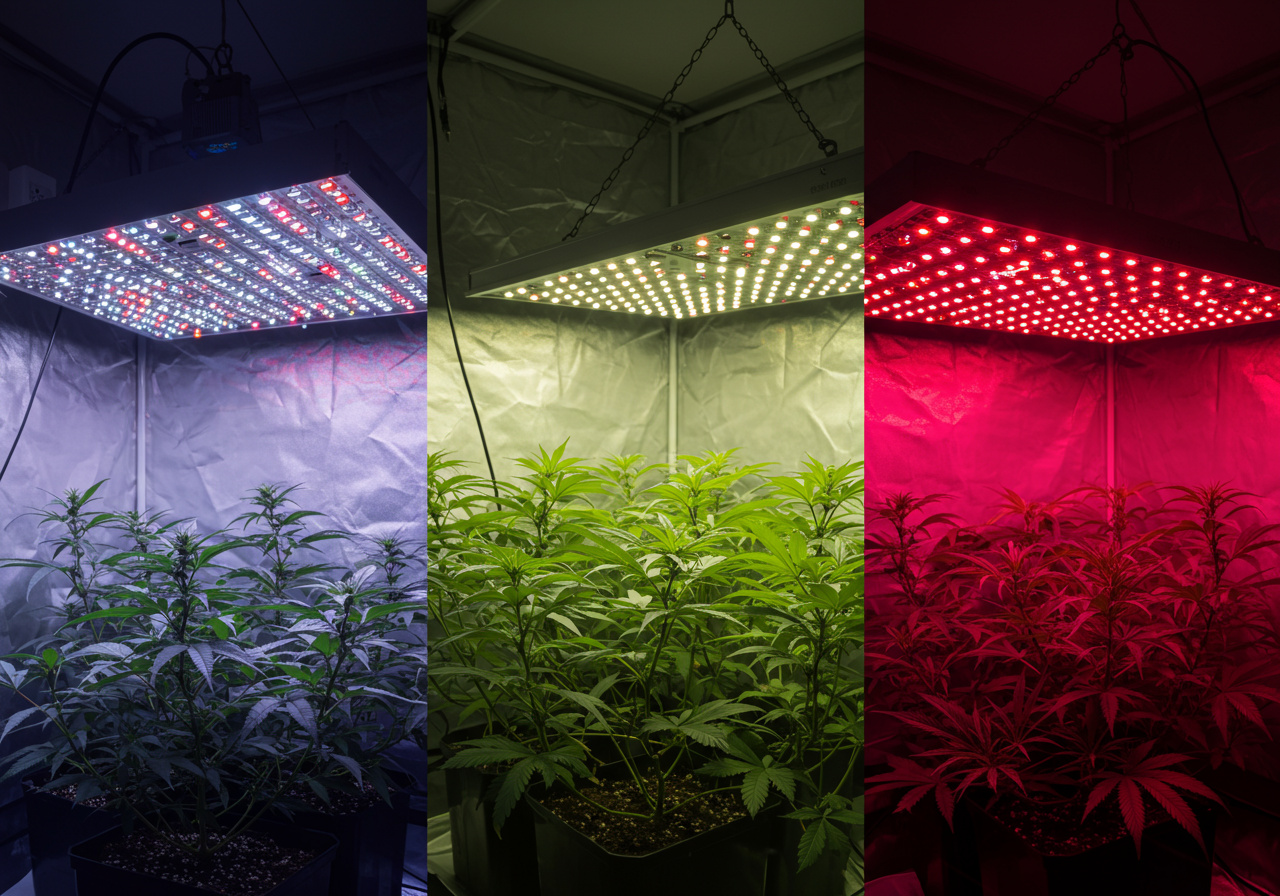
PPF and PPFD use a different accounting system. Within conventional 400-700 nm photon metrics, photons are counted rather than weighted by the human photopic response. That is why a red-heavy horticultural source and a white source can produce very different lux values at similar PPFD.
| Human-light metric | Plant-photon analogy | Useful comparison | Important difference |
|---|---|---|---|
| Lumens | PPF | Both describe total source output in their own measurement systems | Lumens are human-vision weighted; PPF counts photons in the defined plant waveband |
| Lux | PPFD | Both describe output per area at a receiving surface | Lux is human-vision weighted; PPFD is photon flux density |
Why a universal lux-to-PPFD conversion does not exist
The conversion depends on spectrum. A known sunlight spectrum has one approximate relationship between lux and PPFD. A warm white LED has another. HPS has another. A narrow red LED can differ dramatically because human vision weights deep red much less than green while the conventional PPFD metric still counts those red photons.
This means a statement such as “50,000 lux always equals 900 PPFD” is not reliable. A conversion can be used as a rough estimate only when the spectrum is known and sufficiently similar to the spectrum on which the conversion factor was based.
When a lux meter can still be useful
A lux meter can be a practical relative tool when the same fixture, spectrum, distance, and meter are used repeatedly. If one corner reads far lower than the center, the meter can reveal distribution differences. If the same fixture later reads meaningfully lower at the same geometry, the result may justify a closer check.
The problem begins when the lux value is converted into a universal plant-light target or used to compare fixtures with very different spectra. For accurate cannabis PPFD planning, use a suitable quantum sensor or validated measurement method.
“My phone says the canopy is extremely bright. Is that enough to set the dimmer?”
Question sent by: MapleGrower, via Facebook page.
Not by itself. A phone can be useful for relative checks, but the sensor, diffuser, software, spectrum, and calibration all affect the estimate. Validate the method against a suitable quantum sensor before treating the number as PPFD.
A spectrum-dependent conversion can be useful without becoming a universal rule
Published conversion tables demonstrate the problem clearly. The approximate lux produced by a given PPFD differs among sunlight, fluorescent lamps, HPS, metal halide, and white LEDs because their spectra differ. This does not make conversion tables worthless. It means the conversion must be tied to the source spectrum and used with an appropriate uncertainty.
If you own only a lux meter, one responsible workflow is to measure the fixture with both a trusted quantum sensor and the lux meter at several points. Derive a local conversion relationship for that specific fixture spectrum and operating state. You can then use the lux meter as a lower-cost consistency tool. If the spectrum changes, validate the relationship again.
Camera exposure and visual brightness are even farther from plant-light measurement
Automatic phone cameras change exposure, white balance, tone mapping, and image processing. A room can look equally bright in two photographs even when measured PPFD differs substantially. Human pupils and visual adaptation also change with brightness. Do not use photographs or visual comfort as evidence that a canopy has sufficient or excessive PPFD.
Visual inspection remains valuable for plant posture, bleaching, chlorosis, and canopy structure. It is simply not a calibrated photon meter.
Lumens are not a fixture-efficiency substitute either
Lumens per watt is useful for human lighting because it describes visually weighted output per electrical watt. Horticultural PPE uses µmol/J because it asks a different question: how many conventional photosynthetic photons are emitted per electrical joule. A fixture optimized for human luminous efficacy can have a different spectrum and crop use case from a horticultural fixture optimized for photon delivery.
Color temperature also cannot replace spectrum
Correlated color temperature, or CCT, summarizes the visual appearance of white light. Two fixtures with the same CCT can have different spectral distributions. CCT can be a convenient descriptive label for white light, but it does not tell you PPF, PPFD, DLI, PPE, blue photon fraction, red photon fraction, or far-red output.
Worked Example Connecting Watts, PPF, PPE, PPFD, DLI, and Canopy Area
The metrics become much easier to remember when they are connected in one example. The numbers below are illustrative. They are not a cannabis target and do not represent a specific product.
Step 1: Start with measured electrical input
Assume a fixture draws 720 W at the operating state being evaluated. That means it is using 720 joules of electrical energy per second while operating. Wattage helps with circuit planning, running cost, and heat load, but it does not tell us photon output yet.
Step 2: Use PPE to calculate the corresponding PPF
Assume the same tested state has a PPE of 2.8 µmol/J.
PPF = 720 W × 2.8 µmol/J = 2,016 µmol/s
We now know the fixture emits approximately 2,016 µmol of conventional photosynthetic photons per second under the assumed test state.
Step 3: Do not divide PPF by canopy area and call the answer your PPFD
Suppose the intended canopy is 1.44 m². An idealized calculation that assumes every emitted photon lands uniformly on that area would give 2,016 ÷ 1.44 = 1,400 µmol/m²/s. Real rooms do not behave that way. Photons are distributed unevenly and some do not reach the productive canopy.
The 1,400 value is therefore not the installed PPFD. It is an idealized upper-bound style calculation that ignores optical distribution and losses. Use a measured or credible mapped canopy PPFD instead.
Master Advice: PPF ÷ area can be useful for rough photon budgeting, but it is not a substitute for a PPFD map. The more the fixture spills beyond the crop or concentrates light in one zone, the less representative that simple division becomes.
Step 4: Measure a real PPFD grid
Assume a nine-point canopy map at the operating height produces these readings in µmol/m²/s: 980, 1,070, 1,100, 1,010, 1,180, 1,240, 1,190, 1,080, and 1,040.
The arithmetic average is approximately 1,099 µmol/m²/s. The minimum is 980 and the maximum is 1,240. The average is much lower than the idealized 1,400 derived from PPF ÷ area, which is exactly why delivery needs to be measured rather than assumed.
| Metric in the example | Value | What the value means |
|---|---|---|
| Electrical input | 720 W | 720 J/s consumed by the fixture |
| PPE | 2.8 µmol/J | Fixture photon efficacy at the tested state |
| PPF | 2,016 µmol/s | Total conventional photosynthetic photon output |
| Canopy area | 1.44 m² | Intended productive footprint |
| Measured average PPFD | ≈1,099 µmol/m²/s | Average of the illustrative nine-point canopy grid |
| Measured min-max | 980-1,240 µmol/m²/s | Illustrative spatial range across the grid |
Step 5: Add time to calculate DLI
If the measured average PPFD of about 1,099 µmol/m²/s remains stable for a 12-hour light period:
DLI = 1,099 × 12 × 0.0036 ≈ 47.5 mol/m²/day
This value describes the daily photon dose at the mapped average. The minimum point would receive about 42.3 mol/m²/day and the maximum point about 53.6 mol/m²/day under the same 12-hour duration. A single average DLI therefore hides a meaningful local range.
Step 6: Add energy use without confusing it with PPE
A 720 W fixture running 12 hours uses:
0.720 kW × 12 h = 8.64 kWh per day
PPE helped us compare photon output per joule at the fixture. Daily kWh tells us electrical energy consumed over time. The crop’s eventual grams per kWh would require harvest data and should not be confused with fixture PPE.
Step 7: Interpret the example instead of chasing the largest number
The correct next question is not “Can I raise PPFD higher?” It is whether the cultivar, stage, canopy, temperature, CO₂, irrigation system, root health, and energy budget can use the current dose productively. Cannabis experiments demonstrate that high light can increase yield under controlled conditions, but they also show why room-specific economics and biology matter.
The worked example is not a flowering recommendation
The PPFD and DLI values above exist to connect the units. Do not copy them into a grow simply because they appear in a calculation. Use the dedicated stage-lighting resource for target selection and the dedicated DLI procedure for measurement verification.
Step 8: Use the same chain to compare a second fixture
Suppose another 720 W fixture reports 2.4 µmol/J instead of 2.8. Its calculated PPF at that test state would be 1,728 µmol/s rather than 2,016 µmol/s. That is a meaningful fixture-output difference, but you still cannot predict the final canopy PPFD difference without distribution data. The lower-PPF fixture might have a better footprint at one height, while the higher-PPF fixture might need dimming or a different layout to achieve the same uniformity.
This is why PPF and PPE help shortlist fixtures while PPFD maps decide application. The metrics are strongest when they are chained, not when one is promoted as the winner.
What the example cannot tell you
The arithmetic does not reveal spectrum, far-red output, UV, driver quality, safety certification, long-term photon maintenance, warranty, waterproofing, dimming resolution, or whether the fixture physically fits the room. It also does not predict cannabinoid or terpene concentration. Those questions require different evidence.
The example also assumes that the nine PPFD points reasonably represent equal areas. If the canopy is irregular or the sampling grid is poor, the average and DLI need a better spatial method before being used for decisions.
One chain, six different questions
The example can now be read from left to right:
- Watts: How much electrical power is the fixture drawing right now?
- PPE: How effectively does the fixture convert that electrical input into counted photosynthetic photons?
- PPF: How many of those photons leave the fixture each second?
- PPFD: How densely do they arrive across the canopy?
- DLI: How many arrive across the full light period?
- Crop response: Does the plant and production system convert that delivered light into useful growth and quality?
Which Metric Answers Which Buying, Setup, and Troubleshooting Question
The most useful way to finish is to stop treating the metrics as competing numbers. Each one belongs at a different checkpoint in the lighting decision.
Use PAR when the question is which waveband is being counted
PAR matters when you need to know the spectral boundary behind a photon metric. Check whether PPF, PPFD, and PPE refer to conventional 400-700 nm or whether another photon band is being reported. When far-red output is important, inspect spectral data instead of assuming conventional PAR contains the whole biological story.
Use PPF when the question is total fixture output
PPF is useful for comparing the photon engines of two fixtures or estimating how much total output is installed in a room. It belongs in product comparison and rough photon budgeting. It does not replace a PPFD map.
Use PPFD when the question is what the canopy receives now
PPFD belongs in setup and troubleshooting. Use it when adjusting height, dimming, fixture spacing, overlap, or canopy training. Map more than one point. Record the geometry. Re-measure after major changes.
Use DLI when the question includes time
DLI belongs in schedule planning. It becomes essential when photoperiod changes or when comparing different combinations of intensity and duration. In variable sunlight or dimming programs, calculate the integrated daily total rather than multiplying one peak reading by the entire day.
Use PPE when the question is fixture photon efficacy
PPE is valuable during buying and energy planning. Higher PPE means more counted conventional photosynthetic photons per electrical joule under the tested state. It does not guarantee good coverage, good spectrum for a specific objective, or high crop yield per kWh.
Use lux and lumens only when the human-vision measurement is actually useful
Lux and lumens are appropriate for human illumination and can support rough relative checks under a fixed known spectrum. They should not drive cannabis light targets across different fixture spectra. If a product provides only lumens, look for PPF, PPFD maps, PPE, and spectral data before making a horticultural comparison.
| Real grower question | Primary metric | Supporting data | Common mistake |
|---|---|---|---|
| Which fixture emits more total photosynthetic photons? | PPF | Input watts, spectrum, test state | Comparing nominal watts instead |
| Which fixture uses electricity more effectively? | PPE | PPF, input power, standardized test data | Assuming highest PPE also means best canopy |
| Is my canopy evenly lit? | PPFD map | Min, average, max, height, footprint | Using one center reading |
| What daily photon dose does the canopy receive? | DLI | PPFD over time, photoperiod | Ignoring timer changes or dynamic light |
| Why does one fixture look brighter to me? | Lux/lumens may describe perception | Spectrum, photopic weighting | Assuming brighter-looking means more plant photons |
| Will this fixture fit my cannabis stage and environment? | No single metric | PPFD, DLI, spectrum, heat, CO₂, irrigation, cultivar, uniformity | Letting one spec decide the whole system |
A practical specification audit before you buy
When a product page is crowded with numbers, audit it in a fixed order. First identify actual input watts at the tested state. Next find PPF and PPE. Confirm the wavelength basis and look for credible test methodology. Then inspect the spectral distribution. After that, inspect PPFD maps at heights and footprints that resemble your intended installation. Finally, check safety certification, dimming, physical dimensions, driver location, ingress protection where relevant, warranty, and replacement support.
If the product lacks a tested PPF or PPE but provides only lumens and “equivalent watts,” the missing information should lower your confidence. If it provides a huge center PPFD but no map, you do not know the usable footprint. If it shows a map with no height or area, you cannot compare it fairly with another map.
A practical installed-room audit after you buy
After installation, verify the assumptions. Measure actual input power if you have a safe and appropriate method. Confirm fixture height and dimmer setting. Map PPFD. Calculate DLI from the real schedule. Compare leaf temperature and room climate before and after major changes. Save the numbers so the room has a baseline.
This record transforms troubleshooting. Months later, “the plants seem to be getting less light” can be tested against historical PPFD rather than memory. A driver replacement, fixture cleaning, canopy-height change, or dimmer adjustment can be documented with the same grid.
Do not let metric precision create false biological certainty
A quantum meter can report a precise-looking number such as 843 µmol/m²/s, but the biological system is still variable. Sensor uncertainty, spatial variation, leaf orientation, spectrum, cultivar, acclimation, irrigation, root health, and microclimate remain. More decimal places do not remove those uncertainties.
Use lighting metrics to make changes measurable and reproducible. Then let repeated plant and environmental observations decide whether the change was useful.
Common marketing shortcuts that should trigger a closer look
Be cautious when a product page relies on “equivalent watts,” lumen totals, vague “PAR” numbers without units, a single center PPFD, a PPFD map without hanging height, PPE without input watts or PPF, or spectrum graphics without test conditions. None of these automatically proves the product is poor. They simply leave important questions unanswered.
Compare complete measurement chains
Look for input watts, PPF, PPE, spectrum, PPFD map, hanging height, footprint, dimming state, safety information, and a realistic installation plan.
Ranking lights by one headline number
A fixture can win on PPF, center PPFD, PPE, or lumens and still lose in the room because the metric does not answer the problem you actually have.
Measurement can also diagnose whether the problem is output or distribution
If every PPFD point falls compared with a historical baseline while power draw remains similar, output degradation or optical contamination becomes more plausible. If the center stays similar but corners fall after a layout change, distribution is more likely. If PPFD is correct but DLI is low, inspect the timer or dimming schedule. If fixture PPF and PPE are strong but crop response is weak, move beyond the light specification and inspect climate, root zone, irrigation, nutrition, plant health, and canopy architecture.
A metric cannot certify plant performance by itself
High light can support high cannabis yield under suitable conditions. Research has shown increasing yield across broad PPFD ranges in controlled environments. Yet the same studies make clear that cultivar, environment, stage, whole-canopy behavior, and production economics matter. A lighting metric should narrow the diagnosis. It should not replace the biological system.
Master Tip: When a lighting decision feels confusing, write the question first. Then choose the metric. “How much output?” points to PPF. “How much reaches the leaves?” points to PPFD. “How much per day?” points to DLI. “How many photons per joule?” points to PPE.
Final buying and setup checklist
Before buying a fixture or changing a room, use the checklist below. It keeps human-brightness claims, fixture output, canopy delivery, daily dose, and energy use in the right order.
Before you trust the specification
- The wavelength basis of PPF, PPFD, and PPE is stated or verified.
- Input power is actual measured or tested wattage, not an equivalent-watt label.
- PPF is reported in µmol/s.
- PPE is reported in µmol/J and refers to the same tested fixture state.
- The PPFD map includes hanging height, footprint, and power setting.
- Canopy PPFD is verified at multiple points after installation.
- Minimum, average, and maximum PPFD are recorded instead of only the center.
- DLI is recalculated whenever PPFD or photoperiod changes.
- Variable sunlight or dimming schedules are integrated over time.
- Lux and lumens are not used as spectrum-independent cannabis targets.
- Spectrum is checked separately from total PPFD.
- High PPE is not treated as proof of good coverage or high crop yield.
- Electrical load, heat, safety, dimming, and fixture dimensions fit the room.
- Lighting changes are verified with plant response and environmental measurements.
Use the metric chain above before moving to fixture selection and room setup.
Share this article
A quick overview of the topics covered in this article.
Follow us
Latest articles
October 3, 2026