Why Universal NPK Ratios Mislead Growers
Two growers follow the same fertilizer ratio. One grows in pre-amended soil with mineral-rich tap water; the other uses an inert substrate and low-mineral water. Their labels look alike, yet the roots encounter different nutrient quantities, chemical forms, reserve pools, and salt concentrations. A ratio cannot tell either grower whether the plants are adequately supplied. It can hide a missing element just as easily as it can make an unnecessary supplement look essential.
There is no universal NPK ratio that can establish cannabis nutrition on its own. A fertilizer ratio describes relative declared nutrients under a particular labeling convention. It does not establish the final elemental dose, the contributions of water and media, the balance of calcium and magnesium, the form of nitrogen, root uptake, or whether an increase produces more usable flower. A useful feeding decision begins with the complete inputs and the actual root zone, not a three-number slogan.
This is a decision guide for interpreting and testing NPK ratios. The Nutrients & Fertilizers Guide covers the complete formulation framework, while Nutrient Basics introduces the elements and label terminology. Here, the question is narrower: why two apparently comparable ratios can produce different results, and how to decide whether a ratio-based recommendation deserves to be followed. Cultivation and nutrient disposal must comply with local requirements.
A Fertilizer Ratio Is Not a Plant Requirement
Nitrogen supports proteins, chlorophyll and new tissue; phosphorus participates in nucleic acids, membranes and energy transfer; potassium helps regulate water relations, enzymes and electrical balance. They are essential elements but do not act as three interchangeable ingredients in a recipe. A healthy root system must also acquire calcium, magnesium, sulfur and micronutrients while exchanging ions and water with its environment. No relative relationship between N, P and K can confirm that all of those requirements have been met.
What the three label numbers actually express
In commonly used fertilizer-label systems, the N-P-K grade reports percentage by mass of total nitrogen, available phosphate expressed as P2O5 equivalent, and soluble potash expressed as K2O equivalent. A 10-10-10 and a 20-20-20 have the same front-label proportions, but the second declares twice the nutrient mass per unit mass of product. Neither grade says how much fertilizer is applied, whether it is soluble, or whether the nitrogen is nitrate, ammonium, urea or organically bound.
The apparent elemental ratio changes when the label’s oxide reporting basis is converted. Elemental P is about 0.436 times the P2O5-equivalent amount and elemental K is about 0.830 times the K2O-equivalent amount. Thus a hypothetical 10-10-10 grade is roughly 10:4.36:8.30 on an elemental mass basis. This is a statement about equivalent mass under that convention, not a claim that fertilizer contains free P2O5 or K2O molecules. Some markets or laboratory reports use different declarations: check the actual reporting basis before converting.
Definition: Grade, ratio, and elemental concentration
Grade is the label’s declared nutrient percentage by mass. Ratio expresses the relative proportions of those declared figures. Elemental concentration describes the actual amount of each element per unit of final solution, commonly mg/L. A ratio lacks the absolute quantity and cannot substitute for a complete analysis.
Why identical proportions do not give identical doses
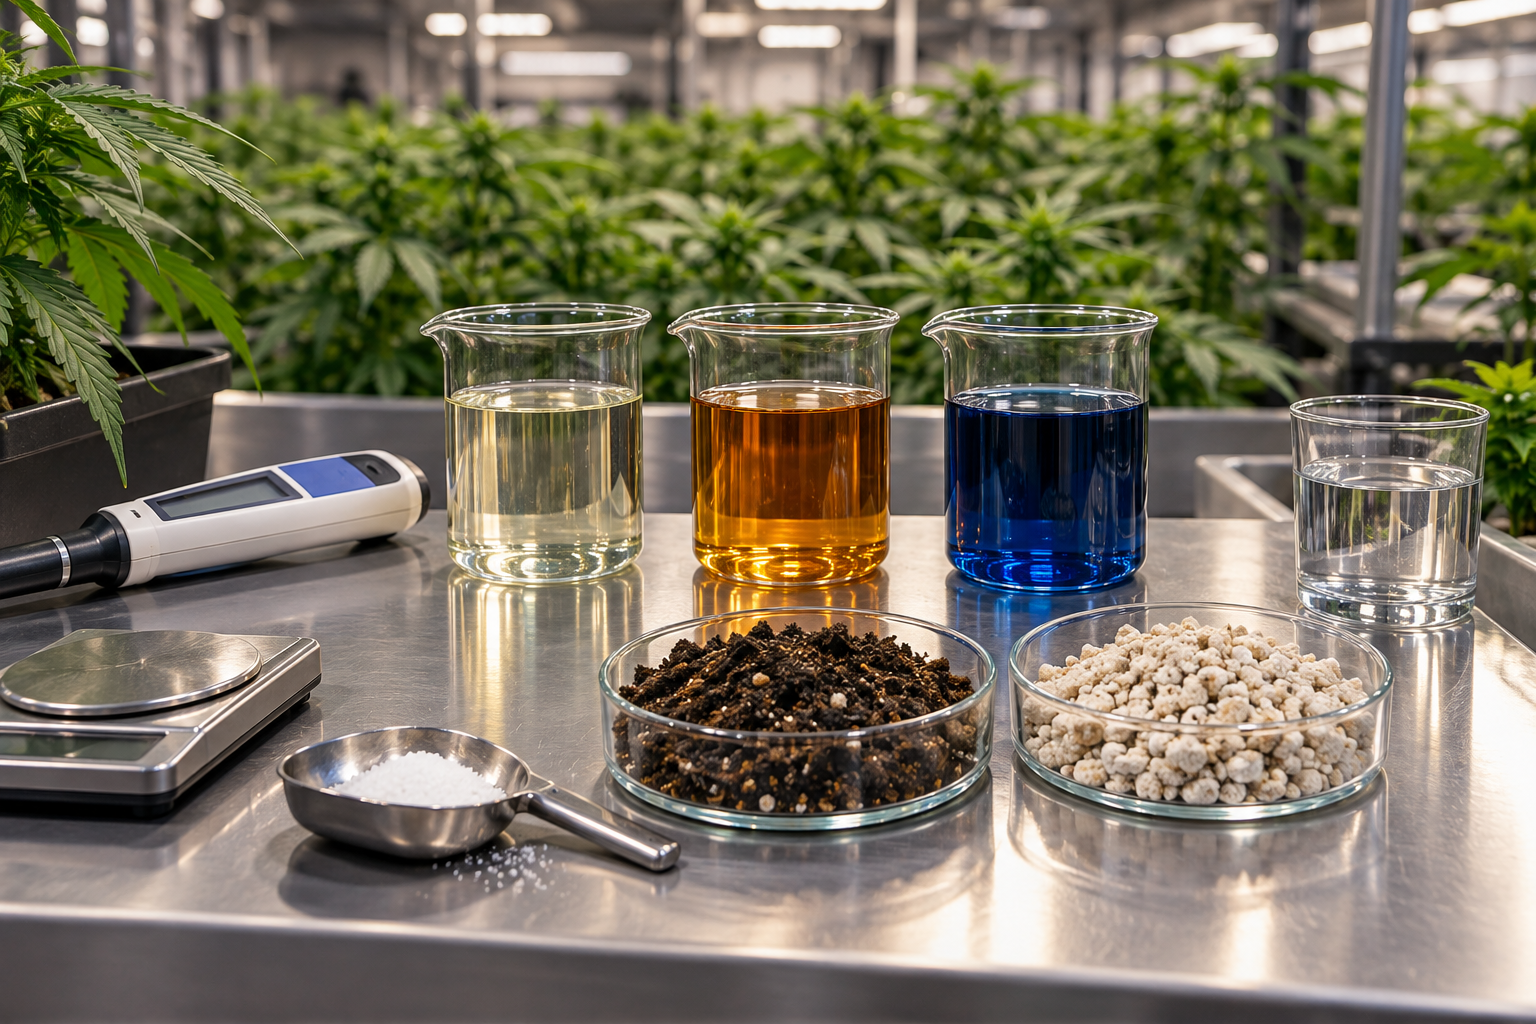
Consider a purely mathematical illustration, not a cannabis feed recommendation. Dissolving one gram of a hypothetical dry 10-10-10 fertilizer into a final liter supplies 100 mg/L N, about 43.6 mg/L elemental P and about 83 mg/L elemental K, assuming the declared nutrients are soluble and accurately represented. Using half a gram of a hypothetical dry 20-20-20 product in a final liter yields the same three nominal elemental concentrations. Using a full gram of the second product doubles them despite the unchanged front-label ratio.
Even these equivalent headline numbers do not prove the products are interchangeable. They may differ in nitrogen form, accompanying counterions, calcium, magnesium, sulfur, micronutrients, solubility, release time and the amounts of non-nutrient material. Liquid volume also requires product density for an accurate mass calculation. The correct comparison is complete final input at actual use rate, not the biggest label number or the product’s visual similarity.
A plant responds to concentrations, forms, and availability, not marketing sequences
Roots acquire dissolved ions. In hydroponics, a measured solution is relatively accessible to sampling, yet the reservoir can change between fillings as water and different ions are removed at different rates. In soil, mineral reserves, microbial processes, sorption, exchange sites and irrigation can make the same fertilizer input behave differently. A complete label still cannot guarantee an equally complete root-zone solution at every moment.
Phosphate can react with soil minerals or precipitate with calcium in incompatible concentrated stocks. Potassium and ammonium are cations interacting with other positively charged nutrients, including calcium and magnesium. A nutrient can therefore be present on the label while another becomes less accessible. Waterlogging, high salinity or unhealthy roots can also restrict uptake despite adequate measured input. Treat a feed ratio as one descriptor of the product, not an explanation of the plant’s entire nutritional status.
Remember: A nutrient label shows what a product declares. Plant nutrition depends on the total program and the conditions under which roots can use it. Move through those questions in that order.
Why the familiar vegetative-versus-bloom split is incomplete
Changing reproductive development alters the allocation of carbon and minerals, but does not switch off nitrogen or turn potassium and phosphorus into flower-specific shortcuts. Flowers develop while productive leaves continue supporting photosynthesis; a severe nitrogen cut can shrink the functional canopy. Excessive P or K can be ineffective or costly even in a flowering plant. Useful stage adjustments reflect measured supply and plant response, not the assumption that the middle or final number should always dominate after the first pistils.
A common fertilizer diagram moves from an N-heavy ratio to a P-heavy ratio at a fixed week. Without final elemental concentrations and cultivar, medium, climate and irrigation context, the diagram is not a usable nutrient prescription. It may describe a manufacturer’s particular products or experimental treatment, but it cannot justify applying that formulation universally.
Why Stage, Growing Medium, Water, and Environment Change the Answer
A demand estimate must reflect both what the plant is trying to build and what the system can deliver. Large plants under strong light may accumulate more biomass than smaller plants under low light, yet the relationship is not simply an invitation to double feed concentration. Uptake also responds to root health, water availability, transpiration, environmental temperature and the balance among ions. Stage provides context; it is not a replacement for measurements.
Vegetative demand is influenced by architecture and growth rate
A fast-growing vegetative plant needs nitrogen to build functioning leaf area, phosphorus for central metabolism and potassium for water relations and enzymatic processes. The proportions found in one response-surface study are properties of that experiment, including its cultivar, vegetative conditions and nutrient solution. Copying the experimental optimum into a different flowering crop, field soil or organic bed would discard the design that made its result meaningful.
Even within one plant, leaves, stems and roots differ in mineral composition. More leaves may change the fraction of a plant’s total nitrogen held above ground without changing the optimal fertilizer grade. A pruning, training or spacing intervention can alter canopy demand, but the need should be evaluated through new growth, solution use and root-zone data rather than assigning a special NPK ratio to every architecture.
Flowering is a changing process, not a fixed ratio switch
During transition, internodes and leaves may still expand as reproductive structures form. Later, flowers accumulate dry matter and nutrients as canopy development changes. Genetics and light response affect these trajectories; a fixed first-three-week window is therefore a descriptive observation period, not a universal nutrient boundary. Keep nitrogen available where needed, inspect developing flowers and the supporting leaves, and judge adjustments by actual elemental supply and plant condition.
Concentrations from scientific hydroponic trials are useful for understanding response curves, yet they represent the root environment and tested design of a defined experiment. If a study identifies an optimal input of N or P for its material, it does not follow that every soil grower should supply the same value in each irrigation. Slow-release reserves, dilution by rainfall, recirculation, differing irrigation frequency and changing root-zone volumes all interrupt that simple transfer.
Source water makes one bottle into multiple recipes
Start with a water report that distinguishes pH from alkalinity and includes EC, calcium, magnesium, sodium, chloride and any nutrient ions the laboratory can measure. Tap water may add useful calcium or magnesium along with undesirable sodium or bicarbonate. Reverse-osmosis water begins with far fewer dissolved salts and can require a different complete formulation. High alkalinity also affects the amount and type of acid needed for pH management; phosphoric acid or potassium-based pH products contribute nutrients that belong in the final total.
Two growers mixing the same concentration of one fertilizer can end with different calcium-to-magnesium and overall salt conditions. The appropriate response is not automatically to buy an extra bottle. It is to count water contributions, identify the genuine gap and choose a complete program that closes it without duplicating other inputs. Penn State’s greenhouse irrigation-water laboratory specifically tests water for both quality and fertilizer-relevant nutrients because these are distinct questions.
Soil, coco and water culture do not store nutrients in the same way
Native soil may retain large pools of P and K that require appropriate regional extractants and interpretation. Well-amended potting mixes can release mineral nutrients over time and buffer some fluctuations. Coco exchange chemistry can alter cation relationships, while inert substrates have little reserve and require accurate ongoing delivery. Recirculating hydroponics can accumulate certain ions as plants remove water and nutrients at different rates. The same feed grade and nominal application rate therefore generate different exposure histories.
The soil and growing-media guide covers these systems as complete root zones. For ratio decisions, the relevant question is simpler: does this system already supply or retain one of the three headline elements, and how can the amount actually available be tested? A soil-test P result is not interchangeable with the dissolved P concentration in a reservoir.
“My friend gets good results with 3-1-2. Why does the same ratio leave my plants pale?”
Question sent by: Ethan Brooks, via email.
The relative grade may match while applied concentration, water chemistry and medium reserves differ. Record the products and actual dilution, review the water and medium, confirm root health, and compare new growth. A pale plant is not proof that the ratio itself is wrong or that nitrogen is the only problem.
Environment can limit the benefit of extra fertilizer
Low light, cold root conditions, prolonged saturation and poor irrigation uniformity can all limit productive growth before mineral input is limiting. Increasing solution concentration may then raise osmotic pressure or leachate loss instead of restoring development. Outdoor rainfall can dilute or move nutrients, while heat and rapid dry-back can concentrate salts in a container. Daily management should therefore include environmental and water-use observations alongside fertilizer records.
Do not compare two nutrient schedules without describing light exposure, root-zone temperature, oxygen conditions, irrigation practice and plant size. They are not optional background. They decide whether nutrients can be converted into productive tissue, and can make identical ratios appear either successful or inadequate.
How Deficiency, Excess, and Root-Zone Problems Defeat Ratio Rules
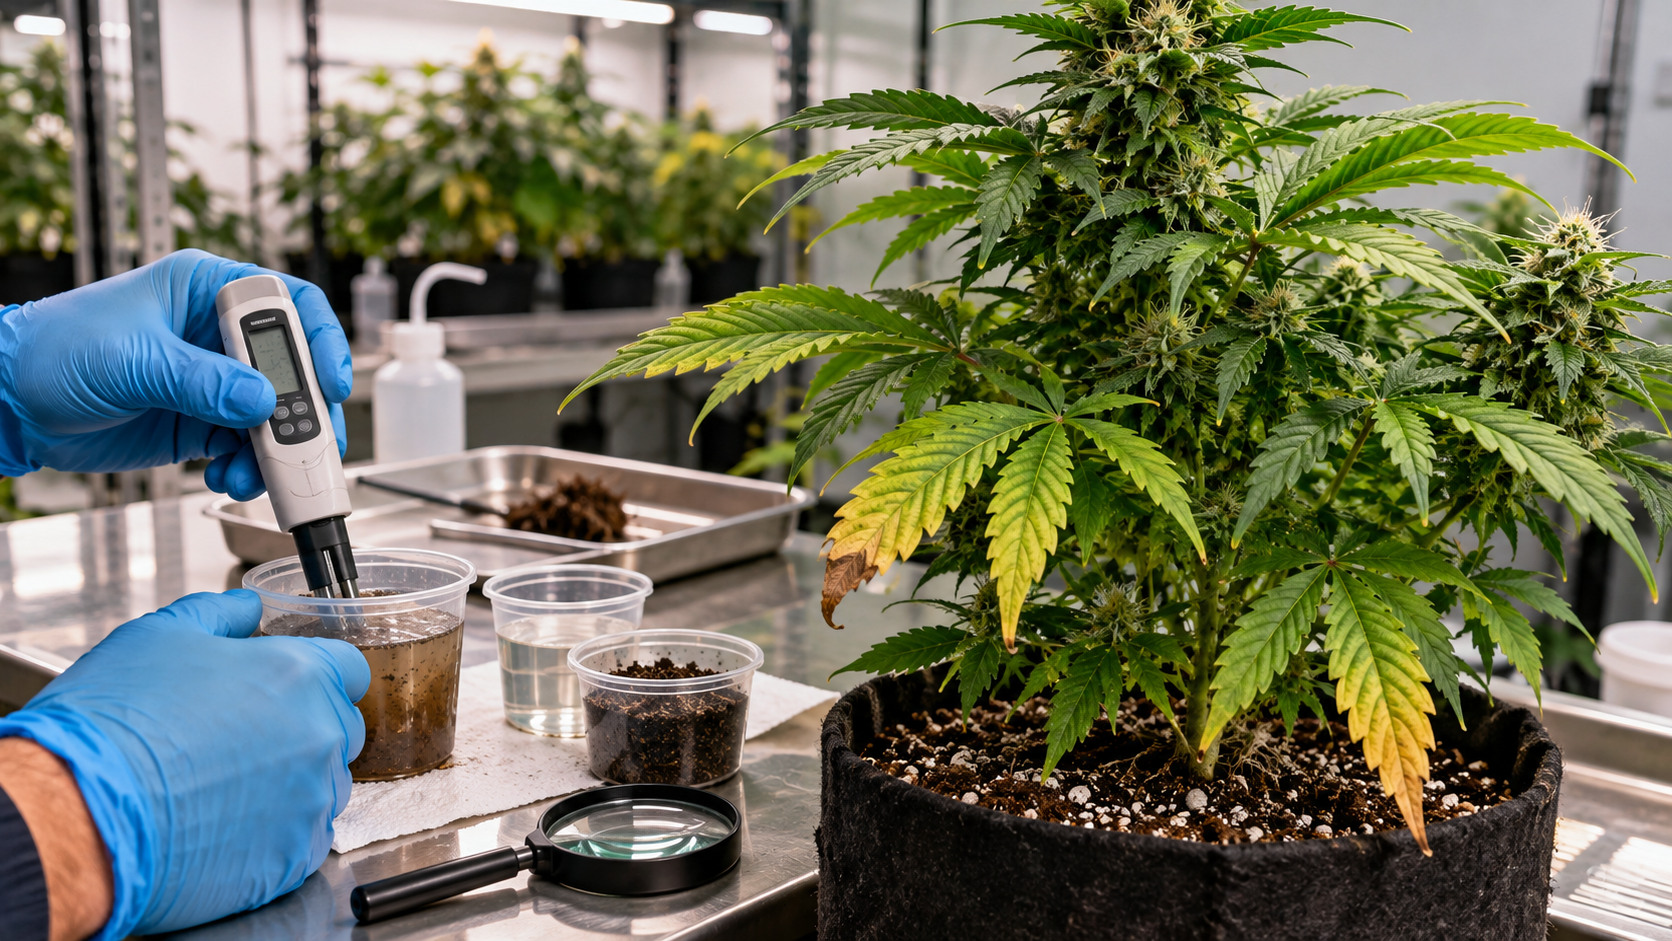
The visible plant is a valuable warning system but an unreliable standalone elemental assay. Older-leaf yellowing may be consistent with nitrogen deficiency, yet root damage, natural senescence, magnesium shortage or irrigation problems can resemble it. Leaf-margin injury may suggest inadequate potassium but also salinity or localized heat damage. A single purple petiole cannot confirm phosphorus deficiency. Pattern, progression and measurement must separate the possibilities.
A ratio can hide actual underfeeding
A product can have a plausible balance while being applied so weakly that every nutrient is insufficient. Young growth may slow and older leaves may fade, but swapping from one ratio to another at the same tiny application may only shuffle the shortages. First establish that the planned final concentration and delivery volume are appropriate for the system, then inspect whether the whole plant is responding. If the solution is highly dilute and no reserve is present, that evidence is different from an adequately supplied pot with dysfunctional roots.
A ratio can hide overfeeding and osmotic stress
High input can raise solution EC irrespective of whether its NPK proportions look attractive. As salts accumulate, roots may have difficulty acquiring water and the crop may display wilting, burnt edges, reduced growth or uneven performance. These responses overlap with drought and individual nutrient disorders. A diagnosis requires standardized feed and root-zone EC, irrigation observations and a review of all contributing salts, including bicarbonate, sodium and chloride from water.
EC is a total-conductivity reading rather than an assay for N, P or K. A high value does not identify the excess element, and a normal reading cannot prove that a complete formulation contains sufficient calcium, magnesium or micronutrients. A universal EC threshold is as misleading as a universal ratio when measurement method and medium differ.
Ion competition can create a secondary shortage
A grower increases potassium with a bloom additive and later notices symptoms consistent with magnesium or calcium difficulty. The true change may be a cation-balance issue rather than inadequate magnesium in the original base formula. Cannabis potassium studies have reported genotype-dependent responses and changes in the concentrations of other ions. Document K from every base, booster, silica product and pH adjuster before adding more magnesium or calcium.
The same caution applies to ammonium. Total N alone conceals whether a large fraction comes as ammonium; a strong ammonium supply can modify cation uptake and root-zone pH under some conditions. Conversely, nitrate-dominant and organic nitrogen programs behave differently in terms of conversion and timing. These interactions are not captured by reducing nitrogen to a single numerator in a three-number ratio.
Warning: Do not use a deficient-looking leaf to justify three simultaneous supplements.
Adding more N, a PK booster and Cal-Mag in the same irrigation changes several ions and total EC at once. Even if the next leaves look healthier, the cause becomes impossible to identify. Check the root zone and complete feed first, then correct the most strongly supported limitation.
Precipitation, pH and root function can mimic an incorrect formulation
Cloudy concentrate or crystalline sediment may indicate incompatibility, particularly when calcium and phosphate are mixed in strong stock. In mineral soil, phosphate can become poorly available through sorption or chemical reactions; high soil-test total P is not the same as adequate available P. Soil and solution pH help interpret these processes but do not quantify each nutrient by themselves. Poor oxygen supply can also cause inadequate uptake without any fertilizer shortage.
A ratio-focused response would replace the fertilizer and leave the blocked emitter, incompatible stock, dry hydrophobic channel or waterlogged root ball untouched. Correct the delivery or root-zone defect first. If damaged roots are the dominant problem, increasing salinity with a stronger recipe can reduce recovery chances.
| What you observe | Plausible alternatives | What distinguishes them |
|---|---|---|
| Older leaves pale; growth slows | Insufficient N; overall underfeeding; wet roots; normal late senescence | Check plant stage, actual N input, root condition, comparable plants and progression |
| Brown leaf margins after bloom additive | K imbalance; general salinity; heat; irregular irrigation | Check full elemental additions, matched EC, canopy heat and water-use record |
| Purpling appears but growth remains vigorous | Genetics; temperature; developmental pigments; possible P limitation | Assess growth trend, relevant leaf symptoms, tissue or available-P data |
| New growth declines while input analysis looks complete | Root injury; pH availability; precipitation; blocked delivery | Inspect roots, delivered volume, stock clarity and appropriate media tests |
| Reservoir EC increases between top-ups | Water removal exceeds ion removal; excessive input; evaporation or accumulation | Track water replacement, full assay where needed, pH and product additions |
The absence of visible toxicity is not proof that more nutrients help
In a 2025 cannabis hydroponic trial, raising phosphorus input increased tissue P and root-zone accumulation without significant improvement in the measured yield or quality. The plants did not need to show a characteristic burn pattern for the excess input to be wasteful. In a separate flowering study, raising phosphorus substantially increased P in leachate without increasing flower yield or measured cannabinoid concentration. These are specific trial systems, but they demonstrate why symptom-free leaves cannot validate a costly booster strategy.
Measure the Complete Elemental Recipe, Not the Front Label
A ratio becomes useful only after translating it into common units and adding the missing sources. The minimum workable record contains the full guaranteed analyses, exact product amounts, final solution volume, source-water analysis, substrate and irrigation method, measured input pH/EC, and a consistent root-zone sampling protocol. For persistent or costly issues, obtain appropriate substrate or tissue analysis rather than constructing increasingly elaborate diagnoses from color alone.
Step 1: Normalize the label to elemental N, P and K
Record nitrogen as labeled and confirm whether the analysis separates nitrate, ammonium or urea nitrogen. For labels reporting P2O5 and K2O equivalents, multiply by approximately 0.436 and 0.830 respectively to obtain elemental mass equivalents. This conversion is required only once. Do not treat the elemental number as a new feed target or compare a percent-by-weight label directly with mg/L from a research paper.
For illustration, a one-gram dry dose of a 10-10-10 grade placed in one liter of final water contributes a nominal 100 mg/L N, 43.6 mg/L P and 83 mg/L K if the nutrients are fully soluble. A 10-5-5 product at a different dose could supply the same nitrogen while supplying less P and K. This is simple mass accounting, not a recommendation to use either grade. It also leaves out calcium, magnesium, sulfur and every other component, so it is an incomplete nutrient recipe until those inputs are counted.
Step 2: Calculate the actual solution, including every additive
For a dry product when the label percentage is on a mass basis, multiply grams of product by 1,000 to get milligrams, multiply by the elemental percentage as a decimal, then divide by final solution liters. For liquid concentrates, use the guaranteed analysis and measured density or manufacturer-supported mass-per-volume specifications. A milliliter is a volume, not necessarily a gram. Count calcium nitrate, magnesium sulfate, potassium silicate, monopotassium phosphate, acids, supplements and all other ingredient contributions where applicable.
Write the final recipe as an elemental list such as N, P, K, Ca, Mg and S in mg/L with nitrogen forms noted where available. This calculation cannot predict how much organic nitrogen will mineralize on a given day or how much soil phosphate a root will encounter; state such uncertainties explicitly. The goal is a defensible input estimate, not false precision about uptake.
Step 3: Measure the source water before calling the fertilizer complete
Look beyond source-water EC. Request a water analysis for alkalinity, calcium, magnesium, sodium, chloride and relevant nutrient ions, and note whether the laboratory reports nitrate as nitrate ion or nitrate-nitrogen. The reporting forms are not the same mass. Add genuine fertilizer-relevant water contributions to the total and consider whether high sodium or bicarbonate limits the suitability of the water for continued use.
Water pH and alkalinity are different properties. A water source with a modest pH can still carry substantial alkalinity and push a substrate toward a different pH over time. If an acid is used, include the nutrient supplied by its chemistry when significant. A product designed to lower pH may also increase N, P, K or sulfate in the final feed, depending on its composition.
Step 4: Make EC and pH repeatable without mistaking them for elemental tests
Measure the well-mixed final irrigation solution, verify calibration and temperature compensation, and record the sample conditions. Use a consistent sampling procedure for root-zone data. UMass Extension notes that saturated-media extract, 1:2 dilution and PourThru give different numeric EC interpretations even for the same sample. A casual runoff reading is not interchangeable with a standardized media extract or a laboratory nutrient assay. Compare only like with like and use reference ranges established for that procedure, medium and crop context.
In a recirculating system, sample reservoir concentrations over time and record top-up water, additions and solution replacement. In containers, use the same point in the irrigation cycle and a documented extraction method. In field soil, use a soil laboratory’s regional procedure and interpretation for available P and K. A tissue assay can help resolve suspected deficits if the plant organ, age and stage match a meaningful reference; it cannot rescue an otherwise poorly designed sampling protocol.
Definition: The difference between an input measurement and a root-zone measurement
Input analysis describes what enters a growing system. Root-zone testing describes the nutrient environment remaining near roots under a specified sampling method. Tissue testing describes nutrients present inside sampled plant tissue. These are related but not interchangeable, and no one measurement proves that a fertilizer ratio is optimal.
Step 5: Record outputs without confusing concentration and production
Useful final measurements include harvestable dry flower mass, product losses, measured cannabinoid concentration where legally and scientifically appropriate, and total compound yield calculated consistently. Higher cannabinoid percentage in a small, nutrient-stressed flower harvest may coexist with lower total compound production. Anecdotal claims about flavor, density or burn quality require their own study designs and cannot be inferred from EC or one nutrient percentage. Fertilizer costs and discharged nutrient loads also belong in the outcome ledger.
| Evidence source | What it tells you | What it cannot establish alone |
|---|---|---|
| Front NPK grade | Declared relative N, P2O5 and K2O by weight under common convention | Final dose, Ca/Mg balance, actual root availability |
| Complete analysis plus exact dilution | Nominal elemental input from identified products | All medium reserves or all organic release rates |
| Source-water laboratory report | Background ions, alkalinity and water-quality issues | Response of a particular cultivar to the complete recipe |
| Consistent EC and pH tests | Solution strength and acid-base trends | Which nutrient is deficient or excessive |
| Media/solution elemental assay | Element-specific status in sampled extract | That every root or plant tissue has sufficient supply |
| Matched tissue and yield data | Accumulation and measured performance | Universal nutrient requirements or sensory quality guarantees |
Pro Tip: Archive the actual bottle labels or technical analyses used that day. Manufacturers can reformulate products, and a future comparison becomes unreliable if the original formula is replaced by a newer package.
Why Different Fertilizer Systems Cannot Share One Simple Ratio
Different products and systems can supply the same elements but release them at different speeds and with different accompanying ions. Comparing front-label proportions without accounting for these differences turns a useful shorthand into a false equivalence. Choose the approach based on controlled delivery, substrate function and verifiable gaps, rather than declaring one nutrient source inherently superior for aroma or flowering.
Soluble mineral formulations offer calculable inputs but still need monitoring
Dry salts and liquid mineral concentrates can provide relatively precise nominal concentrations once their complete analyses, densities and dilution are known. This helps with controlled trials and systematic corrections. It does not remove the risks of mixing incompatible concentrated stocks, imbalanced co-supplied ions, changing recirculating solutions or accumulated salts. A precise formula delivered through a clogged emitter is not precision nutrition.
Two mineral programs with similar NPK grades may use different nitrate/ammonium splits or supply calcium and magnesium in different companion bottles. The headline ratio can match while root-zone pH behavior and nutrient competition differ. Review the full ingredient and guaranteed-analysis panel, not the brand’s stage name.
Organic and amended systems add timing and biological release
Compost, meals, manures and other organic amendments can contain substantial N, P and K. Much of their nitrogen may require mineralization, and release depends on temperature, moisture, microbes and amendment characteristics. A labeled 4-4-4 organic amendment and a fully soluble product with the same grade do not produce the same immediate dissolved nutrient solution. Soil-test reserves, amendment analysis and the timing of application matter more than visual similarity of packages.
Phosphorus and potassium can accumulate when the same rich amendment is repeatedly applied to satisfy nitrogen demand. Conversely, excessive moisture or cold conditions can delay mineralization and leave a crop short despite generous total nutrient content. Adding a soluble booster on top may help a verified shortfall in some cases, but routine supplementation without tests can conceal a flawed amendment program.
Hybrid approaches and pH products can duplicate nutrients
A grower starts with an amended potting mix, adds a liquid base and supplements it with a bloom formula. Each individual bottle may sound appropriate, yet the sum may exceed need or change calcium, magnesium and total salt balance. Potassium-bearing silica and pH-up materials, nitrate-bearing calcium products and phosphorus-bearing pH-down materials are particularly easy to overlook in a simple three-number comparison. Build a single ledger before deciding another bottle has a role.
Foliar sprays are not a general shortcut around root-zone diagnosis. Their appropriateness varies with element, formulation, growth stage, crop-specific rules and risks to exposed flowers; a foliar response is not evidence that the full root-zone NPK ratio should change. If a laboratory or qualified adviser identifies a particular corrective use, evaluate it separately from the long-term base formula.
Do: Compare complete systems
Compare elemental inputs, actual delivery, release pattern, water contributions and observed outcomes.
Avoid: Ratio-only substitution
swapping products solely because their front numbers resemble a popular recipe, or treating organic and soluble grades as immediately interchangeable.
Why a manufacturer’s feed chart is a starting hypothesis
Charts often assume a particular product range, water supply and medium. They may exclude optional products from their headline EC or combine them in ways that add the same element repeatedly. A chart that has worked for one growing setup is evidence of performance in that setup, not an independently validated optimum for every genetics or crop stage. Request the full analysis and calculate what the schedule actually delivers.
If a manufacturer’s claim promises fixed gains from a ratio, look for a comparison that holds cultivar, light, environment, irrigation, nutrient forms and other elements constant. An unreplicated side-by-side photograph cannot separate nutrients from differences in plant history. A transparent trial should report dry flower yield and the chemical or quality endpoint it claims, with enough data to judge uncertainty.
“Both products say 4-4-4. Can I exchange them at the same amount?”
Question sent by: Julia Schneider, via contact form.
Not safely on grade alone. Confirm whether one releases slowly and the other dissolves immediately, compare nitrogen forms and secondary nutrients, check density for liquids, and translate the actual dose to elemental input. If the original product is part of an amended mix, review its stored nutrient contribution before adding a new soluble source.
A Repeatable Method for Testing and Correcting an NPK Program
The objective is not to discover a perfect ratio from a single leaf. It is to eliminate the strongest alternative explanations and make the smallest change that can be evaluated. Run the same sequence whenever a new nutrient chart, cultivar, source water or medium creates uncertainty. Stop escalating fertilizer when the problem is already worsening.
Checkpoint 1: Define the actual problem before selecting a ratio
Describe the plant stage, growth trend, oldest and youngest affected leaves, whether one plant or the whole crop is affected, and what changed immediately before symptoms appeared. Record whether the concern is visible deficiency, excessive salts, disappointing dry yield, high nutrient waste or an unsupported wish for larger flowers. Each is a different decision. Compare symptomatic plants with equivalent healthy plants if possible.
If the only evidence is that a bottle with more phosphorus is labeled “bloom,” there is not yet a nutrient problem to correct. A reasonable response may be to retain the existing complete program, monitor development and collect actual feed data instead of making a speculative adjustment.
Checkpoint 2: Audit the inputs and root-zone delivery
Write down full product analyses, doses, final volume, source-water composition, irrigation frequency and recent amendments. Check calibration, mixed-solution pH/EC, stock clarity, delivery uniformity and roots. In a soil bed, request suitable available-nutrient testing. In a reservoir, check concentration trends and maintenance history. Do not compare a runoff number collected randomly today with a different extraction method measured last month.
Make a simple provisional classification: clear underinput, measured accumulation, suspected cation imbalance, chemistry/delivery problem, likely root or environment limitation, or unresolved. More than one category may apply, but identify which is best supported and which measurement would disprove it. This prevents a general nutrient-chart change from being applied to a localized blocked line.
Checkpoint 3: Change one justified variable
If calculated nitrogen supply is inadequate and root function is sound, adjust the N contribution without accidentally doubling unrelated phosphorus. If lab testing documents high P and no response benefit, reduce the unnecessary P source while maintaining other essential nutrients. If a K-heavy booster coincides with rising EC and declining Mg status, first review and correct the full cation supply. If roots are saturated or stock precipitated, restore oxygen or delivery before further fertilizer changes.
The degree of adjustment depends on the system and severity; there is no universal percentage correction or mandatory flush volume. Avoid sudden changes that create a second deficiency. Follow product safety and environmental rules for handling and disposing of concentrated solution. Never send nutrient-rich wastewater directly into a waterway or assume local discharge requirements are identical.
Checkpoint 4: Reinspect new tissue and comparable measurements
Record the change date, actual new elemental inputs and consistent follow-up EC/pH or laboratory results. Photograph the same leaves and emerging growth sites under similar light. Old necrotic tissue does not become healthy merely because supply improves. Look instead for normal new tissue, restored growth rate, stable water use and lack of additional progression. When crop stage or environment changes at the same time, qualify any claim that fertilizer alone caused the response.
In a recirculating system, assess whether ions continue accumulating despite a lower input. In amended soil, allow for delayed mineralization and avoid repeating interventions before the system could plausibly respond. Tissue analysis can help resolve an ambiguous situation but must use a consistent organ and reference context. If the plant declines after a change, reassess the diagnosis rather than stacking another booster.
Checkpoint 5: Decide whether to retain, reverse or escalate
Retain a change only when input and root-zone data move toward the intended state and the plant’s new growth or measured performance supports it. Reverse or pause when salts rise, new symptoms appear or the presumed deficiency remains unconfirmed. Escalate to a suitable nutrient or plant diagnostic laboratory for persistent, severe or commercially consequential problems. An assay request should name the specific elements, sample type, reporting units and questions to answer.
| Evidence after correction | Interpretation | Next decision |
|---|---|---|
| New growth improves; matched root-zone trend stabilizes | Correction is consistent with resolving the limitation | Hold the recipe; continue observing before further changes |
| EC continues increasing and water use declines | Accumulation or root-function issue remains possible | Pause extra fertilizer; audit irrigation, salts and roots |
| Symptoms remain only in one irrigation zone | Delivery, media variation or localized stress likely | Inspect the zone rather than changing whole-crop ratio |
| Tissue assay shows an element sufficient while leaves deteriorate | Look-alikes, distribution or root/environment problems remain | Expand differential diagnosis with lab guidance |
| Dry yield unchanged; more fertilizer was used | No demonstrated production benefit in this comparison | Review cost and excess inputs before repeating treatment |
Field Advice: A correction is verified by a defined outcome, not by a new product entering the tank. Record the hypothesis before the treatment and look for evidence that could prove it wrong.
What Cannabis Research Supports and the Final Decision Checklist
Research increasingly supports the central objection to ratio folklore: plant response is element-specific, stage-specific and dependent on the formulation and growing conditions. It also shows why a successful experimental dose is not a universal feeding schedule. Results from industrial hemp, CBD hemp, drug-type cannabis, field soil, soilless pots and deep-water culture belong to different populations and systems. Transfer mechanisms cautiously; transfer numerical prescriptions only after the context is compatible and the actual crop has been checked.
Controlled NPK experiments show response curves, not a winning bottle ratio
In a 2021 flowering-stage study, researchers varied N, P and K concentrations together in deep-water culture using a high-THC cultivar. Their modeled flower-yield response was nonlinear for N and P, while K did not significantly alter yield across the tested range. The paper’s predicted solution concentrations describe one cultivar and a defined experimental design. They cannot be reduced to a universal three-number product grade, partly because the model used absolute elemental mg/L concentrations and because other required nutrients and conditions were controlled.
A separate vegetative response-surface experiment found interactions among N, P and K for multiple growth traits and identified concentrations suited to its tested material and vegetative system. Its result is not identical to the flowering trial. That is not a scientific inconsistency demanding a single compromise ratio: the crop stage, response measurements and experimental conditions differ. Comparing the two makes the argument against copying one evergreen ratio stronger.
Evidence for sufficiency is not evidence for unlimited supply
In the 2021 study of two flowering medical-cannabis genotypes, low P restricted growth while greater supply supported yield, yet cannabinoid percentage and dry flower production did not move together. In a 2022 high-CBD flowering trial, increasing P input threefold did not significantly improve flower yield or cannabinoid concentrations but increased leachate P twelvefold. A 2025 hydroponic study likewise found increased tissue or solution P without a measured yield or quality benefit under its tested conditions. The justified interpretation is to prevent deficiency and avoid unnecessary excess, not to declare that phosphorus is unimportant or establish a single optimal P value.
For nitrogen, controlled flowering work found inadequate supply reduced flower biomass and some higher supplies changed cannabinoid and terpenoid concentrations, but the concentration response was not equivalent to total compound production. For potassium, a controlled vegetative comparison found genotype-dependent growth responses and interactions involving other mineral elements. These findings are evidence for testing the complete formulation, not proof that a specific NPK ratio makes cannabis universally more potent or flavorful.
Warning: Never turn an experimental optimum into an unqualified recipe.
Record cultivar or chemotype, stage, culture system, solution units, sampled tissue, fertilizer forms, environmental conditions and the endpoint measured. A hydroponic mg/L finding is not a soil amendment rate and a concentration gain is not automatically higher harvestable compound yield.
How to challenge a ratio claim before buying another product
Ask what the numbers mean, what dose created them, whether elemental conversion was done, which other ions accompanied the nutrients and whether water and substrate were characterized. Then ask what independent comparison supports the promised outcome. Was the cultivar the same? Were light, irrigation and plant age controlled? Were dry flower yield, tested chemistry and environmental losses reported separately? If those details are absent, treat the number as marketing or a preliminary hypothesis rather than an agronomic rule.
Supplier claims can still be informative when backed by full analysis and transparent experiments. They simply do not outrank repeated measurements from the actual system. Personal experience is useful for selecting questions to test but cannot distinguish one nutrient from simultaneous changes in light, genetics, irrigation and harvest handling.
“A feeding chart promises more terpenes from a high-PK ratio. What would prove it?”
Question sent by: Nathan Parker, via X.
Ask for a controlled comparison with matched genetics and environment, full elemental inputs, replicated plants, dry flower yield, consistent terpene laboratory methods and a clear statistical result. An attractive photograph, higher EC or a single aroma impression cannot isolate an NPK effect.
Keep this page separate from element-specific and soil-specific decisions
When the question is nitrate versus ammonium, phosphorus excess or potassium competition, a dedicated element-specific investigation is needed. This resource instead provides the shared comparison method that prevents growers from misreading all three elements at once. The complete feeding pillar covers broader nutrient-system design; Nutrient Basics covers beginner recognition, and the growing-media reference covers the underlying substrate. Keep proposed individual-element pages as future links until their exact published addresses are verified.
The final NPK decision checklist
Before following, replacing or intensifying a fertilizer program, confirm what the ratio is describing and what actual decision is being made. The target is a crop with adequate mineral supply, functioning roots and measurable outcomes, not an impressive package or a perfect-looking pie chart.
Checklist: Decide whether this NPK ratio deserves to guide your crop
- Identify whether the label reports N-P2O5-K2O, elemental nutrients or another local convention.
- Convert oxide equivalents once and calculate the actual dose in common elemental units.
- Count every base product, supplement, pH adjustment and source-water contribution.
- Check calcium, magnesium, sulfur, nitrogen forms and other required nutrients outside the three-number grade.
- Account for medium reserves, irrigation and nutrient release rather than copying a hydroponic number into soil.
- Measure final-input pH/EC and use a consistent method for root-zone observations.
- Investigate roots, environment and delivery before assuming a leaf symptom proves a ratio mistake.
- Make one justified change and track the same new-growth and root-zone checkpoints.
- Judge yield claims with harvestable dry mass, relevant chemistry, costs and nutrient losses separately.
- Reject a universal recipe claim when its dose, cultivar, system or comparison evidence is absent.
The practical answer: use the ratio to identify the fertilizer you are considering, then stop treating it as the plant’s requirement. An adequate recipe is one whose final elemental inputs and root-zone behavior can be measured, whose limitations are known, and whose results can be verified without adding unnecessary nutrients. If those conditions are missing, the ratio remains a label, not a diagnosis or a yield strategy.
Educational content. Follow applicable cultivation, fertilizer, irrigation, runoff, and laboratory-testing rules in your location.
Share this article
A quick overview of the topics covered in this article.
Follow us
Latest articles
October 10, 2026
October 10, 2026