
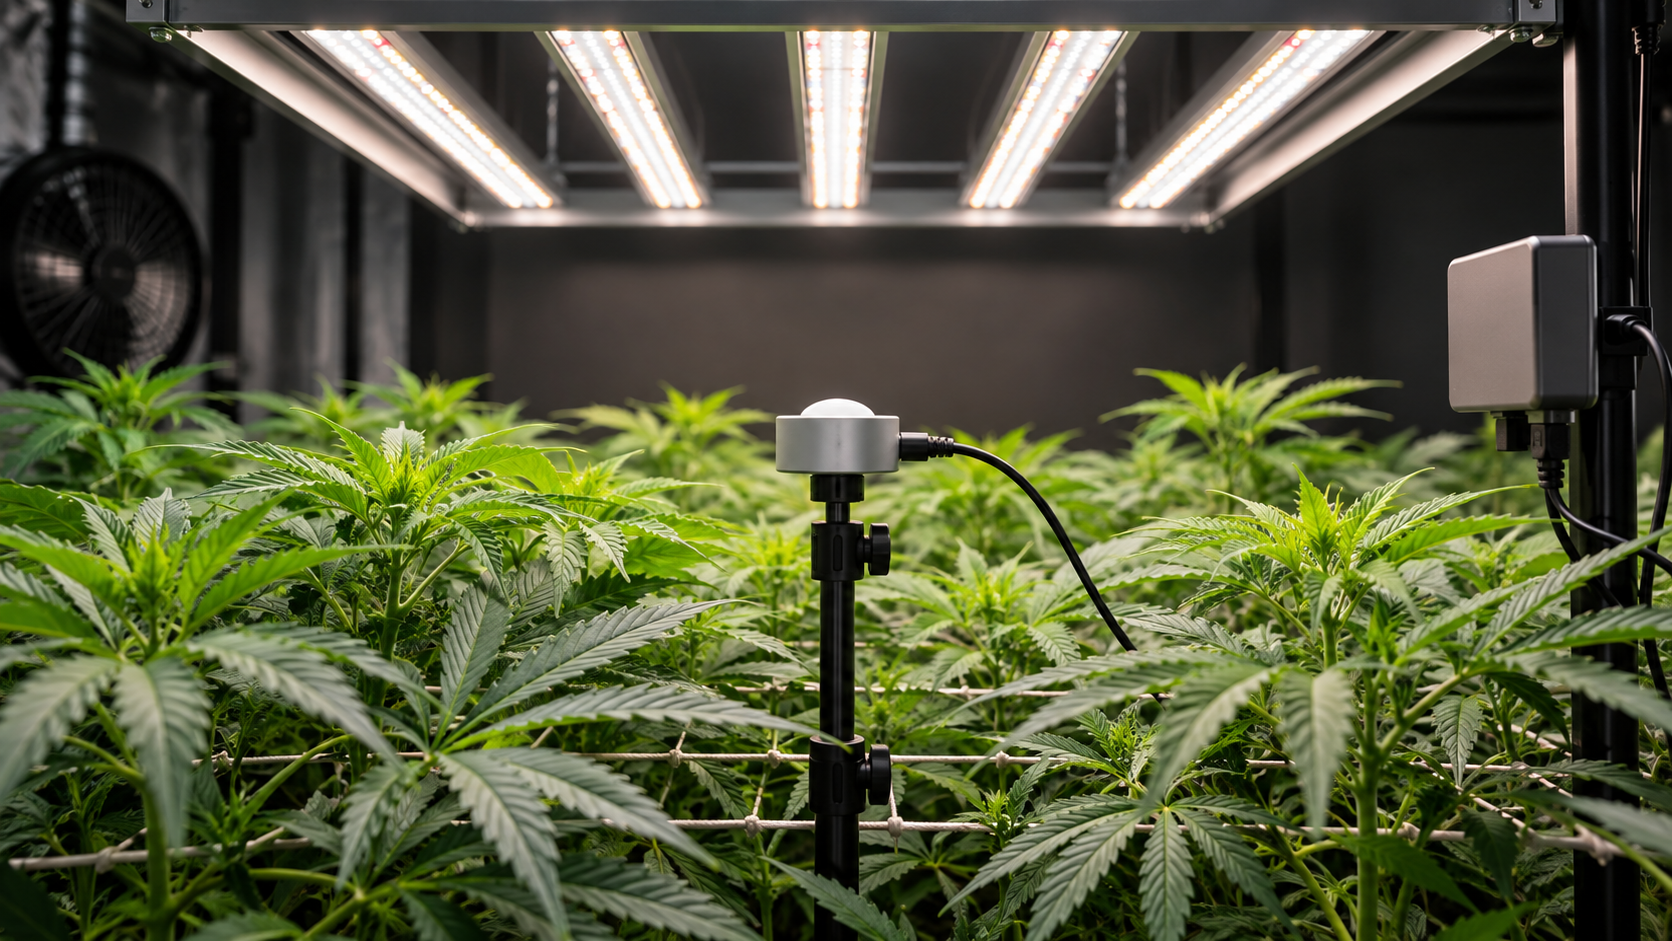
DLI for Cannabis: How to Calculate Daily Light Integral
Daily light integral, or DLI, tells you how many photosynthetic photons reach one square meter of canopy over an entire day. It is one of the most useful lighting calculations in cannabis cultivation because it connects PPFD, photoperiod, and time in one number. If PPFD is the rate at which photons arrive, DLI is the total dose accumulated across the light period.
The basic calculation is simple when electric lighting is stable: DLI = PPFD × light hours × 0.0036. A canopy receiving 600 µmol/m²/s for 12 hours receives 25.92 mol/m²/day. The same 600 µmol/m²/s for 18 hours receives 38.88 mol/m²/day. Nothing about the fixture output changed. The longer light period delivered more photons over the day.
The arithmetic is the easy part. The difficult part is deciding which PPFD value belongs in the formula, whether the light output is actually constant, whether the reading represents the whole canopy, and whether two schedules with the same calculated DLI are biologically interchangeable. They often are not. A correct DLI calculation can still lead to a bad lighting decision when the input measurement is unrepresentative or when photoperiod and instantaneous intensity are ignored.
This resource focuses on the procedure: measure PPFD at the real canopy, calculate or integrate the daily dose, identify the major sources of error, document the result, make one controlled change, and verify the next measurement. Stage-specific PPFD and DLI targets belong in the broader stage-lighting resource. Here, the goal is to make the calculation itself reliable.
Start With the Correct DLI Question and Formula
The direct answer is straightforward: if the PPFD at the canopy is reasonably constant during the light period, calculate DLI by multiplying PPFD by the number of light hours and by 0.0036. The result is expressed as mol/m²/day.
Daily Light Integral
DLI is the total number of photosynthetic photons incident on one square meter over one day. Conventional horticultural DLI is based on photons in the 400-700 nm photosynthetically active radiation waveband. It combines light intensity and duration but does not describe spectrum, canopy uniformity, temperature, carbon dioxide, root health, or the plant’s ability to use the delivered photons.
The standard constant-light formula
DLI = PPFD × light hours × 3,600 ÷ 1,000,000
The factors 3,600 and 1,000,000 are unit conversions. There are 3,600 seconds in one hour, and 1,000,000 micromoles in one mole. The same expression can be shortened to:
DLI = PPFD × light hours × 0.0036
PPFD must be in µmol/m²/s, light duration must be in hours per day, and the final DLI will be in mol/m²/day. If any of those units are different, convert them before using the shortcut.
| Input or result | Unit | What it represents |
|---|---|---|
| PPFD | µmol/m²/s | Instantaneous photosynthetic photon density arriving at the measurement plane. |
| Photoperiod | hours/day | How long the measured electric-light condition is applied during a 24-hour cycle. |
| DLI | mol/m²/day | Total daily photosynthetic photon dose at that location. |
| 0.0036 | conversion factor | Converts µmol/s multiplied by hours into mol/day. |
Audit the units before you trust the result
The constant 0.0036 is not a cannabis-specific coefficient. It is only a unit conversion. PPFD is reported in micromoles of photons per square meter per second. Multiplying by 3,600 converts the per-second rate into an hourly photon total, and dividing by 1,000,000 converts micromoles to moles. The canopy area term remains square meters, so the final result is mol/m²/day.
This unit audit is useful because many spreadsheet errors are really unit errors. A value entered as minutes instead of hours makes the result 60 times too small. A PPFD value copied from a fixture chart that is actually PPF in µmol/s is not a valid input at all. A light meter reporting lux is also not reporting PPFD. Before using the formula, write the unit beside every input and make sure the units match the equation.
Use the hourly photon contribution as a fast cross-check
At a constant PPFD, one hour of light contributes PPFD × 0.0036 mol/m². This gives you a quick way to audit a spreadsheet without repeating the entire equation. At 250 PPFD, each hour contributes 0.90 mol/m². At 500 PPFD, each hour contributes 1.80. At 750 PPFD, each hour contributes 2.70. At 1,000 PPFD, each hour contributes 3.60.
If your calculator says that 750 PPFD for 12 hours equals 12 mol/m²/day, the hourly cross-check exposes the mistake immediately: 2.70 × 12 = 32.4 mol/m²/day. This habit is especially useful when you are comparing several rooms, several fixture settings, or a long dimming schedule in a spreadsheet.
Quick Check: For constant light, double PPFD and DLI doubles. Double the light hours and DLI doubles. Halve either input and DLI halves. If your result does not follow that proportional relationship, inspect the units and formula before changing the grow.
A simple cannabis example
Suppose the representative canopy PPFD is 500 µmol/m²/s and the lights run for 18 hours. The calculation is 500 × 18 × 0.0036 = 32.4 mol/m²/day. If that same canopy later receives 500 µmol/m²/s for only 12 hours, DLI falls to 21.6 mol/m²/day.
This is why changing the timer without changing the dimmer can produce a large change in the daily photon dose. It is also why a grower who only watches PPFD can miss a major lighting transition.
Remember: PPFD answers “how fast are photons arriving right now?” DLI answers “how many photosynthetic photons accumulated during the day?” You need both numbers to describe the lighting schedule.
Reverse the formula when the target DLI is already known
You can rearrange the same equation when you know the desired daily dose and need to solve for the required average PPFD:
Required PPFD = target DLI ÷ (light hours × 0.0036)
For example, a target DLI of 30 mol/m²/day across a 12-hour light period requires an average PPFD of about 694 µmol/m²/s. A target of 30 across 18 hours requires only about 463 µmol/m²/s. Those two schedules deliver the same calculated daily total, but they do not create the same photoperiod or instantaneous intensity.
You can also solve for operating hours
If PPFD is fixed and you are calculating how long the fixture would need to run, use:
Light hours = target DLI ÷ (PPFD × 0.0036)
This rearrangement is useful for general controlled-environment planning, but photoperiod cannabis has a major boundary: you cannot treat operating hours as a free variable during flowering. The dark period is part of the flowering signal. A mathematically convenient schedule may be horticulturally inappropriate for the cultivar or production stage.
DLI math does not override photoperiod biology
If a flowering plant is being managed with a short-day schedule, do not extend the day simply because the DLI equation says that more hours would reach the same photon total at lower PPFD. Cannabis photoperiod response is cultivar-dependent, and research with 12- versus 13-hour flowering days does not justify treating every cultivar as insensitive to longer days.
Understand What DLI Measures and What It Does Not
DLI is an integral. It adds photon flux over time. That makes it powerful for comparing daily light quantity, but it also creates a common misunderstanding: growers sometimes treat DLI as if it were a complete description of the light environment. It is not.
Think of DLI as daily photon quantity, not daily lighting quality
Two lighting programs can have the same DLI while differing in PPFD, photoperiod, spectrum, canopy temperature, fixture distribution, and dark-period length. DLI tells you that the total counted photons are equal. It does not tell you that the plant experienced those photons in the same way.
For example, 600 µmol/m²/s for 12 hours and 400 µmol/m²/s for 18 hours both equal 25.92 mol/m²/day. Yet one delivers a stronger instantaneous photon flux across a shorter day and the other delivers a weaker flux across a longer day. In cannabis, the 12-hour and 18-hour photoperiods can correspond to very different developmental states, so the schedules are clearly not interchangeable.
“If two schedules have the same DLI, should the plants grow the same?”
Question sent by: Ethan Brooks, via email.
No. Equal DLI means equal calculated daily photon quantity in the measured waveband. It does not make PPFD, photoperiod, spectrum, temperature, or dark-period signaling equal. Use DLI to compare daily dose, but keep those other variables visible.
Instantaneous PPFD can still matter at the same DLI
Photosynthesis does not respond linearly to unlimited instantaneous light. Individual leaves can approach photosynthetic saturation even while a whole cannabis canopy continues to gain yield from higher canopy PPFD. Research has shown that whole-plant and leaf-level responses can diverge. That means there is no guarantee that doubling PPFD and halving duration produces the same growth, water demand, temperature response, or canopy behavior.
This matters when using DLI as a planning tool. It is useful for comparing total daily input, but it should not be used to hide an extreme PPFD. A schedule with a mathematically acceptable DLI can still contain a center hotspot that exceeds what part of the canopy can use safely.
Photoperiod is not just a multiplier
In the equation, photoperiod looks like a simple number of hours. In cannabis biology, it also carries information. Long days are commonly used to maintain vegetative growth in photoperiod-sensitive cultivars, while sufficiently long nights promote flowering. Research comparing 12- and 13-hour flowering days in two high-THC cultivars found cultivar-specific differences in flowering timing and maturity while also increasing DLI under the longer day. That experiment shows why the photoperiod term cannot be treated as merely arithmetic.
A separate 2025 night-break study reduced vegetative DLI while altering how the dark period was interrupted. Lower vegetative DLI was associated with weaker vigor and lower later floral biomass in that experiment. Again, the lesson is not that one exact DLI is universally correct. The lesson is that daily photon quantity can have carryover effects, while light timing still matters independently.
DLI does not describe light distribution
One DLI number can describe one point, or it can describe a spatial average if several canopy locations were measured and averaged. Those are not the same thing. A canopy may average 35 mol/m²/day while corners receive 22 and the center receives 48. The average is useful for system planning, but individual plants live at the local value.
For this reason, a good DLI record includes at least the minimum, average, and maximum PPFD or DLI across the measurement grid. The more uneven the room, the less useful a single average becomes.
DLI does not describe spectrum
Conventional PPFD and DLI count photons between 400 and 700 nm with equal weighting. They do not tell you how those photons are distributed among blue, green, and red wavelengths. Two fixtures can produce the same PPFD and DLI but different spectra and therefore different morphology or secondary responses.
Research has also shown that far-red photons between roughly 701 and 750 nm can contribute to canopy photosynthesis when supplied with shorter wavelengths. That work has led to the concept of extended PAR and ePPFD. Do not mix conventional 400-700 nm DLI with 400-750 nm eDLI without labeling the measurement basis. A number from an ePAR sensor may be higher than a conventional PAR measurement under a far-red-rich fixture even when both instruments are functioning correctly.
DLI and eDLI are not automatically interchangeable
Traditional horticultural DLI uses 400-700 nm PPFD. Extended DLI uses a wider photon range, often 400-750 nm. Record which sensor and waveband were used so future comparisons are meaningful.
DLI does not tell you whether the room can support the dose
A high DLI increases the potential for carbon gain only when the plant and environment can support the resulting demand. More light can increase transpiration, cooling demand, irrigation frequency, nutrient demand, and the consequences of poor root-zone function. A DLI number does not measure carbon dioxide concentration, leaf temperature, vapor pressure deficit, root oxygen, EC, or plant health.
That is why lighting adjustments should be verified against the entire grow system. If the canopy receives more photons but root-zone moisture becomes unstable, leaves overheat, or the room cannot remove additional humidity, the calculation may be correct while the cultivation decision is wrong.
Measure PPFD Correctly Before You Calculate DLI
Most DLI errors begin before the calculator. If the PPFD value is wrong, poorly placed, or unrepresentative, perfect arithmetic only produces a precise version of a bad input.
Measure at the actual canopy plane
Place the sensor where the productive canopy is, not on the floor, not on the empty tray before plants stretch, and not at a random distance listed on the fixture carton. The relevant plane changes as plants grow. A fixture that is 45 cm above a young canopy may be much closer after rapid stretch unless the light is raised.
Use the same reference plane for every point in a mapping session. If the canopy is irregular, choose a consistent representative height and note the variation. For advanced work, a second lower-canopy map can be useful, but do not mix top-canopy and lower-canopy values into one average without labeling them.
Create a measurement grid instead of trusting the center
A practical home-grow grid can include the center, corners, edges, and intermediate positions across the occupied canopy. Larger areas need more points. Keep the spacing systematic so the map can be repeated later. The exact number of points is less important than representing the full planted area and using the same method each time.
Record each PPFD reading, then calculate the spatial average. Also keep the minimum and maximum. If the fixture is stable over the photoperiod, each point can be converted to a local DLI using the same number of hours.
| Measurement | Why keep it | What it can reveal |
|---|---|---|
| Minimum PPFD | Shows the weakest mapped position. | Underlit edges, corner losses, shadowing, poor fixture footprint. |
| Average PPFD | Useful for estimating average canopy DLI. | Overall system output at the current height and dimmer setting. |
| Maximum PPFD | Shows the strongest mapped position. | Center hotspot or local over-lighting risk. |
| Minimum ÷ average | Simple internal uniformity comparison. | Whether later fixture adjustments improved or worsened distribution. |
Measure the occupied canopy
Use a repeatable grid at plant height, keep the sensor level, note fixture height and dimmer setting, and record minimum, average, and maximum readings.
Using the brightest point as the room PPFD
A center reading may overstate what most of the canopy receives. It can also hide weak corners while encouraging you to increase an already intense hotspot.
Separate spatial averaging from time averaging
There are two different averaging problems in a real grow. Spatial averaging asks how light varies from one canopy position to another. Time averaging asks how PPFD changes at one position during the day. They should not be mixed casually.
Under stable sole-source LEDs, time variation may be small, so a spatial PPFD map is the main task. Calculate DLI at every mapped point using the same photoperiod, then compare local minimum, average, and maximum DLI. If the measurement points represent equal areas, the arithmetic mean of those point DLIs is a reasonable summary of the mapped canopy. If some points represent much larger areas than others, use an area-weighted average instead of giving every point equal influence.
Under sunlight, greenhouse shade, moving clouds, or dynamic dimming, each location also has a time curve. In that case, first integrate PPFD over time at each important location, then compare the resulting local DLIs spatially. Do not average a few midday PPFD readings from several positions and multiply that single number by daylight hours. That shortcut collapses two different sources of variation into one estimate and can hide both temporal and spatial extremes.
Do not combine upper- and lower-canopy readings into a fake room average
A top-canopy quantum sensor and a sensor buried deep in the canopy are measuring different photon environments. The lower value can be useful for studying penetration or interlighting, but averaging it with the top-canopy map produces a number that represents no actual leaf layer. Keep each measurement plane separate. If interlighting is used, document the upper and lower measurement planes, the sensor orientation, and whether the lower sensor receives photons from above, from the side, or from both directions.
This matters because DLI is local. The room does not have one biological DLI in the same way that a thermostat has one room setpoint. Leaves at different heights and positions can accumulate very different daily photon doses even when the timer is identical for every fixture.
Keep the sensor level and avoid shading it
A quantum sensor is designed to respond to light arriving from different angles according to its cosine response. Tilting the sensor changes the measurement plane. Your hand, head, phone, or body can also block or reflect light. Set the sensor at the canopy plane, keep it level, and move yourself away from the incoming light path before recording the value.
This becomes especially important outdoors or in greenhouses, where light arrives from changing angles and includes both direct and diffuse radiation. High-quality sensors are cosine-corrected, but no instrument is perfect. Poor positioning adds avoidable error on top of the sensor’s own uncertainty.
Use a quantum sensor when the number will drive a major decision
Purpose-built quantum sensors measure PPFD directly and remain the reference tool for horticultural photon measurements. Instrument specifications commonly include calibration uncertainty, spectral response, cosine response, linearity, and long-term stability. Those details matter because LEDs can have very different spectral outputs.
A lux meter measures light according to human visual sensitivity. It can be useful for human illumination, but there is no single universal lux-to-PPFD conversion that works across every LED, HPS, fluorescent lamp, sunlight condition, and spectrum. Any conversion factor is source-specific.
Phone apps are estimates unless you validate them
Phone-based PPFD apps can be useful for rough comparisons and for detecting large relative changes, especially when the same phone, diffuser method, fixture spectrum, and geometry are used each time. But the phone’s light sensor or camera was not necessarily designed as a calibrated horticultural quantum sensor.
If you rely on an app, compare it against a trusted quantum meter under the actual fixture and spectrum whenever possible. Record the correction factor and do not assume it remains valid after changing phones, camera settings, diffusers, or spectrum. A calibrated estimate can be useful. An unvalidated number with several decimal places is still an estimate.
Field Advice: Repeatability is often more valuable than false precision. A carefully repeated grid with the same sensor and geometry can reveal whether a change improved the room even when the instrument has a known small absolute error.
Check sensor cleanliness and calibration history
Dust, spray residue, mineral deposits, or scratches on the diffuser can change how a sensor receives light. Clean the instrument according to its manufacturer’s instructions and record calibration or verification dates for serious measurement work. If two sensors disagree, do not immediately assume the plants changed. Compare the instruments side by side under the same stable source.
Measure after the fixture and room reach a stable condition
Some fixtures change output slightly as electronics warm. Dimming systems can also behave differently near their minimum setting. Before building a PPFD map, allow the fixture to reach its normal operating condition. Keep the reflective walls, doors, and room configuration the way they will be during production because reflected photons can affect canopy readings.
“Can I calculate DLI from the PPFD map in the fixture manual?”
Question sent by: Julia Schneider, via contact form.
You can use a credible manufacturer map for planning, but verify the installed system if the decision matters. Published maps may use a different hanging height, test area, wall reflectivity, input power, or measurement method. The plants receive the photons in your room, not in the manufacturer’s test setup.
Calculate DLI Step by Step for Constant and Changing Light
The correct method depends on how light changes during the day. A stable indoor fixture is easy. A dimming schedule, sunlight, greenhouse shade pattern, or mixed sunlight-plus-LED system requires time-resolved integration.
Method 1: constant indoor PPFD
Use this method when the fixture output is stable and the same light level is applied throughout the photoperiod.
- Measure PPFD across the real canopy at the current fixture height and dimmer setting.
- Keep minimum, average, and maximum values.
- Confirm the timer’s actual light-on duration.
- Multiply each PPFD value by light hours and 0.0036.
- Record local minimum DLI, average DLI, and maximum DLI.
If the grid average is 700 µmol/m²/s and the light period is 12 hours, average DLI is 700 × 12 × 0.0036 = 30.24 mol/m²/day. If the minimum mapped point is 520 and the maximum is 880, their local DLIs are 22.46 and 38.02 mol/m²/day. The room does not really deliver “30.24 everywhere.”
A useful lookup table for the arithmetic
| PPFD (µmol/m²/s) | 12 h DLI | 18 h DLI | 20 h DLI |
|---|---|---|---|
| 100 | 4.32 | 6.48 | 7.20 |
| 200 | 8.64 | 12.96 | 14.40 |
| 300 | 12.96 | 19.44 | 21.60 |
| 400 | 17.28 | 25.92 | 28.80 |
| 500 | 21.60 | 32.40 | 36.00 |
| 600 | 25.92 | 38.88 | 43.20 |
| 700 | 30.24 | 45.36 | 50.40 |
| 800 | 34.56 | 51.84 | 57.60 |
| 900 | 38.88 | 58.32 | 64.80 |
| 1000 | 43.20 | 64.80 | 72.00 |
This is a math table, not a target table. It shows what daily photon total results from each combination. Whether a given value is appropriate depends on growth stage, plant health, environment, cultivar, and production goal.
Method 2: several fixed PPFD blocks in one day
If the fixture uses distinct dimming steps, calculate each block separately and add them. Suppose a room runs 300 µmol/m²/s for 4 hours and 600 µmol/m²/s for 8 hours. The first block contributes 4.32 mol/m² and the second contributes 17.28 mol/m². Total DLI is 21.60 mol/m²/day.
The equation becomes:
Total DLI = DLI of block 1 + DLI of block 2 + DLI of every additional block
This method works when each block has a reasonably stable PPFD. If the output ramps continuously, use a logger or numerical integration rather than pretending each ramp is a single constant value.
Method 3: changing PPFD through the day
Outdoors, in a greenhouse, or under dynamic controls, PPFD is a function of time. The formal relationship is the time integral of PPFD across the day, converted from micromoles to moles. In practical terms, a data logger samples PPFD repeatedly and the software sums the photon dose represented by those intervals.
If a logger records one representative PPFD value every five minutes, a simple rectangular approximation is:
DLI ≈ sum of each PPFD reading × 300 seconds ÷ 1,000,000
When light changes quickly, a shorter logging interval improves the approximation. Another common method uses the average of two adjacent readings across each interval, which is equivalent to trapezoidal numerical integration.
Why a noon sunlight reading is not an outdoor DLI
A single midday reading captures one moment near the daily peak. Sun angle, clouds, terrain, buildings, trees, greenhouse framing, and seasonal day length change PPFD continuously. Multiplying a noon value by daylight hours usually overstates the daily total because morning and evening intensities are lower.
For outdoor or greenhouse DLI, use a sensor that logs and integrates light over the full day, or obtain sufficiently frequent PPFD measurements to reconstruct the daily curve. Daily solar-radiation datasets can help with planning, but the actual plant position may receive a different DLI because of shade and structure transmission.
Choose a logging interval that matches how quickly the light changes
There is no single logging interval that is universally correct for every greenhouse, outdoor garden, and dimming program. The interval should be short enough to capture the meaningful changes in the light curve. Stable indoor LEDs can be characterized with a few verified output states. Rapid cloud movement, shade from nearby structures, or automated ramping requires more frequent sampling.
For discrete data, one simple approach assumes each recorded PPFD applies until the next reading. A better approximation when PPFD changes continuously is the trapezoidal method: average two adjacent PPFD readings, multiply that average by the number of seconds between them, repeat for every interval, add the photon totals, then divide by 1,000,000. The shorter the interval relative to the speed of the light change, the less of the curve is missed.
Do not invent precision that the logger cannot support. If a sensor records every 15 minutes on a day with fast broken clouds, the calculated DLI is an approximation of a highly variable curve. Record the interval alongside the result so future comparisons use the same method.
Account for photoperiod changes before you touch the dimmer
A photoperiod change can create a large DLI step even when PPFD is untouched. At 500 µmol/m²/s, an 18-hour day provides 32.4 mol/m²/day. Switching to 12 hours at the same intensity drops the daily total to 21.6, a one-third reduction. To mathematically preserve 32.4 mol/m²/day across 12 hours, average PPFD would have to rise to 750 µmol/m²/s.
That calculation is useful for understanding the size of the transition. It is not an instruction to jump a newly transitioned canopy immediately from 500 to 750 PPFD. Plants acclimate to light, flowering changes canopy structure and water demand, and room conditions may need to be adjusted. Use the math to quantify the change, then increase intensity deliberately and verify plant response.
Preserving DLI is not always the correct transition goal
When the photoperiod changes, developmental state and dark-period signaling change too. The previous vegetative DLI is a useful reference, not a rule that must be reproduced on day one of flowering. Stage, acclimation, cultivar, climate capacity, and the intended production strategy all matter.
Method 4: greenhouse sunlight plus supplemental LEDs
The cleanest approach is to place a suitable quantum sensor at canopy height and integrate the combined sunlight and electric light that actually reaches the crop. If you calculate the components separately, add sunlight DLI and supplemental-light DLI only when the measurements represent the same area and you are certain the same photons are not counted twice.
For planning, outside DLI multiplied by an estimated greenhouse transmission can approximate inside sunlight, but real transmission changes with sun angle, glazing cleanliness, structural shading, curtains, condensation, and season. Direct inside measurement is stronger evidence.
Calculate a DLI map, not just one number
If your indoor fixture is stable, use the same photoperiod multiplier for every point on the PPFD grid. That converts the PPFD map directly into a DLI map. The process makes weak corners and strong centers easier to compare in daily-dose terms.
For example, under a 12-hour schedule:
- 500 PPFD = 21.60 mol/m²/day
- 700 PPFD = 30.24 mol/m²/day
- 900 PPFD = 38.88 mol/m²/day
A canopy spanning those three levels is not receiving one uniform daily dose. The DLI map helps you decide whether fixture height, dimmer output, spacing, side reflection, or canopy layout should be adjusted before increasing the room average.
Round only after the calculation
Sensor accuracy, spatial variability, and plant-to-plant differences are larger than tiny decimal changes. Keep enough precision during the calculation, then report a practical value such as 30.2 rather than 30.239999. Avoid implying laboratory precision when the PPFD input came from a phone app or a single hand-held reading.
Pro Tip: Save the raw PPFD readings as well as the DLI result. If you change the photoperiod later, you can recalculate the daily dose without remapping the room, provided fixture height, dimmer output, canopy plane, and room geometry have not changed.
Interpret DLI With Photoperiod, Stage, Environment, and Genetics
DLI becomes useful only when the number is interpreted in context. Cannabis-specific research shows strong responses to light quantity, but it does not provide one universal daily photon requirement for every cultivar and stage.
Research numbers are boundary examples, not a cannabis DLI prescription
Cannabis studies make more sense when their PPFD, photoperiod, and DLI are read together. In the 2021 indoor light-gradient experiment, flowering plants received roughly 120 to 1,800 µmol/m²/s for 12 hours. The simple conversion places those treatments at about 5.2 to 77.8 mol/m²/day. The study is valuable because it shows the scale of light environments cannabis has been tested under, but the highest treatment should not be copied as a default.
A 2024 two-cultivar photoperiod study held canopy PPFD near 540 µmol/m²/s and compared 12- and 13-hour flowering days. The authors reported DLIs of 23.8 and 25.7 mol/m²/day. Because the light intensity was similar, the extra hour increased the daily photon dose while also changing the photoperiod itself. That design is a useful reminder that DLI and day length can change together, making biological interpretation more complicated than a single dose number.
A 2025 vegetative night-break study reported about 29.4 versus 21.2 mol/m²/day and found lower vigor and later floral biomass in the lower-DLI treatment. Again, that result does not turn 29.4 into a universal vegetative target. The useful lesson for this calculation guide is that daily photon accounting can reveal a treatment difference that a simple label such as “vegetative lighting” would hide.
| Research context | Light information | What the DLI calculation helps reveal | What it does not prove |
|---|---|---|---|
| Indoor flowering light gradient | About 120-1,800 PPFD, 12 h | A very wide experimental daily photon range. | That the maximum DLI is a universal target. |
| 12 h vs. 13 h flowering | About 540 PPFD, different day lengths | One extra hour increases daily photons even without a major PPFD change. | That equal DLI would make the two photoperiods biologically identical. |
| Vegetative night-break comparison | Reported about 29.4 vs. 21.2 DLI | Daily photon supply can differ substantially between schedules that both maintain vegetative development. | A single universal vegetative optimum. |
DLI is a photon budget, not an electricity-efficiency metric
Two fixtures can deliver the same canopy DLI while consuming different amounts of electricity. DLI measures photons received by the canopy. Fixture photon efficacy, electrical power, optical losses, room reflectivity, driver efficiency, and HVAC load determine how much energy and money were required to deliver those photons.
This distinction matters when growers try to “optimize DLI.” Maximizing daily photons without considering fixture efficacy and environmental load can increase operating cost faster than crop value. A lighting plan should therefore separate three questions: How many photons reach the canopy? How uniformly are they delivered? How much electrical and climate-control energy is required to deliver them?
Growth stage changes the useful DLI range
Unrooted cuttings, seedlings, established vegetative plants, and mature flowering canopies have different leaf area, root capacity, transpiration, and developmental goals. Propagation studies often use substantially lower PPFD than flowering studies. That difference is one reason a single life-cycle DLI target is not useful.
For stage-specific starting ranges, use the dedicated PPFD/DLI-by-stage resource once it is live. This article deliberately avoids turning the calculation guide into a second stage-target page.
Vegetative DLI can affect later performance
A 2025 cannabis night-break study compared a conventional vegetative lighting program with a lower-DLI program that interrupted the night. Reducing vegetative DLI from about 29.4 to 21.2 mol/m²/day was associated with weaker vegetative vigor and roughly 22% lower extractable floral biomass later in the crop. That does not establish 29.4 as a universal optimum. It does show that vegetative daily photon supply can have consequences that appear later.
Flowering response can continue across high DLI in controlled research
In one indoor cannabis experiment, canopy PPFD ranged from about 120 to 1,800 µmol/m²/s under a 12-hour photoperiod. That corresponds to approximate DLIs from 5.2 to 77.8 mol/m²/day. Dry inflorescence yield increased across the tested range even though leaf-level photosynthesis saturated at lower light. Another controlled experiment found yield and specialized-metabolite production increasing as flowering PPFD rose from 600 to 1,000 µmol/m²/s.
These studies demonstrate cannabis’ capacity to use high light under specific controlled conditions. They do not prove that 78 mol/m²/day is a sensible target for every home grow. Electricity cost, fixture efficiency, room heat, humidity removal, irrigation capacity, carbon dioxide, cultivar, canopy architecture, and the value of incremental yield all change the practical ceiling.
Do not turn a research maximum into a home-grow target
A treatment that produced more biomass in a controlled experiment is evidence of biological response under those conditions. It is not an instruction to reproduce the highest tested DLI. Use research to understand response, then choose a working dose your entire system can support.
Genetics and phenotype change the response
Cannabis cultivars differ in morphology, leaf arrangement, flowering response, vigor, and tolerance to environmental stress. Even genetically identical clones can develop different canopies when root volume, training, irrigation, or microclimate differ. DLI should therefore be recorded alongside cultivar and phenotype notes rather than treated as a detached room number.
Carbon dioxide changes the high-light conversation, but not the arithmetic
The DLI calculation itself does not change with carbon dioxide concentration. The plant’s ability to benefit from high photon delivery may change. At elevated light, carbon dioxide, temperature, nutrition, and water supply become increasingly important parts of the response. Do not use a CO₂ chart as permission to ignore heat, humidity, irrigation, or human safety.
Temperature and VPD can change what the plant can use
High photon loads can raise leaf temperature and drive faster water use. If the room is already hot or dry, increasing DLI can turn a marginal environment into visible stress. Conversely, a cool, humid room may have different transpiration limitations. The correct calculation does not tell you whether climate control is adequate.
Root-zone health sets a practical ceiling
A root system suffering from low oxygen, disease, severe salinity, repeated drought, or chronic overwatering cannot be expected to use an aggressive lighting program like a healthy root system. Before increasing DLI, confirm that irrigation, EC, pH, drainage, and root-zone temperature are stable for the chosen growing medium.
Photoperiod cultivar versus autoflowering cultivar
Autoflowering cannabis is less dependent on a deliberate short-day switch for floral initiation, so growers often use longer schedules such as 18 or 20 hours through flowering. That means the same PPFD produces a much higher DLI than it would under 12 hours. Calculate the actual total before copying a flowering PPFD target developed around a 12-hour photoperiod.
Longer schedules are not automatically more efficient. More hours add photons, electrical cost, and potentially heat load. The relevant comparison is yield or quality gained per additional photon and per unit of electricity, not simply the highest achievable DLI.
Avoid the Common DLI Calculation and Measurement Mistakes
DLI errors usually fall into three groups: wrong units, wrong PPFD input, or wrong biological interpretation. The formula is simple enough that the arithmetic itself is rarely the real problem.
Mistake 1: multiplying by minutes instead of hours
The 0.0036 shortcut assumes the photoperiod is entered in hours. If you enter minutes, the answer will be wrong by a factor of 60. Use the full unit conversion when you are uncertain.
Mistake 2: forgetting that µmol and mol differ by one million
PPFD is measured in micromoles per square meter per second. DLI is reported in moles per square meter per day. The 1,000,000 conversion is built into the 0.0036 shortcut. Do not divide by one million again after using 0.0036.
Mistake 3: using the fixture’s PPF instead of canopy PPFD
PPF describes the total photons emitted by the fixture in µmol/s. PPFD describes photons arriving on each square meter of canopy. You cannot insert total fixture PPF into the DLI formula as if it were PPFD. Fixture output must be distributed over area, and optical losses plus geometry matter.
Mistake 4: using one center PPFD reading
A single center value usually represents one of the strongest points under the fixture. Multiplying that reading by photoperiod produces the DLI of that point, not the entire grow. Map the canopy first.
Mistake 5: confusing spatial average with local exposure
An average DLI is useful for room-level comparisons, but it does not mean every branch receives the average. Keep the distribution data. A 30 mol/m²/day average can conceal a 20 mol edge and 42 mol hotspot.
Mistake 6: using a noon sunlight reading as the daily average
Sunlight forms a curve across the day. A midday value is not the time average. Use integrated measurement or time-resolved readings.
Mistake 7: converting lux to PPFD with one universal factor
Lux weights light according to the human eye. The ratio between lux and PPFD changes with spectrum. A conversion factor calibrated for one LED cannot automatically be used for another fixture or sunlight.
Mistake 8: mixing 400-700 nm PPFD with 400-750 nm ePPFD
If one meter includes far-red photons and another does not, their readings can differ even at the same location. Record the waveband. Do not compare DLI and eDLI as if they were the same measurement.
Mistake 9: trusting a fixture map after changing height or canopy position
PPFD distribution changes when fixture height changes. The canopy also moves upward as plants grow. Recalculate after major fixture moves, canopy stretch, training changes, or layout changes.
Mistake 10: assuming dimmer percentage equals PPFD percentage
A dimmer set to 50% is not proof that every canopy point receives exactly half the PPFD measured at 100%. Driver response, fixture behavior, and room reflection can make the relationship non-linear. Measure the actual output at the new setting.
Mistake 11: assuming constant output during ramping schedules
If a controller simulates sunrise and sunset or changes intensity during the day, a single peak PPFD multiplied by total light hours will overstate DLI. Integrate the actual profile.
Mistake 12: treating equal DLI as equal plant response
Equal total photons do not make photoperiod and instantaneous intensity irrelevant. This is especially important for flowering photoperiod cannabis.
| Problem | What the number may look like | What to check next |
|---|---|---|
| Center-only measurement | DLI looks high and impressive. | Map corners and edges at the same canopy height. |
| Wrong photoperiod entered | DLI jumps or falls with no hardware change. | Verify timer schedule and actual on/off times. |
| Phone/app bias | Readings disagree strongly with another instrument. | Validate against a quantum sensor under the same spectrum. |
| Spectrum changed | Same fixture power but sensor relationship changes. | Check sensor spectral suitability and measurement waveband. |
| Canopy grew closer to fixture | DLI rises even though dimmer is unchanged. | Measure fixture-to-canopy distance and remap. |
| Dynamic sunlight | Spot calculation differs from logged daily total. | Use integrated PPFD across the full day. |
“My app says 900 PPFD and my meter says 760. Which DLI should I use?”
Question sent by: MapleGrower, via Facebook page.
Do not average two instruments just because they disagree. First compare them side by side under the same fixture and geometry, confirm the meter’s calibration and spectral suitability, and check whether the app requires a diffuser or device-specific correction. Use the measurement method you can validate and repeat.
Remember: The most dangerous DLI error is not a small rounding difference. It is using a number that does not represent the actual canopy and then making a large lighting change because the arithmetic looks authoritative.
Mistake: treating a single sunny day as the outdoor season
Outdoor DLI changes with day length, sun angle, cloud cover, smoke, terrain, and shade from structures or vegetation. A full-day logger measurement on a clear June day describes that day and location. It does not prove that the same plant receives that DLI in August, during a cloudy week, or after a nearby tree canopy fills in.
For outdoor records, save the date, location, sensor position, weather notes, and daily total. Repeated measurements across the season are far more useful than one impressive peak-day number. The goal is to understand the seasonal light pattern, not to find the brightest day and treat it as normal.
Mistake: hiding the error budget behind too many decimals
A DLI calculation may be numerically exact while the measurement is uncertain. Sources of uncertainty include sensor calibration, spectral mismatch, cosine response, sensor leveling, shading by the operator, fixture warm-up, grid spacing, canopy height differences, timer accuracy, and temporal variation. Those errors do not simply disappear because the spreadsheet reports 31.847 mol/m²/day.
You usually do not need to combine every source of uncertainty into a formal laboratory error budget for grow-room management. You do need to know which errors are likely to dominate your setup. A validated quantum sensor and a poor one-point map can still give a poor canopy estimate. A dense spatial map made with an unvalidated phone app can be repeatable but biased. A useful record states the instrument and method so the number can be interpreted honestly.
Mistake: averaging manufacturer maps without reproducing the test geometry
A PPFD map is inseparable from its test conditions. Hanging height, footprint size, wall reflectivity, fixture power, dimmer setting, sensor type, and map grid all affect the values. If you copy the published average but install the fixture closer, over a smaller area, or in a more reflective room, your canopy may receive a different PPFD and DLI.
Use manufacturer data to plan fixture count and initial height. Then ground-truth the installed system. Record the fixture model, actual draw if known, dimmer setting, distance from fixture to canopy, occupied footprint, map grid, minimum/average/maximum PPFD, and calculated DLI. That record turns a marketing chart into a reproducible cultivation measurement.
Verify the Result With a Repeatable Measurement Loop
A good DLI workflow is not “calculate once and forget.” Plants grow into the light field, fixtures move, dimmers change, reflectors get dirty, canopies become denser, and seasons change. Build a loop that makes the measurement repeatable.
Step 1: define the decision before measuring
Write down what you are trying to decide. Examples include: verify the current daily dose, compare two dimmer settings, check whether the flowering flip reduced DLI too far, test whether fixture height improved uniformity, or quantify supplemental light in a greenhouse.
A defined question prevents random measurements from turning into data without a decision.
Step 2: record the system state
Before measuring, record cultivar, stage, date, fixture model or identifier, dimmer setting, fixture height, photoperiod, canopy height, room temperature, relative humidity, carbon dioxide strategy if relevant, and any recent training or transplant event. These notes make later comparisons meaningful.
Step 3: measure PPFD with a repeatable grid
Use the same positions and canopy reference plane each time. Allow the fixture to stabilize. Keep the sensor level. Record raw readings rather than only the calculated average.
Step 4: calculate local and average DLI
For stable electric light, multiply each PPFD point by photoperiod and 0.0036. For dynamic light, integrate time-resolved readings. Keep minimum, average, and maximum values.
Step 5: compare the DLI with plant and environmental data
Look at more than leaf appearance. Check irrigation frequency, substrate dry-back, EC trend, leaf temperature where available, room heat, humidity removal, canopy posture, new growth, and whether symptoms are localized to the highest-light positions.
If the center shows bleaching or upward leaf edges while the corners remain healthy, the problem may be distribution rather than the room average. If the entire canopy is stressed after a large DLI increase, investigate both light and the environmental systems that support it.
Step 6: change one major variable at a time
If you simultaneously change dimmer output, fixture height, photoperiod, irrigation EC, fan speed, and temperature setpoint, you will not know which change caused the result. When safety allows, adjust one major lighting variable, record the new map, then observe the response.
Step 7: allow the canopy to respond
Do not judge a lighting change solely from the first hour unless there is obvious acute stress. Water use, growth rate, leaf position, and canopy temperature may take time to settle into the new condition. The appropriate observation window depends on stage and the size of the change.
Step 8: remeasure after canopy movement
During rapid vegetative growth or flowering stretch, the canopy can move significantly closer to the fixture. Even if dimmer output stays constant, local PPFD can rise. Recheck after substantial height change, fixture movement, pruning, trellising, or major canopy reshaping.
Step 9: keep a lighting log
A useful log contains date, stage, photoperiod, grid readings, minimum/average/maximum PPFD, minimum/average/maximum DLI, fixture height, dimmer setting, room conditions, irrigation observations, and the reason for any change. Over several cycles, this becomes far more valuable than a generic target chart because it records what your room and cultivars actually did.
A DLI change is not verified until the new dose is measured
If you raise the dimmer because a calculation suggested a shortfall, measure the canopy again. Dimmer percentage, fixture height, and manufacturer output claims are control settings, not proof of the final PPFD or DLI.
When to stop increasing light
Stop and investigate when additional light produces worsening canopy temperature, unstable irrigation demand, localized bleaching, persistent upward leaf margins, rapidly increasing root-zone EC, reduced canopy posture, or declining quality without a clear gain. Those signs are not all specific to light, so diagnose the whole system rather than assuming a single cause.
Economic limits can appear before biological limits. If another 10% of electrical input produces a small or uncertain production gain while adding cooling and dehumidification cost, the higher DLI may not be the better operating point.
When to lower light temporarily
Transplant shock, root disease, irrigation failure, severe nutrient imbalance, heat stress, pest damage, or a damaged canopy can reduce the plant’s ability to use the current light load. Temporarily reducing PPFD may be appropriate while the limiting problem is corrected. Recalculate the resulting DLI so the recovery setting is documented rather than guessed.
Use a compact DLI audit log
A DLI record becomes much more valuable when it can be compared with the next measurement. The minimum useful log links the photon measurement to the geometry and operating schedule that produced it.
| Record field | Example entry | Why keep it |
|---|---|---|
| Date and stage | Day 12 flowering | Prevents comparisons between different developmental conditions without context. |
| Fixture and setting | Fixture A, 70% dimmer | Makes the output state reproducible. |
| Fixture-to-canopy distance | 42 cm | Explains changes caused by plant stretch or fixture movement. |
| PPFD min / avg / max | 520 / 690 / 845 | Preserves distribution instead of only the mean. |
| Photoperiod | 12.0 h | Required to reproduce constant-light DLI. |
| DLI min / avg / max | 22.5 / 29.8 / 36.5 | Shows the range of daily dose across the mapped canopy. |
| Sensor / method | Quantum sensor, 4 × 4 equal-area grid | Makes measurement quality and repeatability visible. |
| Environment / plant response | Leaf temperature stable, no upper-canopy bleaching | Connects photon dose to the system that must use it. |
| Action and recheck date | Raised fixture 3 cm, remap tomorrow | Turns the log into a verification loop. |
Verify a change with the same geometry, not a new measuring method
If you raise the light, dim the fixture, rearrange plants, or change the photoperiod, repeat the measurement with the same grid and sensor whenever practical. Changing the measurement method at the same time makes it harder to tell whether the system changed or only the measurement changed.
Compare the before-and-after minimum, average, maximum, and uniformity pattern. Then watch the crop over an appropriate interval rather than making multiple lighting corrections in the same day. A useful DLI workflow is iterative: measure, calculate, adjust one variable, allow the canopy to respond, then verify.
Know when you must remap instead of merely recalculating
You can recalculate DLI from an existing PPFD map after a timer-only change if fixture output, fixture position, canopy height, canopy footprint, and room geometry remain effectively unchanged. You should remap when fixture height changes, the dimmer changes, plants stretch substantially, fixtures are repositioned, reflective surfaces change, the canopy footprint changes, or interlighting is added.
This distinction saves time without sacrificing data quality. A timer change changes the time multiplier. A geometry or output change can change the PPFD field itself.
Use a Final DLI Calculation Checklist
The best DLI calculation is one another grower could reproduce from your notes. Before using the number to change a lighting program, run through the checklist below.
Before you trust the daily-light number
- PPFD was measured at the actual canopy plane.
- The canopy was mapped instead of relying on one center reading.
- Minimum, average, and maximum PPFD were recorded.
- The sensor was level, clean, and suitable for the fixture spectrum.
- The actual timer schedule was verified.
- Constant-light calculations used DLI = PPFD × hours × 0.0036.
- Dynamic sunlight or dimming schedules were integrated over time rather than estimated from one peak reading.
- Traditional PPFD/DLI and ePPFD/eDLI were not mixed without labeling the waveband.
- Fixture PPF was not substituted for canopy PPFD.
- Lux-to-PPFD conversions were not treated as spectrum-independent.
- Equal DLI was not assumed to mean equal photoperiod or biological response.
- The result was interpreted in the context of stage, cultivar, temperature, humidity, CO₂ strategy, irrigation, and root health.
- Any major lighting change was followed by a new PPFD map and DLI calculation.
A compact working procedure
If you want the entire method in one sequence, use this:
- Measure: map PPFD at the productive canopy.
- Calculate: convert each point to DLI using the real photoperiod, or integrate a changing light profile.
- Compare: keep minimum, average, and maximum daily dose.
- Interpret: consider stage, photoperiod, cultivar, climate, roots, water, and carbon dioxide.
- Adjust: change one major lighting variable.
- Verify: remap the canopy and watch plant plus environmental response.
- Record: keep the result so the next cycle starts from evidence rather than memory.
What DLI is best at doing
DLI is strongest when it answers comparative questions. How much did the daily photon dose change after the flowering flip? Did raising the fixture improve uniformity without reducing the average too far? Did a longer autoflower schedule unintentionally push the daily total much higher? Is the greenhouse receiving enough supplemental light during a cloudy week? Those are questions DLI can answer clearly.
What DLI cannot decide by itself
DLI cannot tell you the ideal spectrum, guarantee yield, diagnose every light-stress symptom, set a flowering photoperiod, confirm adequate carbon dioxide, or tell you whether the root zone can support the dose. It is one measurement in a cultivation system.
Master Advice: Treat DLI as a calibrated daily-light accounting tool. The number becomes useful when it is built from representative measurements and linked to a documented plant response.
The practical finish
For a stable indoor room, DLI can be calculated in less than a minute. Measure representative canopy PPFD, multiply by the actual light hours and 0.0036, then keep the minimum, average, and maximum. For sunlight or changing output, log the PPFD curve and integrate it across the day.
The central rule is simple: do not spend more time polishing the formula than validating the PPFD that goes into it. A representative measurement plus a transparent calculation is more valuable than an impressive target copied from another room.
Share this article
A quick overview of the topics covered in this article.
- Start With the Correct DLI Question and Formula
- Understand What DLI Measures and What It Does Not
- Measure PPFD Correctly Before You Calculate DLI
- Calculate DLI Step by Step for Constant and Changing Light
- Interpret DLI With Photoperiod, Stage, Environment, and Genetics
- Avoid the Common DLI Calculation and Measurement Mistakes
- Verify the Result With a Repeatable Measurement Loop
- Use a Final DLI Calculation Checklist
Follow us
Latest articles
October 18, 2026
October 18, 2026
October 18, 2026
October 18, 2026