Cannabis Light Spectrum Guide: Blue, Green, Red, and Far-Red
For decades, indoor cannabis growers judged lighting fixtures almost entirely by total electrical wattage or human-visible brightness. The arrival of solid-state light emitting diodes (LEDs) transformed horticultural physics, shifting the focus from gross electrical power to the spectral composition of delivered photons. While light intensity determines the total energy available to drive photosynthesis, light spectrum acts as a biological control system, dictating plant architecture, stem elongation, leaf surface area, stomatal conductance, and secondary metabolite accumulation.
Photosynthetically active radiation (PAR) has traditionally been defined as wavelengths between 400 and 700 nanometers (nm). However, modern plant physiology demonstrates that wavelengths outside this historical boundary, particularly far-red photons up to 750 nm, actively participate in photosynthetic carbon fixation and developmental signaling. A plant does not perceive light as a single blended color; rather, specialized photoreceptors track specific wavebands across the electromagnetic spectrum to adjust growth in real time.
Misconceptions regarding spectral wavebands remain common in retail cultivation media. Common myths suggest that green light is useless because leaves appear green, that blue light should be completely eliminated during bloom, or that red light alone produces the highest quality flowers. In commercial practice, single-color recipes frequently induce physiological disorders, whereas balanced broad-spectrum delivery optimizes whole-canopy quantum yield.
This guide provides a comprehensive, research-grounded analysis of the four primary wavebands used in modern cannabis cultivation: blue (400-500 nm), green (500-600 nm), red (600-700 nm), and far-red (700-750 nm). It explains the physiological mechanisms of each band, establishes evidence-backed operational ratios for vegetative and flowering phases, highlights misleading commercial marketing claims, and presents a structured framework for evaluating spectral power distribution charts.
Understanding PAR and ePAR: How Plants Process Photons
To understand light spectrum, cultivators must first separate human vision from plant photobiology. Human eyes perceive brightness through photopic sensitivity curves centered strongly around yellow-green light (approximately 555 nm). Lighting metrics designed for humans, such as lumens and lux, severely distort how a cannabis canopy captures energy because they understate the contribution of deep blue and deep red photons.
Photosynthetically Active Radiation (PAR vs ePAR)
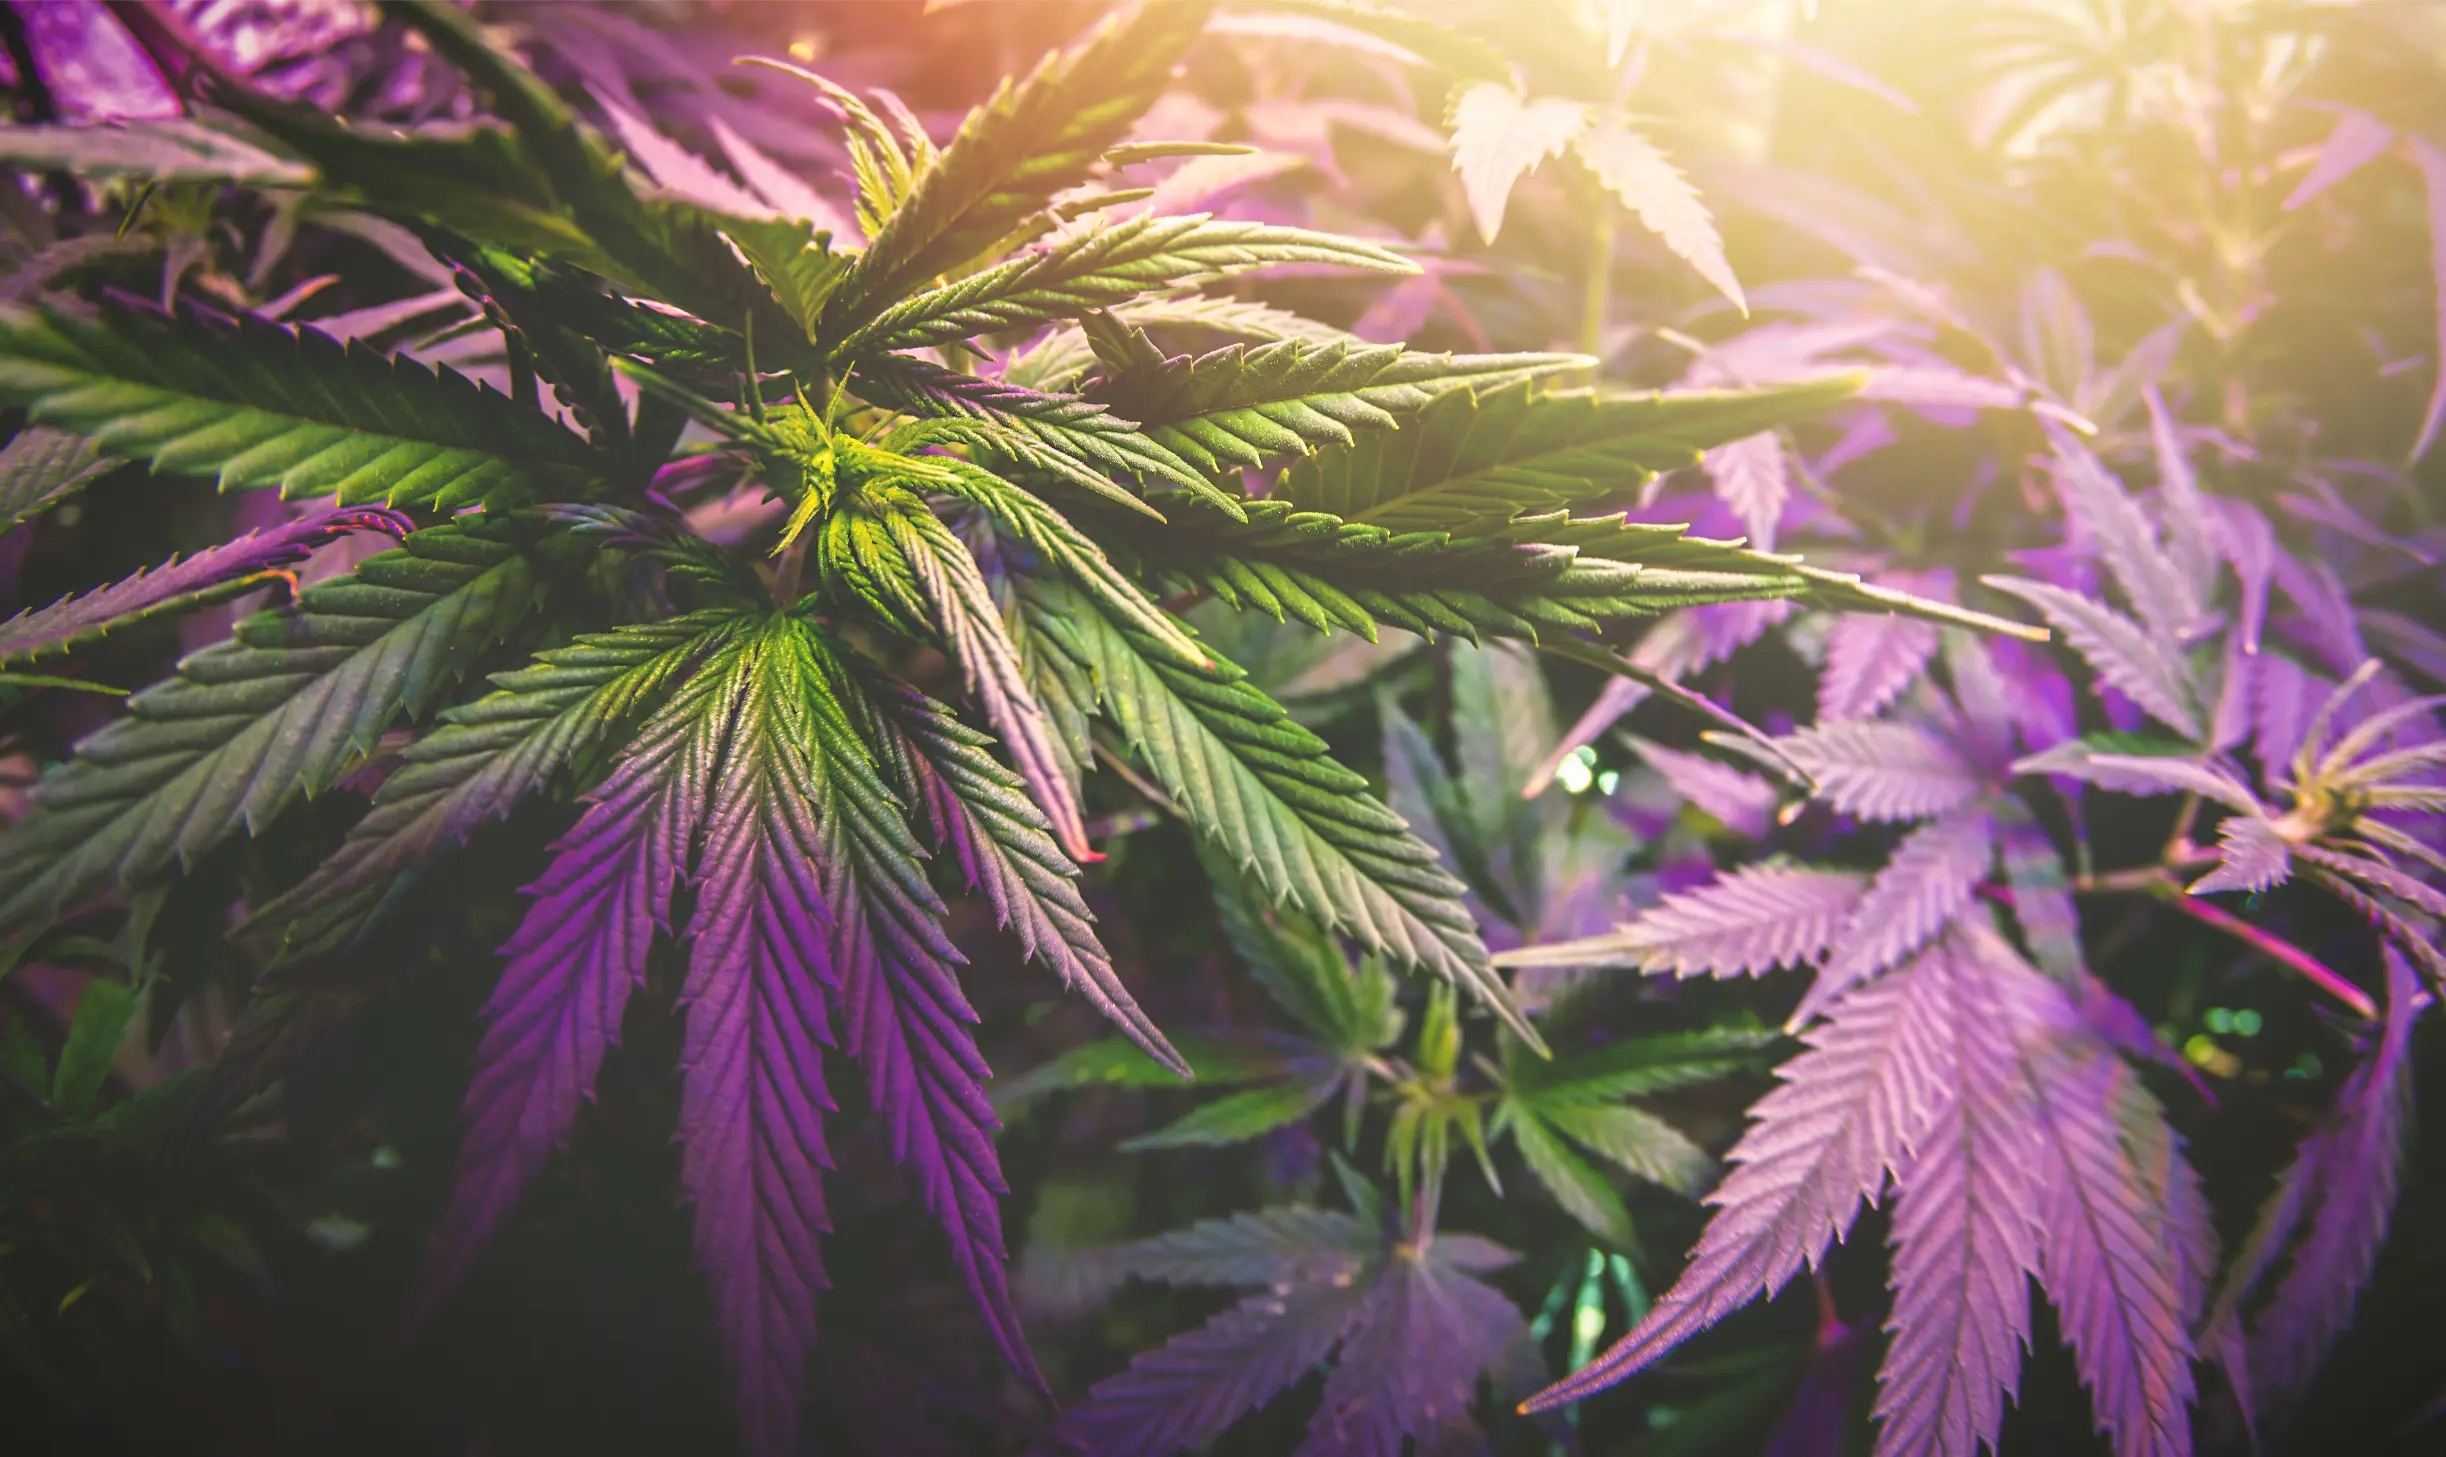
PAR defines the spectral waveband between 400 and 700 nanometers that drives chlorophyll-mediated photosynthesis. Extended PAR (ePAR), formalized in recent horticultural research, expands this boundary from 400 to 750 nanometers to include far-red photons, which synergistically drive photosynthesis when delivered alongside shorter wavebands.
In the 1970s, Dr. K.J. McCree quantified the photosynthetic action spectrum of higher plants, proving that all photons between 400 and 700 nm drive photosynthesis, but with varying relative quantum efficiency. While chlorophyll a and chlorophyll b show isolated absorption peaks in the blue (430-450 nm) and red (640-660 nm) spectrums when extracted in organic solvents, intact living leaves contain dense networks of accessory pigments, including carotenoids, lutein, and anthocyanins. These accessory pigments absorb intermediate wavelengths and transfer the captured excitation energy directly to reaction center chlorophylls via resonance.
Remember: Quantum yield measures the moles of carbon fixed per mole of photons absorbed. On an instantaneous single-leaf basis, red photons deliver the highest quantum yield of photosynthesis. However, on a whole-plant canopy basis, an overabundance of red light without supporting wavebands creates canopy shading, saturated top leaves, and structural deficiencies.
Furthermore, plants utilize light for more than carbon assimilation. Specialized biological photoreceptors monitor light quality to guide plant morphology and developmental timing:
- Phytochromes: Pigment proteins that alternate between two reversible states (Pr and Pfr) in response to red (660 nm) and far-red (730 nm) ratios, governing shade avoidance, internode stretch, and flowering induction.
- Cryptochromes and Phototropins: Blue and UVA photoreceptors that control circadian rhythms, stomatal opening, phototropic bending, and chloroplast movement within cells.
Blue Light (400-500 nm): Photomorphogenesis and Structure
Blue light encompasses high-energy photons with wavelengths between 400 and 500 nanometers, peaking around 450 nm in standard commercial LED phosphor coatings. While blue photons possess higher energy per quantum than red or green photons, that excess energy is dissipated as heat through non-photochemical quenching within photosystems. The true value of blue light in cannabis cultivation is structural rather than purely energetic.
Inhibition of Hypocotyl and Stem Elongation
Blue light directly activates cryptochrome photoreceptors, which signal the down-regulation of gibberellin synthesis and stimulate lateral stem thickness. Cannabis grown under a high proportion of blue photons (18% to 25% of total PAR) develops short internodal spacing, robust petioles, thicker leaf laminas, and strong, stocky branches capable of bearing heavy colas later in bloom.
Stomatal Regulation and Gas Exchange
Blue photons provide the primary trigger for stomatal opening. Guard cells surrounding leaf stomata contain phototropins that activate proton-pumping enzymes upon absorbing blue light, drawing potassium ions inward and causing the cells to swell. This opens the stomatal pore, allowing carbon dioxide (CO2) to diffuse into the leaf interior while permitting transpirational water loss to pull essential nutrients (calcium, magnesium, and nitrates) up from the root zone.
Excessive Blue Light in Late Flower Reduces Total Harvest Biomass
While blue light is essential for vegetative compact structure, delivering more than 15% to 18% blue photons during mid-to-late flowering reduces total dry flower yield. Because blue photons carry higher electrical energy but exhibit lower quantum efficiency than red photons, excessive blue light diverts energy into photoprotection rather than floral biomass accumulation. Keep blue light between 10% and 14% during generative flowering.
Conversely, completely eliminating blue light creates a severe morphological disorder known as “red light syndrome.” Cannabis plants grown under pure red monochromatic light exhibit leaf epinasty (severe downward curling), disrupted stomatal responsiveness, sluggish transpiration, and reduced photosynthetic capacity.
Cultivar Variation: Sativa vs Indica Blue Light Sensitivity
Not all cannabis cultivars respond to blue light identically. Narrow-leaflet equatorial cultivars (commonly referred to as sativas) evolved in regions receiving intense solar radiation with a naturally high blue-to-red ratio. When grown indoors under warm-spectrum, red-heavy discharge lamps, these genetics exhibit aggressive internodal stretching that quickly outgrows typical indoor ceiling heights. Supplying an elevated blue photon fraction (20% to 24%) during the first three weeks of 12/12 acts as an environmental brake, holding vertical stretch to manageable proportions.
Conversely, broad-leaflet alpine cultivars (indicas originating from Afghan or Pakistani valleys) possess a genetically compact growth habit. Subjecting these cultivars to excessive blue light during vegetative growth can produce overly dense, cabbage-like plant architecture where inner fan leaves overlap tightly, creating localized microclimates of stagnant air that encourage early Botrytis or powdery mildew outbreaks. For broad-leaflet genetics, maintain a moderate blue ratio (14% to 16%) to encourage adequate branch expansion and air circulation.
Tip: In multi-cultivar grow rooms, group your tall, stretch-prone sativa-dominant phenotypes directly beneath the central fixture zones where blue photon flux is highest, while placing compact indica cultivars along the outer canopy perimeter.
Green Light (500-600 nm): Deep Canopy Penetration and Scouting
The persistent myth that plants do not use green light represents one of the most widespread misunderstandings in horticultural lighting. This myth originated from simplified chlorophyll extraction charts, which show minimal absorption between 500 and 600 nm when isolated pigments are dissolved in glass test tubes. In a living, multilayered cannabis canopy, green light plays an indispensable role in whole-plant productivity.
The “Green Window” and Mesophyll Transmittance
Red and blue photons are absorbed with extreme efficiency in the upper 20% of a palisade leaf cell. As a result, when intense red and blue light strikes a dense cannabis canopy, the topmost leaves absorb nearly all incoming photons, leaving the middle and lower foliage in profound light starvation. In contrast, green photons have a lower absorption coefficient per chloroplast layer, allowing them to penetrate deep into the lower spongy mesophyll of the leaf and filter through to sub-canopy layers.
Research by Terashima et al. demonstrated that under intense irradiance (such as high-intensity horticultural lighting), green light drives carbon assimilation more efficiently than red or blue light in deeper cellular layers. The upper chloroplasts become light-saturated, meaning additional blue or red photons are largely wasted as thermal dissipation, whereas unattenuated green photons penetrate downward to activate unsaturated lower chloroplasts.
Can green light during the dark cycle cause hermaphrodites or disrupt flowering?
Question sent by: Wyatt Miller, via email.
In theory, dim green light has a minimal effect on phytochrome photostationary state, which led to the traditional practice of using green headlamps for night inspections. However, recent peer-reviewed studies show that cryptochromes and certain phytochromes do detect green photons at moderate intensities. A low-intensity green work light used briefly for an emergency irrigation check is generally safe, but continuous or high-intensity green light during the 12-hour dark cycle can disrupt photoperiodic floral timing and cause intersex (hermaphroditic) development in sensitive cultivars. Keep the dark period completely dark whenever possible.
Diagnostic and Scouting Advantages
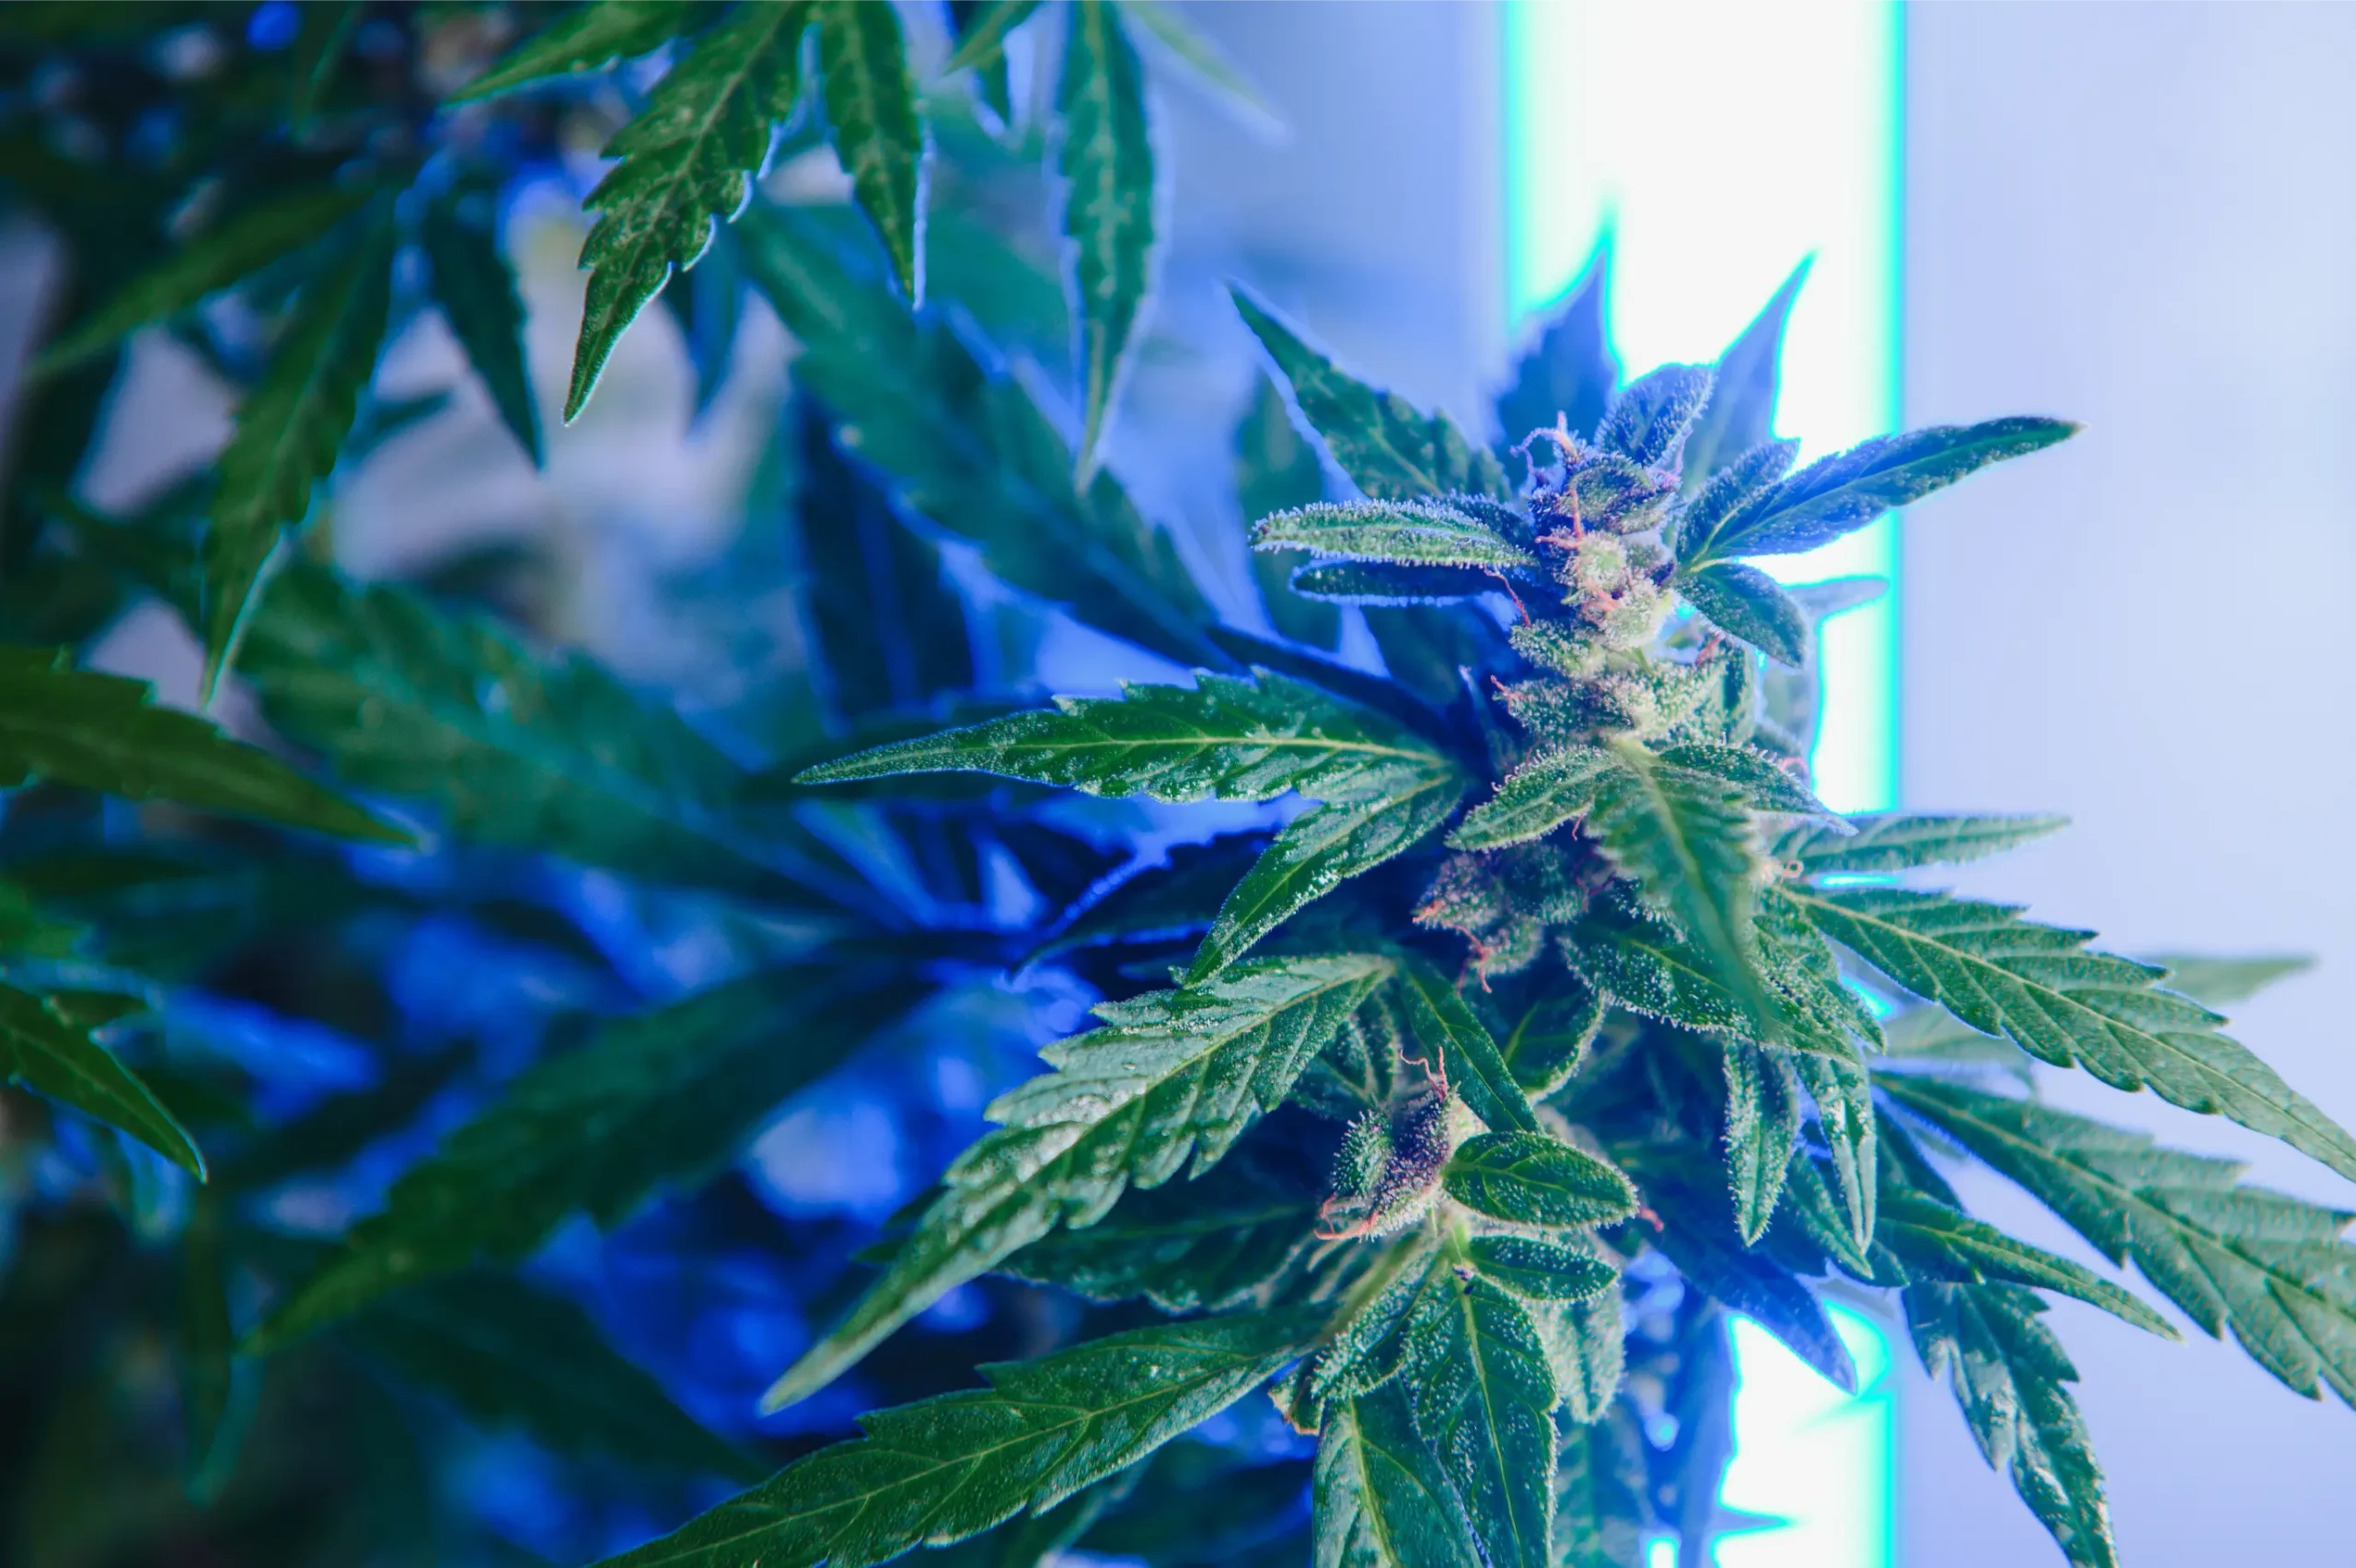
Beyond internal leaf physics, green light transforms the practical human management of an indoor garden. Narrow-band “blurple” (red plus blue) fixtures produce a disorienting, high-contrast purple environment where human eyes cannot detect subtle foliar variations. Broad-spectrum fixtures containing 35% to 45% green light provide clean, neutral white illumination, allowing cultivators to spot early spider mite stippling, powdery mildew mycelium, calcium deficiencies, and aphid colonies long before infestations become severe.
Red Light (600-700 nm): The Photosynthetic Engine of Biomass
Red light is the primary driver of dry biomass accumulation and floral expansion in cannabis cultivation. Covering the spectral range between 600 and 700 nanometers, red photons coincide precisely with the primary absorption peak of chlorophyll a and chlorophyll b (specifically centered around 660 nm, known as deep red or hyper red).
Maximum Quantum Efficiency of Photosynthesis
According to the McCree action spectrum, red photons deliver the highest quantum yield of carbon assimilation per absorbed photon of any waveband in the visible spectrum. Red photons carry less raw energy per quantum than blue photons, but because photosynthesis is a quantum process (one absorbed photon excites one electron through the electron transport chain regardless of wavelength), red light converts electrical energy into carbohydrates with maximum efficiency.
Modern commercial LED luminaires leverage high-efficiency 660 nm monochromatic diodes (such as Osram Oslon Square or Samsung LH351H) that achieve fixture efficacies exceeding 3.8 to 4.2 micromoles per joule. Combining broad-spectrum white diodes with targeted 660 nm deep red chips enables fixtures to achieve overall system efficiencies of 2.7 to 3.1 umol/J, driving dense floral swelling and heavy colas.
Do
Prioritize High 660 nm Red Ratios During Flowering
Select fixtures that deliver 50% to 65% of their total photon flux in the red waveband (600-700 nm) to maximize photosynthetic quantum yield and flower density during bloom.
Avoid
Attempt Growing Under Monochromatic Red Light Alone
Do not use purely red diodes without supporting blue and green photons, as red light syndrome induces downward leaf curling, non-responsive stomata, and compromised plant vigor.
Balancing Red with Supporting Wavebands
While red light drives raw yields, over-saturating the canopy with red photons without adequate blue and green creates leggy, structurally fragile plants with thin stems and loose flower clusters. A high red-to-blue ratio signals to the plant that it is shaded by competitors, triggering rapid stem elongation. To maintain tight, high-density floral clusters, red photons must be anchored by a steady baseline of blue photons (minimum 10% to 12%) throughout the flowering cycle.
Red-to-Far-Red Ratio (R:FR) in Canopy Management
The physiological driver of stem elongation is not simply the raw quantity of red or far-red light, but the calculated ratio between them. In unshaded outdoor sunlight, the red-to-far-red ratio (R:FR) measures approximately 1.15 to 1.25. Under an indoor LED fixture enhanced with high 660 nm deep red and minimal far-red, the R:FR ratio can exceed 4.0 to 6.0, signaling to the plant that it enjoys full, unobstructed sunlight and suppressing upward stretch.
When cultivators intentionally drop the R:FR ratio below 0.8 by adding supplemental 730 nm diodes, the phytochrome equilibrium rapidly shifts toward the Pr form. This tricks the canopy into responding as if it were shaded by a competing vegetative layer, triggering rapid petiole extension and leaf blade enlargement. When managed precisely, this response increases light interception across the entire horizontal trellis before bud development begins.
Field Advice: If you utilize spectrum-tunable LED bars, run a high R:FR ratio (minimal far-red) during the first 14 days of flowering to keep internodes tight and bud sites close together. From Week 3 onward, reintroduce far-red at an R:FR ratio of approximately 1.5 to 2.0 to activate the Emerson effect and maximize total carbon assimilation through harvest.
Far-Red Light (700-750 nm): The Emerson Effect and Shade Avoidance
Far-red radiation spans the transitional boundary between visible red light and invisible infrared radiation, covering wavelengths from 700 to 750 nanometers (peaking around 730 nm). For decades, far-red photons were dismissed by traditional plant biology as photosynthetically inactive because single-wavelength testing above 685 nm results in a steep drop-off in photosynthesis, a phenomenon known as the “red drop.”
The Emerson Enhancement Effect
In 1957, biophysicist Robert Emerson made a landmark discovery: when plants receive shorter-wavelength red light (660 nm) and far-red light (730 nm) simultaneously, the resulting rate of photosynthesis is significantly higher than the sum of the rates obtained when either waveband is delivered independently. Photosynthesis relies on two light-harvesting protein complexes working in series: Photosystem II (PSII, optimized for shorter red photons around 680 nm) and Photosystem I (PSI, optimized for longer far-red photons around 700 nm).
Under standard indoor lighting lacking far-red photons, Photosystem II becomes over-excited while Photosystem I operates below capacity, creating an electron bottleneck. Introducing far-red photons excites PSI, clearing the bottleneck and accelerating linear electron transport through the photosynthetic chain. Recent research led by Dr. Shuyang Zhen and Dr. Bruce Bugbee confirmed that far-red photons (700-750 nm) drive photosynthesis with efficiency equal to traditional PAR photons when delivered alongside shorter visible wavelengths.
Phytochrome Equilibrium and Shade Avoidance
Plants utilize phytochrome pigments to monitor canopy density. Active phytochrome (Pfr) absorbs far-red light and converts back into inactive phytochrome (Pr). In natural environments, dense green leaves absorb red light while transmitting far-red. When a cannabis plant detects an increased ratio of far-red to red light, it senses that it is being shaded by taller competing vegetation.
This triggers the classical “shade avoidance response”:
- Substantial acceleration of stem and internodal elongation.
- Increased leaf lamina surface area to capture more scattered light.
- Thinning of leaf cross-sectional thickness.
- Accelerated flowering transition in photoperiod-sensitive cultivars.
Should supplemental far-red run all day or only at lights-off?
Question sent by: Ethan Brooks, via email.
It depends on your physiological objective. To exploit the Emerson enhancement effect and accelerate photosynthesis through Photosystem I, 730 nm far-red photons must be delivered simultaneously alongside shorter red photons throughout the main photoperiod. Conversely, if your goal is strictly photoperiod manipulation (accelerating the night cycle transition), run far-red for only 10 to 15 minutes immediately following main lights-off as an End-of-Day (EOD) treatment. Running high far-red all day without tight canopy management triggers excessive stem elongation.
Managing Stretch When Adding Supplemental 730 nm Far-Red
During an experimental flower cycle with an aggressive OG Kush cultivar, I installed supplemental 730 nm far-red bar modules and operated them continuously alongside the main broad-spectrum lights at full power from Day 1 of 12/12. By Day 18, the plants had stretched over 220% vertically, developing excessive spacing between nodes and pushing the top colas within five inches of the heat sinks. The canopy became unmanageable, requiring aggressive trellis netting and super-cropping to prevent severe light bleaching.
The takeaway: Far-red light is an exceptionally potent morphological stimulant. Running continuous high far-red during the stretch phase (Weeks 1 to 3 of bloom) can double internodal spacing in stretch-prone cultivars. Instead, minimize supplemental far-red during early bloom, and apply it primarily after vertical elongation stabilizes (Week 4 onward) to harness the Emerson enhancement effect without sacrificing bud density.
Master Advice: End-of-Day (EOD) far-red lighting involves illuminating the canopy with 10 to 15 minutes of pure 730 nm light immediately after main lights turn off. This rapidly converts active Pfr into inactive Pr, signaling to the plant that night has fallen instantly rather than waiting for slow natural thermal relaxation. In some commercial facilities, EOD far-red can accelerate flower initiation by 2 to 4 days, but it must be calibrated carefully to prevent excessive stretch.
Matching Spectral Ratios to Vegetative and Flowering Stages
Because the biological priorities of cannabis shift from structural vegetative growth to floral biomass accumulation, an optimal lighting strategy adjusts spectral ratios to match developmental stage. While multi-channel spectrum tuning fixtures offer dynamic control, understanding target ratios allows growers to select fixed-spectrum fixtures that deliver the best operational balance.
The reference matrix below establishes standard, research-aligned spectral waveband distributions across each phase of cannabis development:
| Waveband | Wavelength (nm) | Primary Photoreceptor | Main Biological Role | Veg Target (%) | Bloom Target (%) |
|---|---|---|---|---|---|
| Blue Light | 400-500 nm | Cryptochromes, Phototropins | Stem suppression, stomatal opening, compact nodes | 18% – 24% | 10% – 14% |
| Green Light | 500-600 nm | Accessory Carotenoids | Deep sub-canopy penetration, human scouting visibility | 30% – 40% | 25% – 35% |
| Red Light | 600-700 nm | Chlorophyll a & b, Phytochromes | Maximum quantum yield, carbon fixation, floral mass | 40% – 50% | 50% – 65% |
| Far-Red Light | 700-750 nm | Phytochrome (Pfr to Pr) | Emerson enhancement effect, leaf expansion, stretch control | 2% – 5% | 6% – 10% |
Stage-by-Stage Implementation Guidelines
- Clones and Seedlings (DLI: 10-15 mol/m2/day): Benefit from higher blue ratios (20% to 25%) at low intensity. Blue light stimulates rapid early root development and keeps tender seedlings from stretching into weak, spindly stems.
- Vegetative Stage (DLI: 25-35 mol/m2/day): Broad-spectrum white light with a correlated color temperature (CCT) of 4000K to 5000K delivers balanced blue and green, building dense foliage, thick branches, and tight internodes that support heavy canopy loads.
- Early Flowering / Stretch Phase (Weeks 1-3, DLI: 35-45 mol/m2/day): Limit supplemental far-red light to prevent unmanageable internode stretching. Maintain 12% to 15% blue light to keep plants structurally compact as floral sites initiate.
- Mid-to-Late Flowering (Weeks 4-8, DLI: 40-50+ mol/m2/day): Shift to high red (55% to 65%) with moderate far-red (6% to 8%) to maximize photosynthetic carbon assimilation and flower swelling.
- Final Senescence / Flush (Final 7-10 Days): Reduce overall PPFD by 20% to 30%. Excessive light intensity and high thermal radiation during late ripening volatilize delicate monoterpenes (myrcene, terpinolene, and limonene), reducing final flower aroma and bag appeal.
Common Spectrum Myths, Blurple Pitfalls, and Marketing Traps
The commercial horticultural lighting sector has historically relied on dramatic marketing claims that exaggerate the impact of specialized spectrums while downplaying fundamental principles of total photon delivery. Understanding these marketing traps protects cultivators from wasting capital on underperforming equipment.
The Rise and Fall of Narrow-Band “Blurple” Lighting
First-generation LED grow lights combined red (660 nm) and blue (450 nm) monochromatic diodes, creating an eerie magenta or “blurple” illumination. Manufacturers claimed that because chlorophyll absorbs primarily in red and blue, providing only those two wavebands was 100% efficient with zero wasted energy.
Commercial growers quickly realized the fatal flaws of blurple lighting:
- Severe Lower Canopy Starvation: Monochromatic red and blue photons are completely absorbed by the topmost layer of foliage, leaving lower canopy leaves unproductive and decaying.
- Zero Human Diagnostic Capability: In a purple environment, growers cannot detect pest infestations, mold, or nutrient deficiencies until irreversible damage occurs.
- Lower Overall Quantum Yield: Modern phosphor-converted broad-spectrum white diodes (utilizing high-efficiency blue pumps coated with rare-earth garnets) achieve superior system efficacies, rendering narrow-band blurple fixtures technologically obsolete.
Can a specialized light spectrum dramatically increase THC percentage by itself?
Question sent by: Julia Schneider, via contact form.
No. Controlled scientific research across commercial cannabis genetics demonstrates that cannabinoid potency (THC/CBD concentration) is primarily dictated by plant genetics, total accumulated photon dose (Daily Light Integral), and root-zone health. While spectral manipulation (such as high blue or controlled ultraviolet exposure) can slightly alter terpene ratios and stimulate secondary defense metabolites, it cannot turn an 18% THC cultivar into a 28% THC cultivar. Light spectrum fine-tunes plant morphology and resin density, but genetics establish the hard ceiling.
The comparison matrix below highlights the practical differences between legacy narrow-band blurple lights, standard broad-spectrum white fixtures, and modern broad-spectrum arrays enhanced with deep red and far-red diodes:
| Fixture Architecture | Typical System Efficacy (PPE) | Canopy Penetration | Diagnostic Scouting Quality | Morphological Balance | Commercial Cultivation Verdict |
|---|---|---|---|---|---|
| Narrow-Band “Blurple” (Red + Blue Only) | 1.2 – 1.8 umol/J | Poor (Zero Green Transmission) | Severely Compromised (Dark Purple Tint) | Prone to red light syndrome, epinasty | Obsolete; avoid for modern cultivation |
| Broad-Spectrum White (3000K – 4000K Phosphor) | 2.2 – 2.6 umol/J | Moderate to High (Good Green Depth) | Excellent (Natural Neutral White) | Balanced branching, normal internodes | Reliable all-around standard for veg and bloom |
| Broad-Spectrum + 660nm + 730nm | 2.7 – 3.2 umol/J | Maximum (Full ePAR Penetration) | Excellent (White with Rosy Tint) | Optimized quantum yield, high bud density | Current gold standard for commercial yield and quality |
Important: Beware of retail fixtures advertising “programmable color wheels” or ten different spectrum switches. In commercial practice, constant manual spectrum shifting stresses plants and complicates environmental management. A well-engineered, broad-spectrum white fixture supplemented with 660 nm deep red and controlled far-red outperforms complex spectral tuning in virtually every commercial yield trial.
How to Read a Spectral Power Distribution (SPD) Chart
When selecting a commercial horticultural luminaire, the Spectral Power Distribution (SPD) graph is the single most important diagnostic document provided by the manufacturer. An SPD graph plots relative radiant power (or photon flux) on the vertical y-axis against wavelength in nanometers (from 380 to 800 nm) on the horizontal x-axis.
Measuring Spectral Wavebands: PAR vs ePAR Quantum Meters
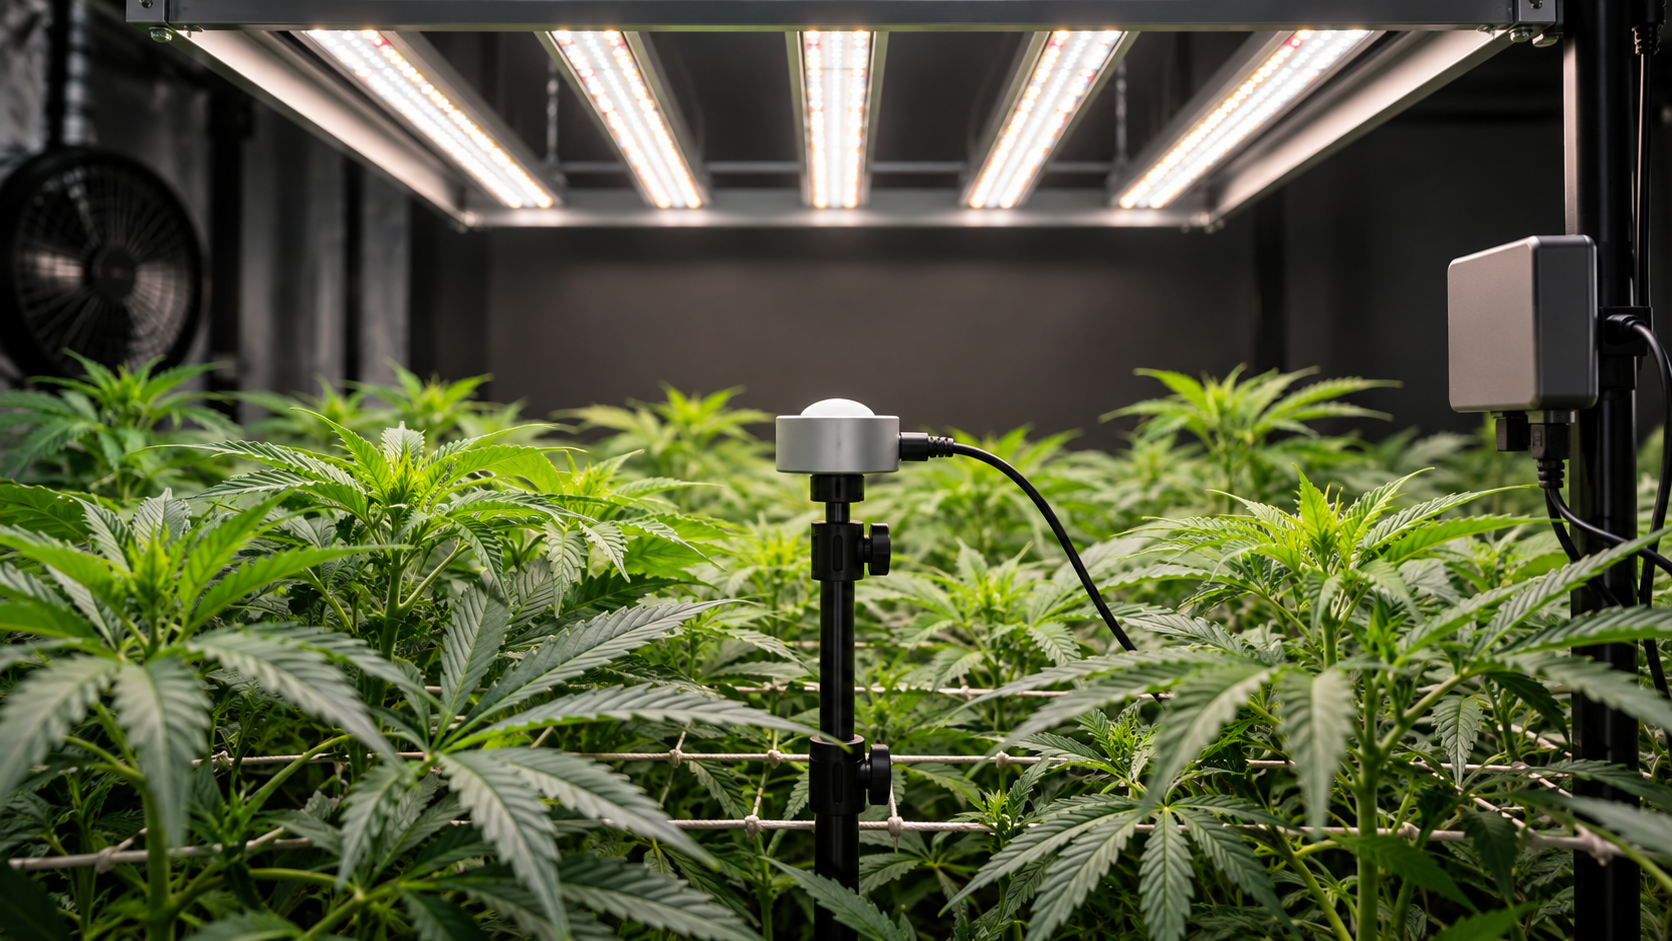
A critical diagnostic limitation in commercial cultivation is relying on standard 400-700 nm quantum PAR sensors (such as the traditional Apogee SQ-500 series) when operating modern fixtures with substantial far-red output. Standard quantum meters incorporate optical filters that cut off sharply at 700 nm, completely ignoring photons in the 700 to 750 nm range. If you measure a fixture delivering 10% far-red using a standard PAR meter, the displayed PPFD reading will be roughly 10% lower than the true photon flux reaching the canopy.
To accurately evaluate extended spectra, cultivators must utilize an extended PAR (ePAR) sensor (such as the Apogee SQ-610 series) sensitive from 400 to 750 nm, or invest in a handheld horticultural spectrometer. Spectrometers provide a complete real-time breakdown of spectral power distribution, calculating exact micro-mole fractions for blue, green, red, and far-red wavebands directly at the canopy level.
- Step 1: Check the Blue Peak (440-460 nm): A quality horticultural fixture displays a sharp, controlled spike around 450 nm, representing the high-efficiency blue pump diode. In a vegetative-oriented fixture, this blue peak should reach 70% to 90% of the maximum red peak. In a dedicated flowering fixture, the blue peak should measure roughly 30% to 45% of the red peak.
- Step 2: Inspect the Green Trough (520-580 nm): Broad-spectrum white LEDs produce a broad, rolling plateau through the green waveband. Verify that green light is not zero. A balanced horticultural fixture maintains a green plateau at 30% to 50% of the peak red output, confirming adequate sub-canopy penetration and visual scouting capability.
- Step 3: Measure the Deep Red Spike (660 nm): Look for an intense, narrow peak at exactly 660 nm. This confirms the integration of high-efficiency monochromatic deep red diodes rather than relying purely on phosphor conversion, ensuring high overall photon efficacy.
- Step 4: Verify the Far-Red Slope (700-750 nm): Observe the curve beyond 700 nm. A modern extended PAR (ePAR) fixture displays a deliberate shoulder or secondary peak centered around 730 nm. Ensure far-red does not exceed 10% to 12% of total photon flux to prevent excessive canopy stretching.
Grow Light Spectrum Selection and Verification Protocol
- Obtain third-party integrating sphere test reports (such as DLC Horticultural listing or university testing) rather than relying on marketing graphics.
- Verify that total fixture efficacy exceeds 2.6 umol/J across the 400-700 nm PAR (or 400-750 nm ePAR) waveband.
- Confirm the presence of minimum 10% to 15% blue photons to guarantee proper stomatal conductance and suppress excessive internode stretching.
- Ensure green waveband constitutes 25% to 40% of total output to facilitate sub-canopy light penetration and natural pest inspection.
- Confirm high deep-red (660 nm) output to maximize Photosystem II excitation and dry floral biomass accumulation.
- Check the far-red (730 nm) fraction to verify it remains within a safe 5% to 10% window to avoid runaway canopy elongation.
- Inspect canopy growth after 14 days under the fixture: verify healthy horizontal fan leaf presentation without downward leaf curling (epinasty) or excessive internode stretching.
Executing this verification sequence across successive harvest cycles transforms lighting from an unpredictable risk into a calibrated production variable. Cultivators who systematically audit spectral delivery at canopy height eliminate localized leaf bleaching, prevent unmanageable internodal stretching, and ensure their electrical investment yields dense, uniform, premium-grade flower from the top colas down to the secondary trellis net.
Furthermore, maintaining diligent spectral records alongside daily environmental telemetry (including leaf surface temperature and vapor pressure deficit) allows head growers to pinpoint precisely how individual cultivars respond to specific red-to-blue or red-to-far-red ratios over time.
Weedth Verdict: There is no single universal spectrum that maximizes every biological attribute of cannabis simultaneously. Vegetative growth prioritizes blue-mediated photomorphogenic compactness, while floral development demands the sheer energetic driving power of 660 nm deep red complemented by penetrating green and Photosystem I-activating far-red. Master growers do not chase mythical full-spectrum marketing labels: they deliver the exact photon wavelengths required by each physiological stage of development.
Mastering the cannabis light spectrum is fundamentally about precision control rather than purchasing the most aggressive marketing claims. By matching distinct photon wavebands to the plant biological priorities at each phase of development, you create an indoor growing environment where every kilowatt-hour of grid electricity is converted into usable biomass, potent resin glands, and consistent commercial profits.
To continue developing your technical cultivation facility, examine our companion foundational guides on root-zone environments, fundamental plant physiology, and indoor room commissioning:
Share this article
A quick overview of the topics covered in this article.
Follow us
Latest articles
October 28, 2026
October 28, 2026
October 28, 2026