Moisture Sensors and Automated Cannabis Irrigation: TDR Telemetry, Solenoid Control, and Closed-Loop Fertigation
In modern commercial cannabis cultivation, the traditional practice of scheduling irrigation events by arbitrary calendar timers or lifting containers by hand has been rendered obsolete by precision root-zone telemetry. Commercial facilities now manage root zones as dynamic biochemical bio-reactors, utilizing high-frequency digital sensors to capture real-time Volumetric Water Content (VWC), bulk electrical conductivity (ECb), pore-water electrical conductivity (σp), and root-zone temperature simultaneously. When these digital sensors are interfaced with industrial programmable logic controllers (PLCs), environmental computers, and solenoid valve manifolds, irrigation transforms from a passive guesswork chore into an automated, closed-loop crop steering system. Automated sensor-driven fertigation allows cultivators to execute precision vegetative and generative steering strategies: pulsing exact milliliter shot volumes to maintain stable container capacity plateaus during rapid canopy expansion, or enforcing deep overnight dry-backs that signal floral ripening, tighten internodal stretch, and stimulate secondary cannabinoid and terpene synthesis. However, deploying automated moisture sensing requires understanding the underlying physics of dielectric permittivity, sensor wave propagation, medium-specific calibration, and solenoid hydraulic integration. Novice operators who install probes improperly or program raw VWC thresholds without filtering noise frequently cause disastrous irrigation loops that drown root systems. This comprehensive guide establishes the scientific principles, sensor technologies, electrical hardware, and automation sequences required to master automated cannabis irrigation, linking directly with our foundational guides on cannabis dry-back and VWC targets, leaching fractions and runoff dynamics, and watering cannabis in soil.
The transition toward telemetry-guided fertigation represents a paradigm shift from calendar schedules to biofeedback irrigation. In conventional cultivation facilities, irrigation timers fire at pre-set hours regardless of whether plants experienced low light, high relative humidity, or sluggish transpiration. When transpiration stalls under cloudy skies or HVAC dehumidifier cycling, fixed-timer pulses pump unnecessary nutrient solution into cold, saturated pots. Conversely, during sudden vapor pressure deficit spikes, plants transpire at accelerated rates, causing root zones to dry out prematurely and suffer severe osmotic stress before the next scheduled timer event. Automated moisture sensors eliminate this mismatch by continuously reporting the exact hydration status of the porous matrix. By establishing mathematical thresholds for shot triggers, runoff collection, and overnight dry-down targets, commercial growers achieve optimal root oxygenation, minimize nutrient waste, and produce dense, chemically uniform floral harvests across large commercial canopy footprints.
Root-Zone Telemetry Metrics: Dielectric Permittivity, Bulk EC, Pore-Water EC, and Temperature
To interpret digital sensor data streams and program automation algorithms, cultivators must understand the physical and chemical metrics reported by root-zone instrumentation:
- Volumetric Water Content (VWC %): The ratio of the volume of liquid water to the total bulk volume of the container substrate: VWC = (Vwater / Vtotal) × 100. Unlike gravimetric moisture testing (which requires drying and weighing soil samples), VWC provides a continuous non-destructive metric that reflects real-time hydration across coco coir, rockwool, and living soil beds. High-porosity rockwool can achieve 85% peak VWC, while structured peat blends reach container capacity near 55% to 60%.
- Apparent Dielectric Permittivity (εa): Dielectric sensors do not measure water directly: they measure the ability of the substrate matrix to hold an electric charge when exposed to high-frequency electromagnetic fields. Air has a dielectric constant of 1.0; dry mineral soil and rockwool fibers range from 3.0 to 5.0; while pure water has an exceptionally high dielectric constant of approximately 80.0 at 20 °C. Because water possesses a dielectric constant nearly twenty times higher than any other substrate component, high-frequency electromagnetic pulses can determine volumetric water content with ±1% accuracy, completely independent of substrate fertilizer salt levels.
- Bulk EC (ECb) vs. Pore-Water EC (σp): Inexpensive conductivity wands measure bulk EC: the average electrical conductivity of the entire root zone (solid particles, air pockets, and liquid combined). Bulk EC fluctuates wildly whenever substrate moisture drops, making it useless for monitoring actual fertilizer strength. Professional crop-steering sensors utilize the Hilhorst model to calculate pore-water EC (σp): the true electrical conductivity of the microscopic water films coating root hairs. Pore-water EC represents the actual osmotic suction experienced by cannabis root cells.
- Root-Zone Temperature: Embedded thermistors measure substrate temperature at root depth. Root metabolic activity, active ion uptake, and dissolved oxygen consumption peak between 18 °C and 22 °C (64 °F to 72 °F). Substrates exceeding 24 °C experience rapid oxygen depletion and pathogen proliferation, while substrates dropping below 15 °C halt phosphorus and water uptake.
The Sensor Physics: Why Resistance Probes Fail and Dielectric Probes Excel
Many novice cultivators purchase inexpensive dual-prong analogue moisture probes from local garden centers. These budget meters operate on electrical resistance (DC conductivity). If your substrate contains fertilizer salts, a resistance probe will register “Wet” even when the root ball is completely bone dry. Professional digital crop-steering sensors (such as the Meter Group TEROS 12, Aroya Solus, or TrolMaster WCS-1) operate at 70 MHz high-frequency Frequency-Domain Reflectometry (FDR) or Time-Domain Reflectometry (TDR). High-frequency electromagnetic charging polarizes water molecules without being distorted by dissolved fertilizer ions, providing true volumetric measurement.
Sensor Physics and Substrate Calibration: TDR vs FDR vs High-Frequency Capacitance Probes
Commercial facilities select instrumentation based on measurement accuracy, telemetry refresh rates, and substrate compatibility. Time-Domain Reflectometry (TDR) systems transmit electromagnetic wave pulses along parallel waveguides, recording the nanosecond reflection time at the probe boundary. Because the propagation velocity of electromagnetic energy along the wave guide is inversely proportional to the square root of the apparent dielectric permittivity, TDR provides absolute scientific precision across extreme salinity ranges (0 to 15 dS/m EC). This makes TDR the gold standard for agricultural university laboratories and controlled-environment cannabis research institutes.
Frequency-Domain Reflectometry (FDR) and high-frequency capacitance sensors charge an alternating electromagnetic field within the porous substrate at fixed frequencies (typically 50 MHz to 70 MHz). By measuring the charging time of the capacitor formed by the substrate matrix and the probe needles, FDR sensors calculate dielectric permittivity rapidly with low electrical power consumption. Commercial multi-sensor platforms integrate FDR sensors directly into RS-485 Modbus networks, allowing hundreds of bench probes to feed live telemetry data into environmental software dashboards every sixty seconds without draining battery reserves.
Crucially, apparent dielectric permittivity does not translate into volumetric water content through a universal mathematical formula. Peat moss blends, compressed coconut coir fibers, and bonded basalt rockwool possess vastly divergent dry bulk densities, surface electrical charges, and bound-water fractions. When high-frequency electromagnetic waves encounter water molecules bound tightly to organic matter surfaces, those bound molecules rotate less freely, exhibiting an apparent dielectric permittivity lower than bulk free water. If a grower applies a standard mineral soil calibration curve to horticultural rockwool, the sensor will register an artificial error of up to 15% VWC. Professional crop-steering software packages allow operators to select certified calibration polynomials tailored specifically to their brand and density of stone wool, coco coir, or potting substrate.
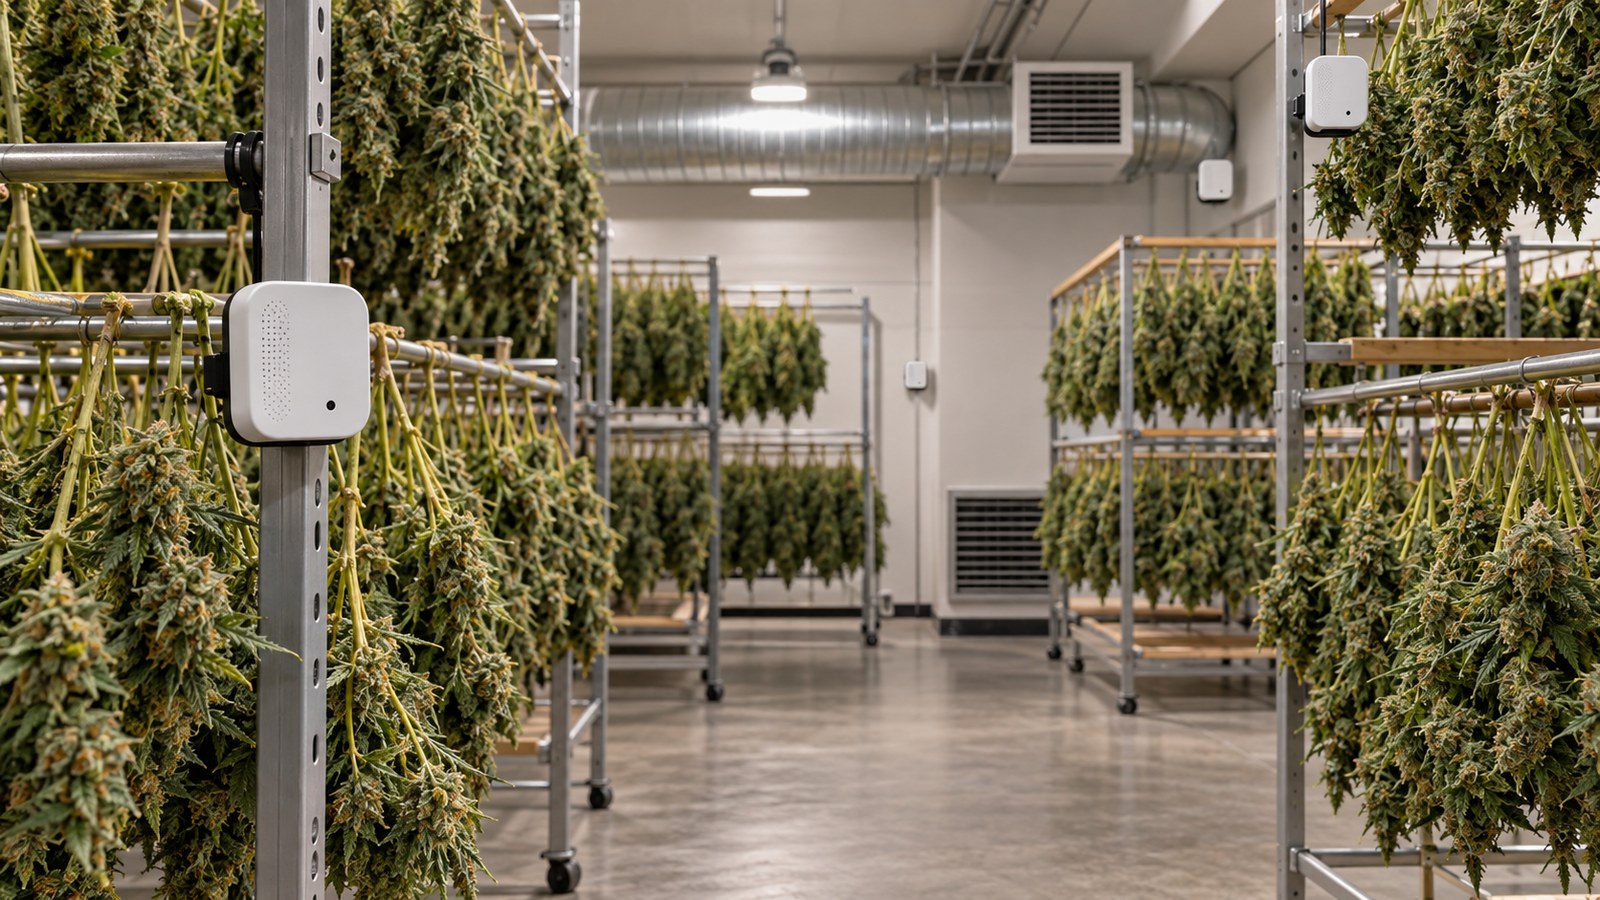
Precision sensor probe hardware installed in representative root zones to monitor volumetric water content and electrical conductivity.
Sensor Placement Protocols: Insertion Angles, Root-Zone Depth, and Index Selection
Even the most advanced dielectric sensor produces misleading telemetry if installed incorrectly. Cultivators must adhere to rigid physical installation standards to capture representative data streams. Probe needles must always be inserted horizontally, strictly parallel to the container base. If needles are inserted vertically from the top surface downward, irrigation water dripping from surface emitters naturally channels along the smooth stainless steel rods. This gravitational tracking artificially pools water directly adjacent to the sensing field, causing the probe to report saturation while the remainder of the container remains dry. In stone wool blocks and slabs, inserting probe needles horizontally into the side wall also ensures the waveguides cross perpendicular to the vertical basalt fibers, capturing true matrix suction.
The vertical height of the sensor within the substrate container dictates the operational meaning of the telemetry curve. In a standard two-gallon or three-gallon nursery container or fabric pot, probe needles should be positioned in the lower-middle third, approximately 1.5 to 2.5 inches above the container floor. Positioning sensors too high in the top third results in measuring surface evaporation rather than active root uptake, leading controllers to trigger premature irrigation pulses. Conversely, placing probes flush against the bottom container floor exposes the needles to the perched water table that naturally forms in container media, registering permanent 100% saturation even when the upper root zone is desiccated.
Selecting representative index plants across large commercial benches requires rigorous statistical sampling. Cultivators should never install sensor probes in perimeter plants exposed to high velocity convective airflow from HVAC discharge ducts or wall-mounted circulation fans. Similarly, plants situated directly beneath overlapping light fixture hotspots or undersized runts with restricted root systems must be excluded. Index plants should be chosen from the central canopy zone, exhibiting median height, healthy internodal branching, uniform leaf area index, and standard water consumption. Commercial grow rooms typically assign at least three to five index probes per irrigation zone, averaging the live readings to filter out individual container anomalies before triggering solenoid valves.
| Sensor Technology Type | Primary Measurement Principle | Measurement Frequency Range | Salinity (EC) Interference Resistance | Best Cultivation Media Application |
|---|---|---|---|---|
| Time-Domain Reflectometry (TDR) | Waveform travel time down waveguides | 500 MHz – 1.5 GHz | Maximum: completely immune to EC swings | Research facilities, stone wool slabs, high EC runs |
| High-Frequency Capacitance / FDR | Capacitor charge time in soil field | 50 MHz – 70 MHz | Excellent: calibrated up to 8.0 dS/m EC | Commercial production: Aroya, TrolMaster, Meter Group |
| Porous Ceramic Tensiometers | Mechanical vacuum matric tension | Static hydraulic vacuum (0-100 cbar) | Total immunity: measures physical suction | Living organic soil beds, outdoor native soil |
| DC Electrical Resistance Probes | Direct current electrical resistance | Direct Current (0 Hz) | Unusable: fertilizer salts create false wet readings | Cheap consumer gadgets; avoid in commercial cultivation |
The technical specifications detailed in Table 1 demonstrate why high-frequency dielectric instrumentation has become the undisputed standard for modern commercial cannabis production. While mechanical tensiometers excel in large living organic soil beds by quantifying soil matric suction, their slow hydraulic response time and maintenance requirements make them unsuitable for high-frequency pulse fertigation in stone wool and coconut coir. High-frequency capacitance and FDR probes deliver the microsecond responsiveness required to capture rapid moisture pulses and transpirational depletion curves. However, when growers begin analyzing real-time dielectric telemetry graphs during the photoperiod, they frequently observe sharp fluctuations in pore-water electrical conductivity that seem to defy basic logic. As the root zone dries down between irrigation pulses, the reported electrical conductivity often surges significantly higher than the input fertilizer solution, leading inexperienced operators to suspect equipment malfunction or nutrient toxicity.
Why does my substrate sensor show pore-water EC skyrocketing during the dry-back when I haven’t added any fertilizer?
Question sent by: Marcus Sterling, via email.
“I am monitoring my flowering cannabis in coco coir using Aroya sensors. My input feed EC is 2.2 dS/m. Right after my morning P1 irrigation shots, the sensor reads 2.6 dS/m pore-water EC. But after an 18% overnight dry-back, the sensor shows pore-water EC climbing all the way to 5.4 dS/m before lights-on! Are my plants burning in their sleep, or is my sensor broken?”
Your sensor is operating with perfect mathematical precision, and your plants are completely safe: you are witnessing the fundamental physical chemistry of pore-water concentration during transpirational dry-back.
Digital crop-steering sensors calculate pore-water electrical conductivity (σp) using the Hilhorst model. Pore-water EC measures the concentration of dissolved mineral ions in the microscopic liquid films clinging directly to root hairs. During the photoperiod and dark cycle, your cannabis plant transpires pure H2O molecules through stomata while leaving the vast majority of dissolved mineral ions (calcium, potassium, nitrates, sulfates) behind in the remaining capillary water.
If your container starts at 65% VWC with an EC of 2.6 dS/m, and the plant transpires moisture down to 47% VWC (an 18% volumetric dry-back), the exact same mass of dissolved fertilizer salts is now suspended in 28% less liquid volume. Simple physical chemistry dictates that ion concentration must surge: the pore-water EC naturally climbs toward 5.0+ dS/m. This diurnal EC spike is not a defect: it is the primary physiological trigger of generative steering. The temporary osmotic tension prompts the plant to synthesize abscisic acid (ABA), tighten floral internodal spacing, and accelerate glandular trichome synthesis. As long as your morning P1 irrigation pulses flush this concentrated pore water and return root-zone EC back to baseline, this diurnal EC oscillation is completely healthy and agronomically beneficial.
Understanding diurnal pore-water concentration dynamics is essential when configuring automated crop-steering triggers. If an automated system were programmed to interpret high pore-water EC as an emergency and immediately flush the substrate with pure reverse-osmosis water during the dark cycle, the plant would suffer instant osmotic shock, root hypoxia, and severe vegetative re-greening. Instead, commercial operators utilize digital sensor telemetry to map the natural parabolic curves of moisture depletion and osmotic concentration across the entire twenty-four-hour photoperiod cycle. By verifying that pore-water EC climbs predictably during dry-backs and drops back to feed target during morning leaching events, cultivators confirm that root ion uptake, transpiration flux, and substrate aeration are functioning in perfect equilibrium. This dynamic data stream provides the empirical foundation for programming automated plumbing actuators, high-pressure booster pumps, and industrial solenoid manifolds.
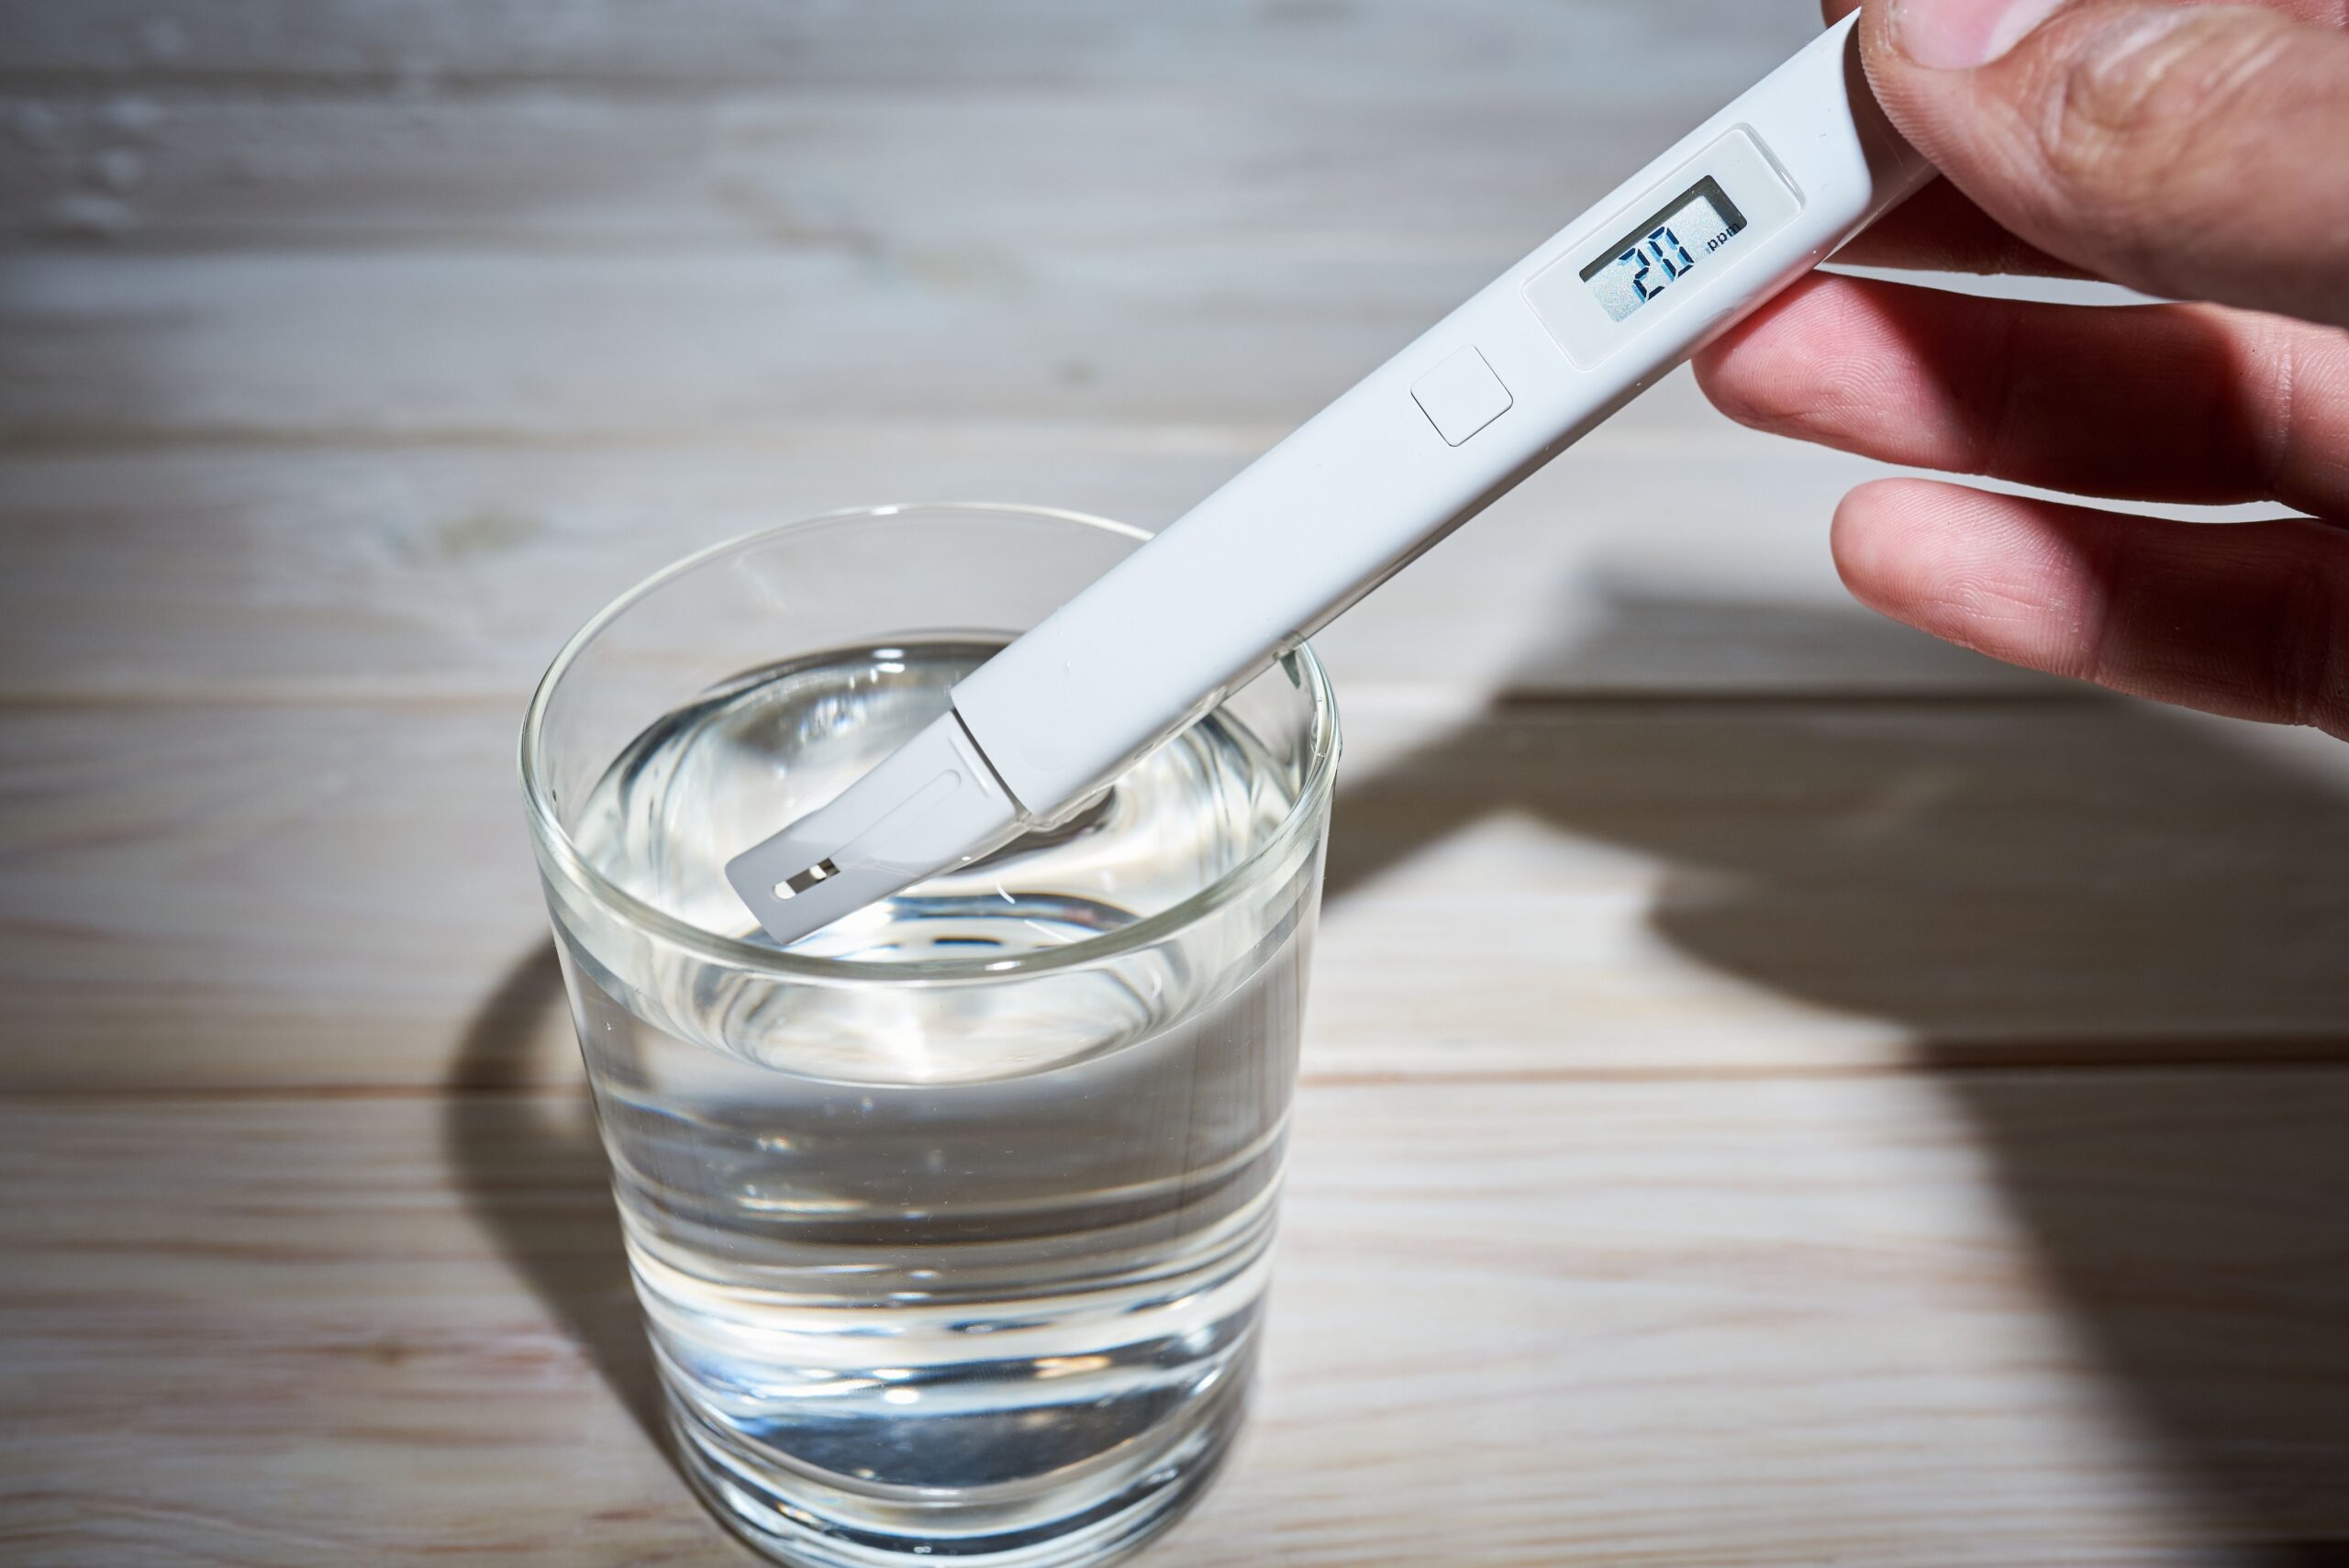
Digital root-zone telemetry verification auditing interstitial pore-water electrical conductivity and moisture curves.
Automated Irrigation Hardware Architecture: Solenoids, Relay Controllers, and Regulators
Translating digital sensor telemetry into physical water delivery requires an engineered electrical and plumbing infrastructure:
- Industrial 24VAC Solenoid Valves: Automated fertigation relies on electric solenoid valves (such as Hunter PGV or Rain Bird PEB series). When an environmental controller signals an irrigation event, a 24VAC electrical current energizes an internal electromagnetic coil, lifting a plunger that opens the pilot valve and releases line water pressure. Commercial facilities select slow-closing diaphragm valves to prevent destructive water hammer hydraulic shock waves across long plumbing runs.
- Programmable Logic Controllers (PLCs) and Smart Relays: Central automation platforms (Argus, Priva, TrolMaster Aqua-X, or custom Siemens PLCs) monitor digital sensor bus loops. The controller processes sensor readings through conditional logic rules: evaluating whether current VWC is below target, whether current time falls within the allowable P1, P2, or P3 window, and whether cumulative solar radiation thresholds have been satisfied before firing solenoid relays.
- Secondary Pressure Regulation and Filtration: Solenoid manifolds must be fed by pressure-regulated supply lines operating between 15 and 30 psi, preceded by a minimum 150-mesh disc filter. Excessive line pressure causes micro-tubing to blow off barb fittings, while un-filtered sediment jams solenoid diaphragms in the open position, causing catastrophic continuous flooding.
The Mechanical Pitfall: Preventing Air Gaps Around Stainless Steel Sensor Needles
The single greatest cause of erratic moisture sensor readings is the formation of micro-air voids around the probe needles. High-frequency electromagnetic waves measure the average permittivity of an 8-centimeter cylindrical field around the rods. Because air has a dielectric constant of 1.0 (compared to water at 80.0), even a microscopic 0.5-millimeter air void adjacent to a needle will artificially depress VWC readings by 10% to 15%, causing controllers to fire false irrigation pulses. When inserting sensors into rockwool or compressed coco, push the probe needles in a single, firm, straight motion: never wiggle or twist the sensor housing during installation.
Preventing physical sensor voids guarantees that telemetry data reflects true substrate moisture rather than air pocket artifacts. However, once reliable telemetry flows into the automation brain, cultivators face critical architectural decisions regarding how software algorithms should trigger physical irrigation valves. Many hobbyist growers and entry-level automation setups rely on simple binary logic: if moisture drops below a set percentage, open the solenoid valve immediately. In commercial cannabis production, this naive automation strategy leads directly to overwatering, root suffocation, and total loss of crop steering control. Understanding how to structure conditional time windows, shot volumes, and transpiration-dependent dry-back intervals is what separates amateur automated plumbing from professional commercial agronomy.
Can I automate my irrigation pump to trigger directly whenever VWC drops below 55%, or should I use timer windows?
Question sent by: Lindsey Zhao, via email.
“I bought an automated controller with soil moisture triggers. My plan is simple: whenever the sensor reads below 55% VWC, trigger a 60-second drip shot, day or night. That way my plants never dry out. Is this the right way to automate, or will it cause problems?”
Automating irrigation with a raw 24/7 moisture trigger is an agronomic trap that will destroy your crop steering and cause severe root hypoxia.
If you program a controller to water whenever VWC drops below 55% regardless of time, the system will trigger irrigation pulses in the middle of the dark cycle. During the dark cycle, cannabis stomata are closed and transpiration drops by over 90%. Nighttime irrigation prevents the substrate from achieving its essential overnight dry-back (8% to 15% VWC drop). Maintaining high moisture through the dark cycle starves root cortical cells of oxygen, promotes pythium root rot, and signals the plant to stay permanently vegetative, resulting in loose, airy floral buds.
Commercial automation uses conditional multi-tier window logic (P1, P2, and P3 windows):
- P1 Window (Ramping Phase): Starts 1 to 2 hours after lights-on. Delivers a timed sequence of small shots (spaced 15 to 30 minutes apart) to ramp moisture from the overnight dry-back floor up to container capacity, achieving the first leaching runoff.
- P2 Window (Maintenance Phase): Active only during peak midday photoperiod. This is the only window where VWC triggers should be used: if VWC drops 3% below container capacity, trigger a small maintenance pulse (1% to 2% substrate volume) to sustain transpiration.
- P3 Window (Overnight Dry-Back Phase): Irrigation is strictly locked out 2 to 4 hours before lights-off. All watering ceases through the dark cycle, forcing the plant to transpire residual water and draw fresh atmospheric oxygen into the root zone before morning.
The three-phase window architecture outlined in the grower response illustrates why automated crop steering depends on conditional scheduling rather than raw moisture setpoints. By restricting irrigation shots to specific metabolic windows, cultivators harness the natural diurnal rhythm of cannabis plants. During the early morning P1 window, roots warm up as the photosynthetic light intensity ramps, initiating steady water uptake before the first drip pulse arrives. The midday P2 maintenance window protects the canopy from hydraulic fatigue while maintaining root-zone air-filled porosity. Finally, the evening P3 lockout initiates the vital overnight dry-back, creating a negative pressure gradient within substrate micropores that pulls fresh atmospheric air deep into the container core. This rhythmic oxygenation cycle prevents root necrosis, suppresses opportunistic anaerobic pathogens, and steers the plant toward dense, trichome-laden floral development.

Cannabis canopy transpiring under automated closed-loop irrigation triggered by real-time substrate telemetry.
Diagnosing Telemetry Anomalies: Air Voids, Cable Noise, and Salinity Saturation
When managing automated sensor networks across hundreds of cultivation tables, operators must quickly identify false telemetry artifacts before they cause catastrophic overwatering:
- The Stepped Signal Drop (Rod Dislodgement): If a sensor graph displays an instantaneous vertical drop of 15% VWC during midday without an irrigation event, a probe needle has been physically bumped or dislodged by a worker, creating an air void. Inspect and re-seat the probe immediately.
- Electromagnetic Interference (EMI) Spikes: High-frequency electronic ballasts and unshielded LED driver cables emit intense radiofrequency noise. If sensor data cables are routed in parallel alongside high-voltage AC electrical lines, EMI introduces erratic sawtooth spikes onto VWC and EC telemetry graphs. Route sensor communication cables through grounded metal conduit or cross AC power lines strictly at 90-degree angles.
- Salinity Saturation at Low Moisture: As substrates dry down past 30% VWC, the dielectric Hilhorst model becomes mathematically unstable due to negligible bulk permittivity (εb). Sensors may report absurdly high pore-water EC readings (exceeding 15 to 20 dS/m). Operators must filter automation logic to ignore pore-water EC readings whenever VWC falls below 35%.
| Growing Medium Format | Target Container Capacity (Peak VWC %) | Vegetative Overnight Dry-Back Target | Generative Overnight Dry-Back Target | Safe Operational Pore-Water EC Range |
|---|---|---|---|---|
| Horticultural Rockwool Slabs/Blocks | 75% – 85% VWC | 10% – 15% drop (65% floor) | 20% – 30% drop (50% floor) | 2.5 – 6.0 dS/m EC |
| Coco Coir / Perlite (70/30) | 60% – 70% VWC | 8% – 12% drop (52% floor) | 16% – 22% drop (42% floor) | 2.2 – 5.5 dS/m EC |
| Peat Moss Potting Blends (Pro-Mix) | 50% – 60% VWC | 10% – 14% drop (40% floor) | 16% – 20% drop (34% floor) | 1.8 – 4.5 dS/m EC |
| Living Organic Super Soil Beds | 44% – 52% VWC | 5% – 8% drop (steady plateau) | 6% – 10% drop max | 1.2 – 2.8 dS/m EC |
Closed-Loop Programming: Integrating VWC Triggers with Solar Radiation Sums
The pinnacle of commercial fertigation engineering is radiation-integrated automation, where root-zone sensor telemetry is cross-referenced with atmospheric transpiration drivers. Transpiration in cannabis is driven almost entirely by solar radiation and vapor pressure deficit (VPD). When environmental computers track incoming photosynthetically active radiation (PAR) using quantum sensors or pyranometers, they calculate real-time light accumulation sums measured in Joules per square centimeter (J/cm2). In a closed-loop system, irrigation events are not dictated by fixed clocks: instead, the controller monitors the accumulation of solar energy. Once the canopy absorbs a specific energy threshold (typically 200 to 300 J/cm2 during peak flower), the controller checks root-zone VWC. If substrate moisture has dropped by a corresponding 2.5% to 3.0%, the controller fires an automated shot.
This dual-condition AND logic establishes a robust agronomic failsafe: irrigation pulses fire only when both light accumulation demands replenishment and substrate telemetry confirms that moisture has actually been transpired. On cloudy days or during HVAC cooling failures where lights dim or transpiration stalls, light sums accumulate slowly, automatically extending the interval between shots and preventing substrate waterlogging. Conversely, during periods of intense light intensity and low relative humidity, light sums accumulate rapidly, prompting the controller to deliver timely maintenance pulses that protect root hairs from desiccation. By integrating root-zone telemetry with canopy light absorption, commercial facilities achieve true closed-loop crop steering efficiency.
Automated Moisture Sensor Irrigation Checklist
Audit these critical technical checkpoints before activating automated closed-loop fertigation:
- Dielectric permittivity sensors are mathematically calibrated to the specific substrate format (rockwool, coco, or peat).
- Probe needles are inserted horizontally into the middle-to-lower third of the container, avoiding edge and base contact.
- Zero air gaps or loose voids exist around sensor needles: probes are pushed firmly in a single straight motion.
- Index plants represent median canopy health, height, and light exposure; edge runts are strictly avoided.
- Industrial 24VAC slow-closing solenoid valves are protected by an upstream 150-mesh disc filter and pressure regulator.
- Automation logic uses conditional time windows: P1 morning ramp, P2 midday maintenance, P3 nighttime lockout.
- Nighttime irrigation is strictly locked out to enforce target overnight dry-back (8% to 15% VWC drop).
- Pore-water EC spikes during dry-back are audited to confirm they return to baseline upon morning P1 saturation.
- Communication cables are shielded and separated from high-voltage AC electrical lines to eliminate EMI noise spikes.
- High-limit and low-limit failsafe alarms are programmed to shut off master water supply in the event of sensor failure.
Scientific References
- Hilhorst, M. A. (2000). A pore water conductivity sensor. Soil Science Society of America Journal, 64(6), 1922-1925.
- Topp, G. C., Davis, J. L., & Annan, A. P. (1980). Electromagnetic determination of soil water content: Measurements in coaxial transmission lines. Water Resources Research, 16(3), 574-582.
- Kramer, P. J., & Boyer, J. S. (1995). Water Relations of Plants and Soils. Academic Press, San Diego, CA.
- Marschner, H. (2012). Marschner’s Mineral Nutrition of Higher Plants (3rd ed.). Academic Press, London.
- Raviv, M., & Lieth, J. H. (2008). Soilless Culture: Theory and Practice. Elsevier Science, Amsterdam.
- Zheng, Y. (2021). Handbook of Cannabis Production in Controlled Environments. CRC Press, Boca Raton, FL.
- Nemali, K. S., & van Iersel, M. W. (2006). An automated system for controlling substrate water content and monitoring plant water use. HortScience, 41(1), 282-287.
- Jones, H. G. (2004). Irrigation scheduling: advantages and pitfalls of plant-based methods. Journal of Experimental Botany, 55(407), 2427-2436.
Share this article
A quick overview of the topics covered in this article.