
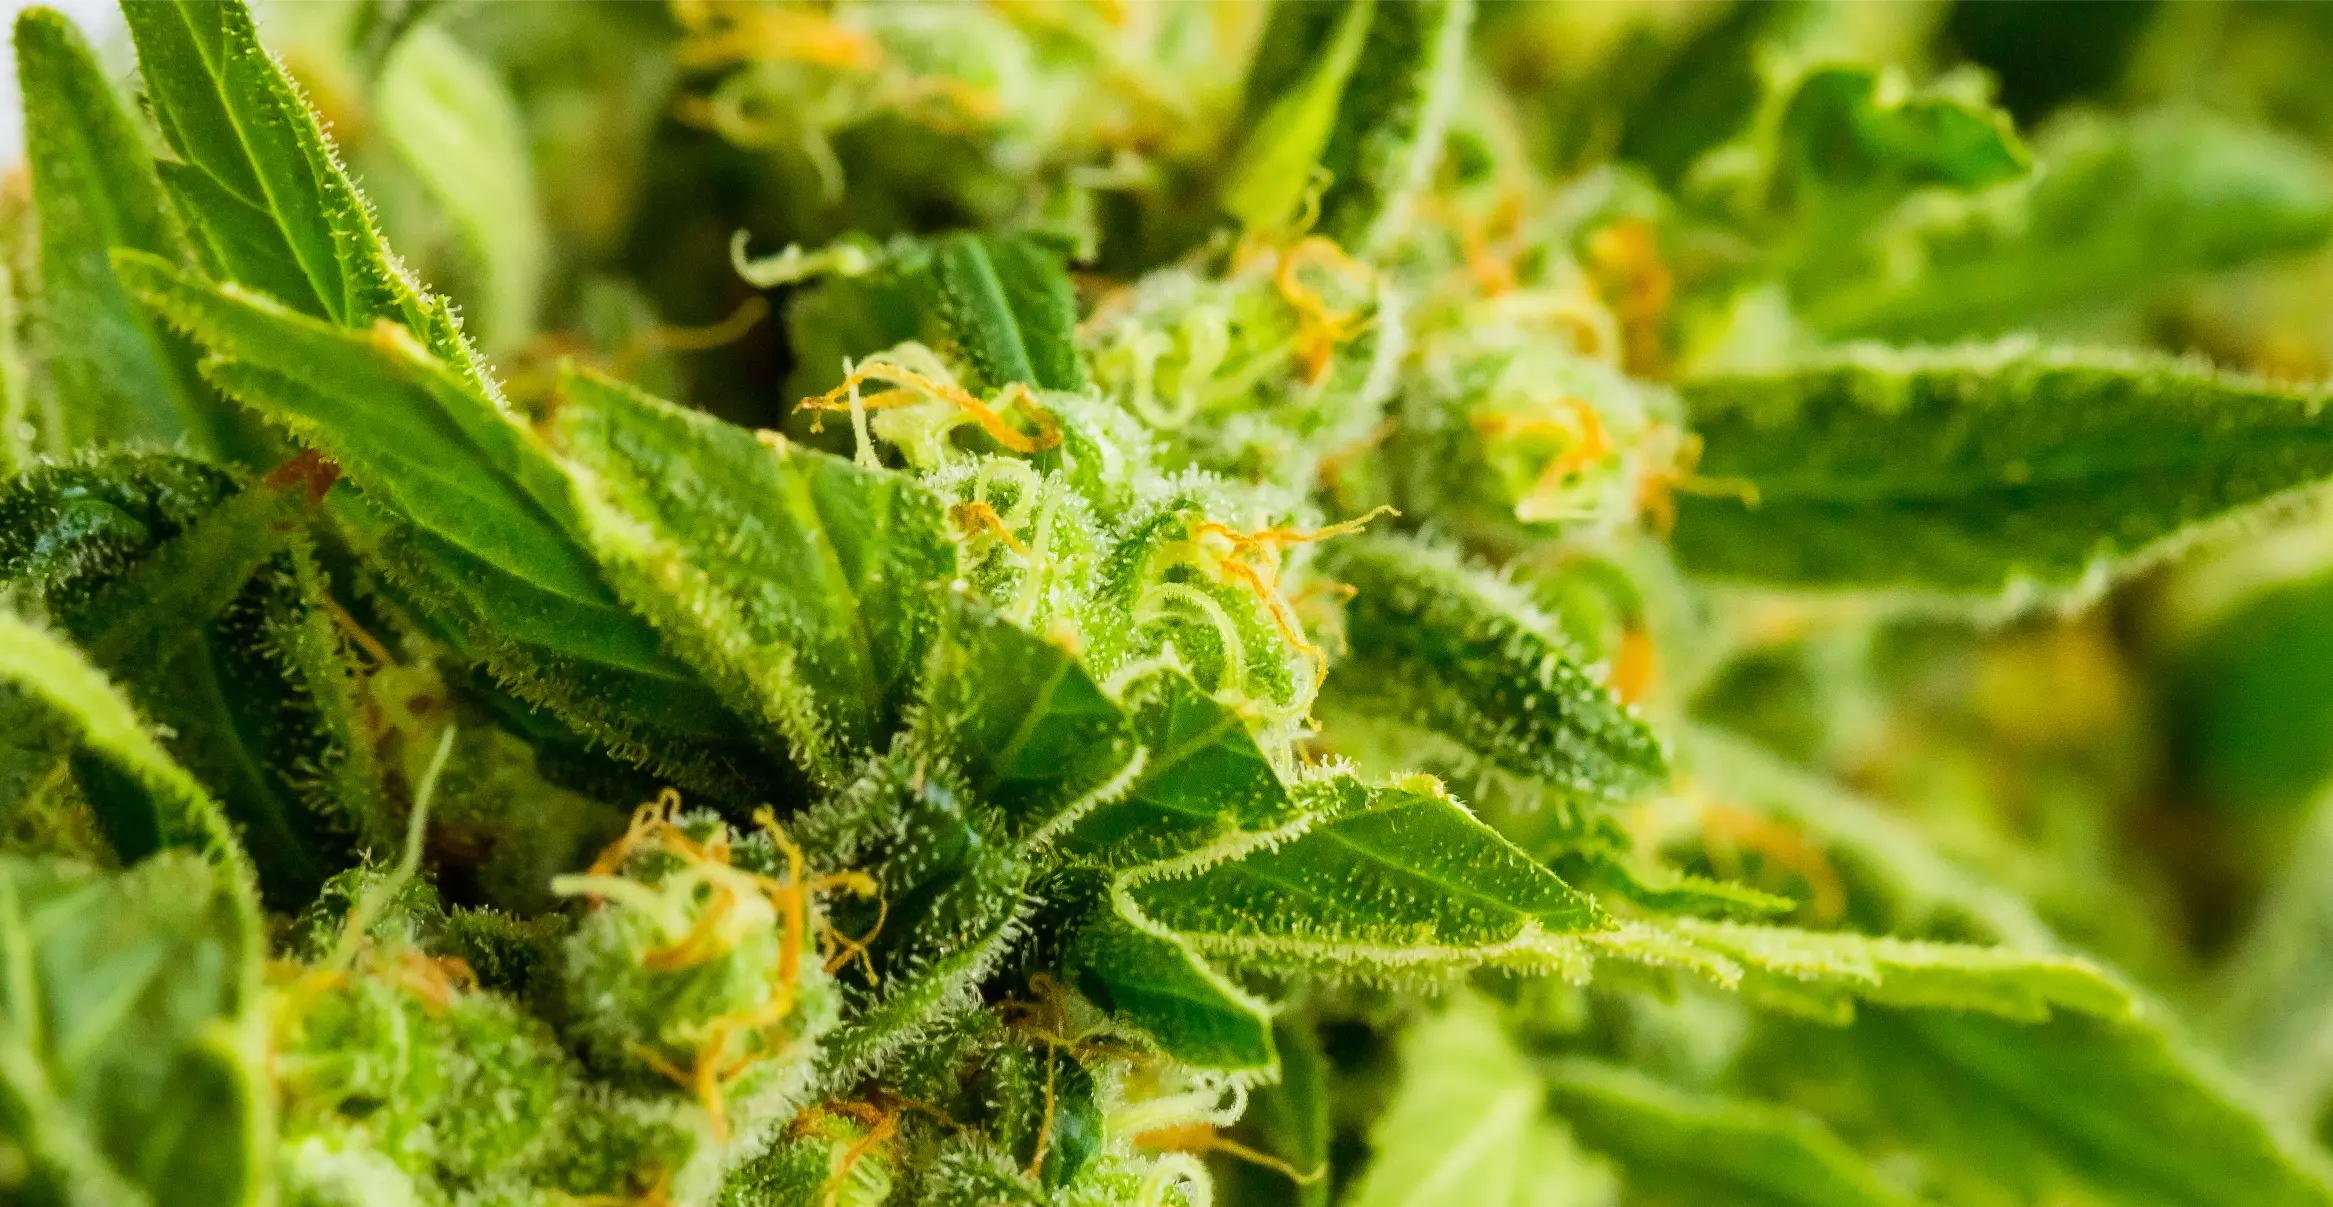
Indoor Cannabis Inspection and Grow Log: Daily Checks, Pest Scouting, Photos, and Records
Most catastrophic indoor crop failures – from late-flower spider mite webbing and root-zone salt lockout to hermaphroditic pollen bursts – give off clear, measurable warning signs 7 to 14 days before visible canopy decline sets in. Growers who rely on casual glances when opening the tent door routinely miss those early signals because gradual shifts in leaf posture, runoff conductivity, or abaxial pest stippling blend into the background of day-to-day growth.
Replacing ad-hoc observation with a structured inspection routine and a standardized grow log transforms indoor cultivation from reactive firefighting into predictable process control. This guide outlines a five-minute daily check, a 20-minute weekly deep audit, a zone-by-zone leaf pest scouting protocol, a complete beginner grow log template, and a repeatable white-light photography workflow that exposes slow trends before yield is lost.
Structuring a Two-Tier Inspection Cadence
Trying to inspect every leaf and test every runoff sample every single day leads to cultivator burnout, whereas separating quick daily vital-sign checks from thorough weekly audits keeps your routine sustainable.
A Daily and Weekly Cannabis Inspection Routine
An effective indoor monitoring schedule divides labor into a five-minute daily visual and hardware scan performed within 60 minutes of lights-on, paired with a 20-minute hands-on diagnostic session once every seven days. The daily check focuses on high-velocity failure points: verifying that all LED drivers, inline exhaust fans, oscillating clip fans, and drip timers are running normally, reading the 24-hour high/low memory on your canopy thermo-hygrometer, and lifting containers by hand to gauge substrate moisture.
The weekly 20-minute session goes beneath the surface to capture cumulative drift before it compounds. Once a week, pull or rotate plants to inspect lower shaded branches, examine five to ten leaves per plant with a 30x-60x illuminated loupe, collect and measure a 10% to 20% irrigation runoff sample for pH and electrical conductivity (EC), verify light hanging distance with a tape measure or PAR sensor, and capture standardized progress photographs.
Reading Canopy Posture and Leaf Turgor at Lights-On Versus Lights-Off
Cannabis leaves follow a natural circadian rhythm of nyctinasty, drooping slightly 30 to 60 minutes before the dark cycle begins and elevating back toward a 15-to-30-degree upward ‘praying’ angle shortly after lights turn on. Inspecting your tent at the exact same timestamp each day – ideally one to two hours into the photoperiod – gives you an honest baseline for hydraulic turgor and root oxygenation.
If upper fan leaves remain limp with curved, turgid petioles two hours after lights-on, the root zone is likely over-saturated and hypoxic; if both leaf blades and petioles hang limp while pots feel feather-light, the plant is approaching permanent wilting point. Conversely, if leaflet serrated margins curl sharply upward like taco shells mid-day, canopy PPFD or vapor pressure deficit (VPD) is exceeding the root system’s current transpiration capacity.
Abaxial Versus Adaxial Foliar Inspection: The adaxial surface is the upper, light-facing side of the leaf where stippling scars and nutrient chlorosis appear last; the abaxial surface is the shaded underside housing the highest density of stomata, softer epidermal tissue, and over 90% of feeding mites, thrips larvae, and pest eggs.
Practical questions from home cultivators often center on how these thresholds behave in real-world tents and small rooms.
“Where is the most accurate place to hang my thermo-hygrometer sensor probe inside the tent so my daily grow log readings reflect what the plants actually feel?”
Question sent by: Natalia O’Sullivan, via grow journal submission.
Suspend the sensor probe at the exact height of the upper canopy, centered between plants, and shield the plastic sensor housing from direct radiant LED light using a small white paper cone or inverted plastic cup with side vents. If direct photon flux hits an unshaded black or white plastic probe housing, radiant heating will skew your temperature reading 3 to 6 degrees Fahrenheit higher than true air temperature and artificially lower your relative humidity reading.
For accurate VPD calculations in your log, supplement that shaded canopy air reading once or twice a week by measuring actual leaf surface temperature with an infrared (IR) thermometer aimed at top fan leaves.
Zone-by-Zone Pest and Pathogen Scouting Protocol
Indoor pests never distribute themselves evenly across a grow tent; they colonize specific thermal, humidity, and substrate niches long before they become visible on upper colas.
How to Inspect Cannabis Leaves for Pests
Always wear clean nitrile gloves and switch off colored or high-glare grow lights in favor of a neutral 4000K-5000K white work light or headlamp before scouting foliage. Start at the bottom third of the plant and gently flip older fan leaves over by holding the petiole rather than pinching the blade, scanning along the main central midrib and the V-shaped junctions where lateral veins branch outward.
First inspect the adaxial (upper) surface with the naked eye: tiny circular white or yellow pinprick dots (stippling) indicate two-spotted spider mites piercing mesophyll cells from underneath, whereas silvery, metallic scratch-like patches partnered with tiny black fecal specks point to western flower thrips. Next, examine the abaxial (lower) surface under 30x to 60x magnification to identify translucent spherical mite eggs, slow-moving pale broad or russet mites inside emerging apical tips, or winged root aphids near the stem base.
Deploying Yellow and Blue Sticky Cards as Early Warning Sensors
Sticky traps are population-monitoring instruments rather than standalone pest eradication tools, and their placement determines which species they intercept. Place one yellow sticky card horizontally or on a short stake 1 to 2 inches above the substrate surface of every second pot to trap adult fungus gnats and winged root aphids emerging from the media, and hang blue or yellow cards at mid-canopy height to catch adult thrips.
Draw a small grid on the corner of each card with a permanent marker and date it on installation, then count and circle newly trapped insects during your weekly audit before replacing cards every 14 days. Catching two gnats in a week warrants letting the top inch of soil dry further, whereas jumping from three gnats to thirty in seven days signals an active larval cohort feeding on root hairs that requires immediate biological drenching with Bacillus thuringiensis israelensis (Bti).
Checking Internodal Axils for Intersex Traits and Microclimate Mold
From week two of flowering through harvest, expand your weekly physical inspection beyond leaf blades into the stem nodes and dense floral interiors. During weeks two through four of 12/12, examine the shaded lower internodal axils (where stipules and pre-flowers meet the main stem) for smooth, oval, short-stalked pollen sacs caused by genetic sensitivity or light leaks.
From week six onward, gently spread two adjacent lobes of your thickest upper colas while wearing fresh gloves to inspect the main stem core and small sugar-leaf petioles. Any single small sugar leaf sitting inside a healthy green cola that suddenly turns yellow, wilts, and pulls free with zero resistance indicates early internal Botrytis cinerea stem rot requiring immediate surgical excision.
| Canopy / Root Zone | Primary Target Pest or Issue | Exact Visual / Loupe Sign | Weekly Inspection Method |
|---|---|---|---|
| Substrate Rim & Drain Holes | Fungus gnats, root aphids, salt crust | Dark 2-3 mm flies on yellow card; white chalky salt ring on fabric pot | Count pot-level yellow sticky card; inspect root tips at drain ports |
| Lower Shaded Fan Leaves | Two-spotted spider mites, PM | 0.5 mm white stippling dots on top; amber/clear spheres along underside veins | Flip 4 lower leaves per plant; scan abaxial midrib with 40x loupe |
| Mid-Canopy & Inner Axils | Western flower thrips, pollen sacs | Silvery scraped patches + black frass dots; smooth green oval sacs at nodes | Check mid-height blue/yellow cards; flashlight scan of lower nodes Wks 2-4 |
| Apical Meristems & New Tips | Hemp russet mites, broad mites | Twisted, brittle, glossy or canoeing new growth; 0.15 mm wedge mites at 60x | Inspect 2 newest apical shoots per plant under 60x illuminated scope |
| Dense Upper Cola Cores | Botrytis (bud rot), light bleaching | Single dead sugar leaf pulling out easily; albino white tips nearest LED | Gently part largest cola lobes in Wks 6-9; measure fixture distance |
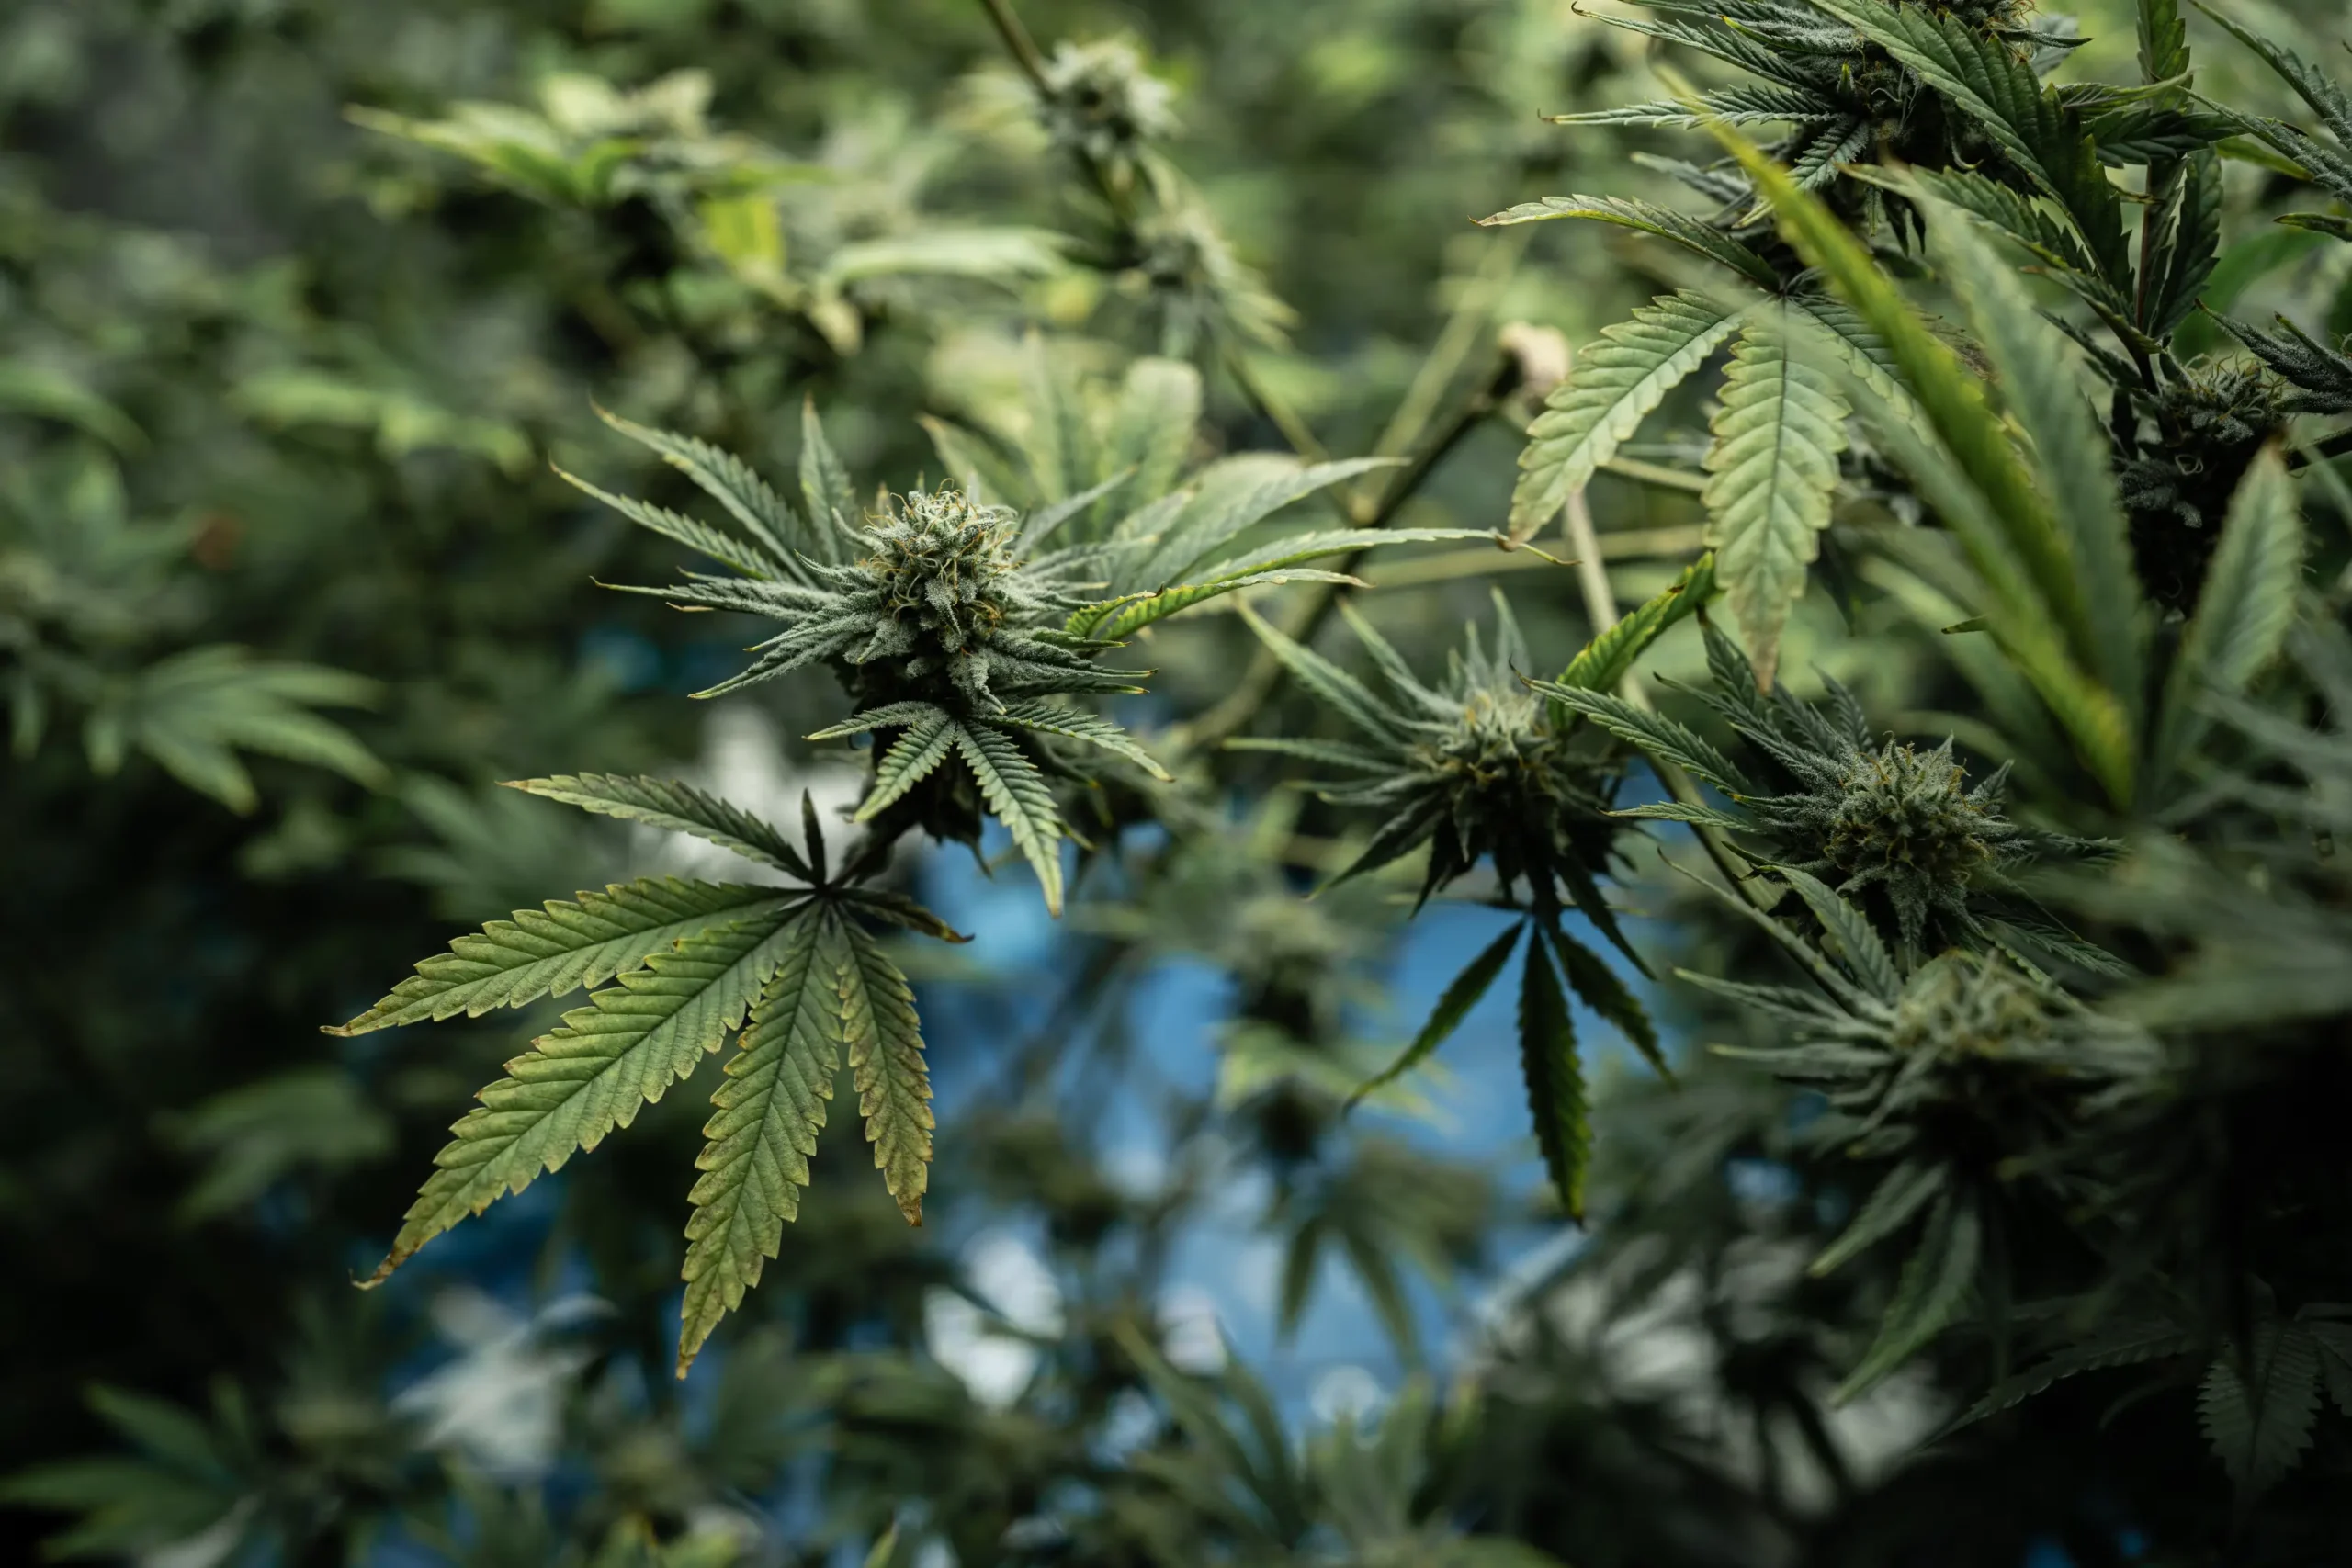
Observations made with a loupe and sticky cards become twice as powerful when paired with quantitative environmental and root-zone numbers recorded in a dedicated grow log.
Designing a Practical Data Log That Prevents Nutrient and VPD Drift
Recording twenty irrelevant metrics guarantees you will abandon your notebook by week three, so a high-utility grow log tracks only the core inputs and outputs that directly govern plant physiology.
Cannabis Grow Log Template for Beginners
A functional beginner grow log requires just ten columns per entry across three categories: Chronology (Date, Days in Current Stage / Days Since 12/12 Flip), Atmospheric Environment (Lights-On Temp/RH, Lights-Off Min Temp/Max RH, Calculated VPD in kPa, and Canopy PPFD or Light Hanging Height in inches), and Root-Zone Fertigation (Input Volume in liters, Input pH & EC, Runoff Volume %, and Runoff pH & EC).
Leave a wide eleventh column for ‘Plant Response & Actions Taken’ where you note leaf posture (praying, flat, drooping, clawing), defoliation or training events, foliar sprays, and sticky card counts. Keeping this template on a clipboard clipped directly to the outside of the grow tent – or in a simple offline spreadsheet on your phone – ensures numbers are written down the moment your pH and EC probes stabilize.
Interpreting Delta EC and Delta pH Between Input and Runoff
Measuring the nutrient solution going into your containers tells you only half the story; logging the difference (delta) between input and runoff reveals what is happening inside the rhizosphere. In coco coir or peat-based media watered to 15%-20% runoff, a healthy, actively feeding canopy keeps runoff EC within +0.1 to +0.3 mS/cm of input EC and runoff pH within 0.2 to 0.4 units of input pH.
When your weekly log shows runoff EC climbing steadily across three consecutive irrigations (for example, feeding 1.6 mS/cm while runoff rises from 1.8 to 2.2 to 2.7 mS/cm) accompanied by a falling runoff pH, unused fertilizer salts are accumulating in the medium and acidifying the root zone. Catching that upward slope in your log lets you drop feed strength by 0.3 mS/cm and increase runoff volume to 25% before leaf tips ever burn.
Do
- Perform your five-minute daily check at the exact same time each day (1 to 2 hours after lights-on) so leaf posture comparisons remain valid.
- Inspect the abaxial (underside) surface of at least four lower and mid-tier leaves per plant every week using a 30x to 60x illuminated loupe.
- Record both input and runoff pH and EC at least once a week so you can spot salt accumulation or root-zone acidification before leaves burn.
- Dim grow lights or use a neutral 5000K white light from fixed camera angles when taking weekly progress photos to capture true leaf coloration.
Avoid
- Evaluating leaf turgor right before lights-off or immediately after lights-on, when natural circadian drooping mimics overwatering or underwatering.
- Checking only the top adaxial surface of upper canopy leaves, which allows spider mites and thrips on lower leaf undersides to multiply unseen.
- Logging pH and EC numbers from digital meters that have not been calibrated in fresh buffer solutions within the last 7 to 14 days.
- Changing nutrient strength, light height, and watering frequency all on the same day, which makes it impossible to log which change helped or hurt.
With the core ten-column log template established, turning those inspections and measurements into an effortless habit requires a scannable daily and weekly operational checklist.
“If I am growing in amended organic living soil where I water without runoff, how should I adapt the root-zone columns of my grow log?”
Question sent by: Natalia Leblanc, via email.
In living soil beds or large organic containers watered to field capacity without runoff (5% to 10% of pot volume per irrigation), replace the weekly runoff EC/pH test with a monthly 1:2 soil slurry test and log input water pH, soil temperature, and tensiometer or moisture-meter readings (targeting 80 to 120 mbar in active growth). You should also log the exact dates and rates of organic top-dressings, compost teas, and biological drenches since mineralization takes 7 to 14 days to show up in the canopy.
Tracking irrigation volume, days between waterings, and standardized white-light leaf color becomes your primary early-warning indicator in water-only organic systems.
Operational Checklists for Daily and Weekly Tent Audits
Following the exact same sequence from top to bottom inside the tent ensures you never skip a critical sensor reading or cross-contaminate healthy plants after touching a suspect leaf.
Daily and Weekly Indoor Grow Checklist
Structure your daily five-minute pass in four sequential steps: (1) Check the 24-hour min/max memory on your canopy-level thermo-hygrometer and reset the memory log; (2) Confirm exhaust negative pressure, oscillating fan sweep, and humidifier/dehumidifier water reservoirs; (3) Scan upper and lower leaf posture under white light for wilting, tacoing, or discoloration; and (4) Lift two reference pots to assess substrate water weight and irrigate if dry.
Structure your weekly 20-minute audit in five steps: (1) Measure and adjust LED hanging distance or dimmer output to keep canopy PPFD on target after vertical stem stretch; (2) Inspect four abaxial leaves per plant with a 40x-60x loupe and log sticky card pest counts; (3) Calibrate pH and EC pens in standard buffer solutions; (4) Record a full input-versus-runoff fertigation test; and (5) Capture your weekly white-light comparison photographs.
Biosecurity Order of Operations When Inspecting Multiple Plants
How you move between tents or individual plants during your inspection determines whether you catch a localized issue or spread it to every cultivar in your home. Always inspect your cleanest, youngest propagation or mother tent first, move to your main vegetative tent second, and inspect late-flower or quarantine plants last so mites, powdery mildew conidia, or viroid-contaminated sap never travel backward onto young stock.
Keep a bottle of 70% isopropyl alcohol or 0.5% sodium hypochlorite solution and a box of disposable nitrile gloves next to your grow log clipboard. Wipe down pruning shears, pH/EC probes, and jeweler loupe housings between plants whenever you notice abnormal leaf mottling, sticky honeydew, or stunted branching.
| Grow Log Parameter | Measurement Tool | Healthy Target Range (Veg / Flower) | Action Threshold When Out of Range |
|---|---|---|---|
| Canopy Temp (Lights On / Off) | Shaded Probe Thermo-Hygrometer | 75-82 F On / 67-74 F Off | Adjust exhaust speed or lung room HVAC if day/night swing exceeds 12 F |
| Canopy VPD | Temp/RH Chart + IR Leaf Thermometer | 0.8-1.1 kPa Veg / 1.2-1.5 kPa Flower | Add humidification below 0.7 kPa; run dehumidifier or lower temp above 1.6 kPa |
| Runoff EC Delta (Coco/Soilless) | Digital EC Meter (mS/cm) | +0.1 to +0.3 mS/cm above Input EC | If runoff exceeds input by >0.5 mS/cm, irrigate at 75% feed strength to 25% runoff |
| Runoff pH (Coco / Peat) | Calibrated Digital pH Pen | 5.7-6.2 Coco / 6.1-6.7 Peat-Soil | Recalibrate meter first; if confirmed >0.5 drift, flush or top-dress buffering agent |
| Sticky Card Pest Count | Pot-Rim Yellow Sticky Trap | 0 mites/thrips; <2 gnats per week | Trigger Bti drench or targeted IPM spray if weekly count doubles or exceeds 5 |
Numeric logs capture root-zone and atmospheric drift with precision, while standardized photographs provide the visual record needed to evaluate structural growth and slow foliar transitions.
Cultivation Warning
Glass-bulb pH electrodes drift steadily as reference electrolyte depletes and organic biofilm coats the sensor; logging readings from a pen that has not been calibrated in pH 4.01 and 7.01 buffer solutions within the last 7 to 14 days often tricks growers into chasing phantom root lockouts.
Practical questions from home cultivators often center on how these thresholds behave in real-world tents and small rooms.
“I saw two tiny white spots on a single lower leaf during my daily check, but I could not find any moving bugs with my naked eye. Should I spray immediately?”
Question sent by: Natalia Mercier, via contact form.
Do not spray unidentified broad-spectrum pesticides based on two spots seen with the naked eye. First, flip that leaf and the three leaves directly adjacent to it over and examine the abaxial midrib and vein junctions with a 30x to 60x illuminated loupe. Tiny white splashes can simply be dried nutrient droplets from watering or mechanical rub marks from container rims.
If the 40x loupe reveals translucent spherical eggs, dark fecal specks, or moving mites/thrips larvae, log the exact plant and node location and initiate a targeted biological or contact spray rotation during low-light hours.
Capturing Standardized White-Light Photos for Visual Tracking
Random smartphone snapshots taken from different angles under heavy magenta or high-intensity LED glare hide early interveinal chlorosis and make week-over-week growth comparisons impossible.
How to Track Cannabis Growth with Comparable Photos
To build a genuine diagnostic time-lapse across a 12-to-16-week cycle, establish three locked camera angles that you repeat at the exact same day and hour each week: (1) a horizontal profile shot from tripod or tent-bar height showing vertical stretch and light clearance against a ruler or marked tent pole; (2) a top-down 45-degree canopy shot showing lateral fill and apical symmetry; and (3) a macro shot of one representative mid-canopy fan leaf and one top bud site.
Always dim your main grow light down to 10%-20% or switch it off briefly and illuminate the plants with a neutral 5000K white LED work light or camera flash, locking your smartphone’s white balance if possible. Full-power horticultural LEDs saturate phone camera sensors, compress dynamic range, and mask the subtle pale-green-to-yellow shifts that signal early nitrogen, magnesium, or iron deficiencies.
File Naming Conventions and Side-by-Side Comparison Reviews
Save weekly photo sets in dedicated cultivar folders using an ISO-style naming convention that sorts chronologically and embeds your core log metrics: for example, `2026-05-14_CultivarA_F21_EC1.8_pH5.9_Top.jpg` (where `F21` denotes day 21 of 12/12 flowering). Including the stage day and input EC/pH directly in the filename eliminates having to cross-reference two separate apps when reviewing how a plant responded to a feed change.
During your weekly 20-minute review, open the current week’s photo side by side with the photo from seven days prior on a tablet or monitor. Comparing two identical white-light frames instantly reveals whether lower-leaf yellowing is actively progressing up the plant (an active mobile deficiency) or sitting completely static after you corrected a past watering error.
Marking a 4-foot bamboo stake in 2-inch increments with high-contrast black electrical tape and leaving it in the center pot gives every weekly profile photo an instant physical scale bar, making it effortless to measure exact flowering stretch multipliers for each pheno.
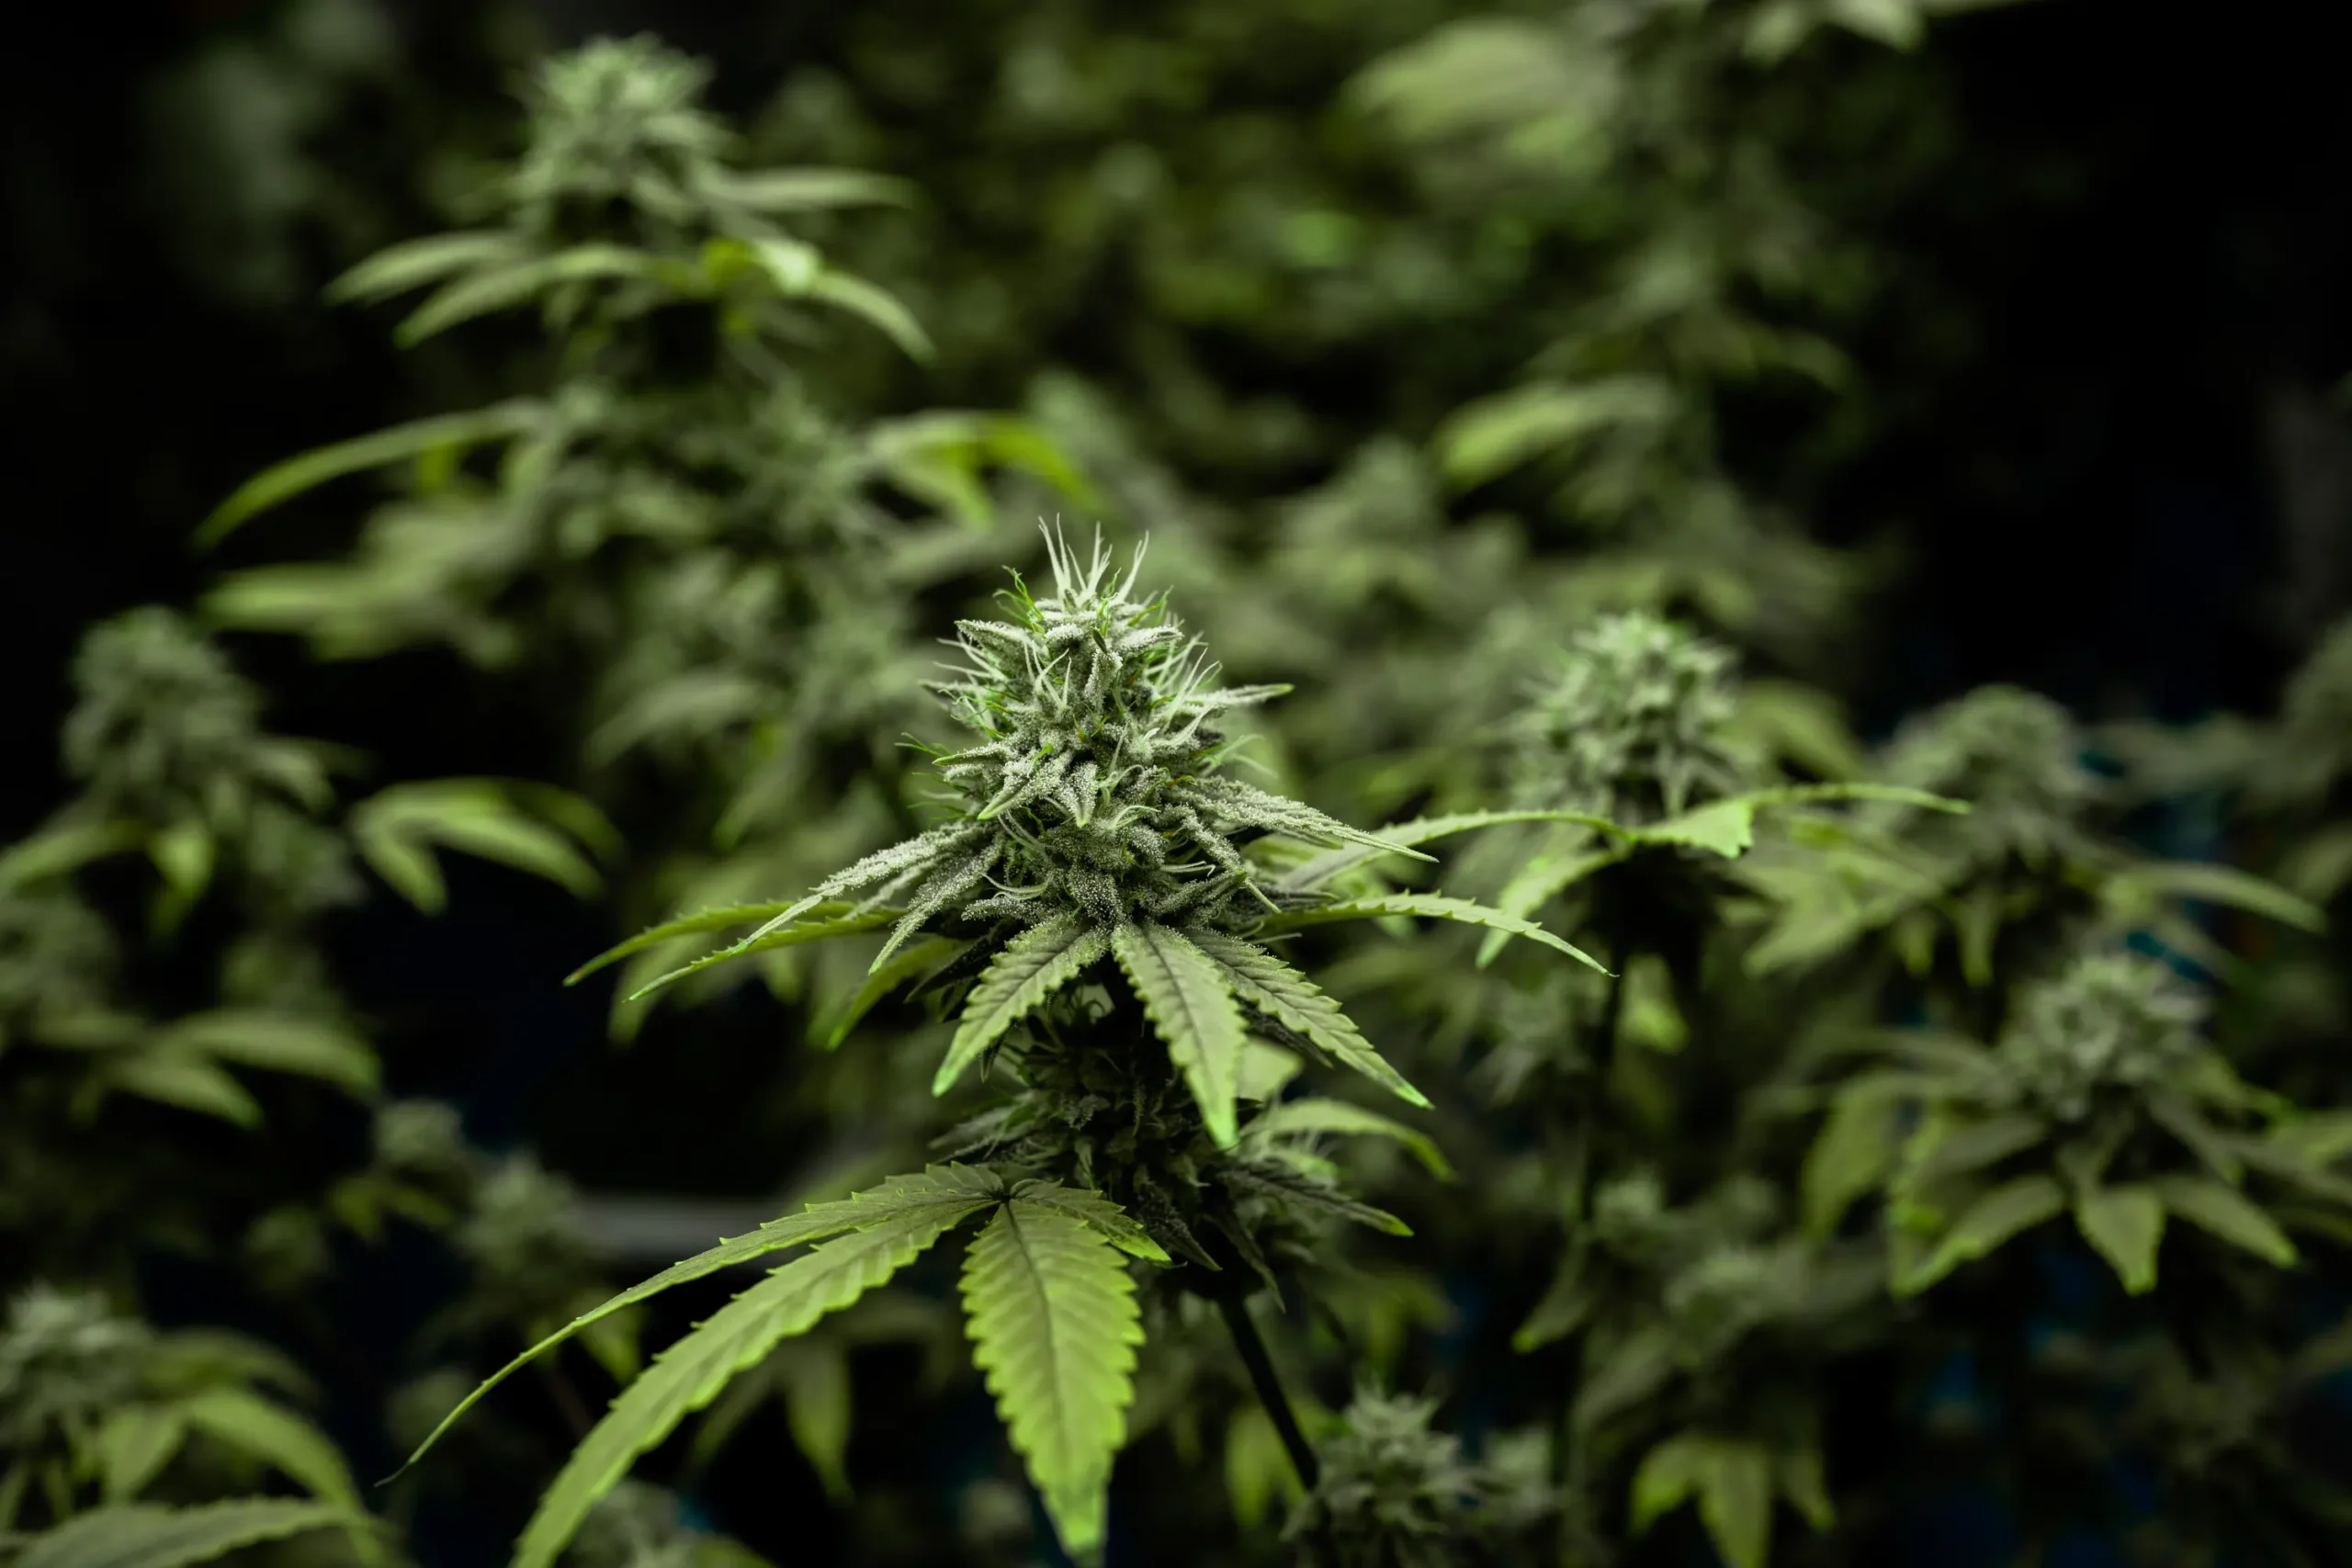
Once you have collected a full cycle of numeric logs and standardized photos, a brief post-harvest audit turns that archive into a custom blueprint for your next run.
Turning Logged Cycle Data Into Next-Run Improvements
The highest return on keeping a grow log comes when you review the completed record alongside final dry flower weights and curing notes to refine your cultivar-specific recipe.
Correlating Stretch Multipliers and EC Peaks With Final Yield
At the end of the drying process, summarize three benchmark metrics at the top of your grow log cover sheet: total vertical stretch multiplier between day 1 and day 21 of 12/12 (for example, 18 inches to 38 inches = 2.1x stretch), peak EC tolerated without tip burn or runoff salt accumulation, and exact days to mature trichome harvest versus breeder estimates.
When you run clones of that same keeper phenotype on the next cycle, you no longer have to guess when to flip the photoperiod or how aggressively to push mid-flower phosphorus and potassium. If your log shows that runoff EC spiked from 1.9 to 2.5 mS/cm during week six when you fed at 2.0 mS/cm, you can cap your next cycle at 1.7 mS/cm during week six and prevent tip burn entirely.
Establishing Baseline Triggers Before Adjusting Any Grow Room Variable
A written log also protects you from the most common indoor cultivation error: changing three variables in panic when a single leaf looks off. Before raising nutrient strength, flushing a pot, or spraying an IPM product, consult your last three log entries to verify whether VPD, root-zone pH, and irrigation frequency have remained stable.
If your log reveals that dark-period temperatures dipped to 61 degrees Fahrenheit twice this week, purple petioles and slowed water uptake are thermal responses rather than a phosphorus deficiency. Complete the five verification steps below during every weekly audit to keep your records clean, accurate, and actionable.
Field Verification Checklist
- Read and reset the 24-hour min/max temperature and relative humidity memory on your shaded canopy probe during your daily check.
- Lift containers by hand or weigh a reference pot on a digital scale to verify moisture depletion before mixing nutrient solution.
- Scan the abaxial veins of lower fan leaves and apical tips with a 40x-60x loupe and record sticky card insect counts every seven days.
- Measure input pH/EC and 15%-20% runoff pH/EC once a week, flagging any runoff EC that exceeds input by more than 0.4 mS/cm.
- Capture three standardized white-light photos (side profile with scale bar, 45-degree canopy, and reference leaf/bud) on the same day each week.
Executing these five verification habits consistently ensures that every adjustment you make in the grow tent is backed by measured trends rather than guesswork.
“Is it better to keep my cannabis grow log in a physical paper binder at the tent or in a smartphone app?”
Question sent by: Natalia Kensington, via contact form.
The best format is whichever one you will reliably fill out within 30 seconds of taking a measurement, which for most home growers is a waterproof paper clipboard hanging right on the tent pole paired with a weekly photo folder on a phone or computer. Having a physical sheet and pen next to your pH/EC meters eliminates unlocking a phone with wet or gloved hands, while transferring key weekly summaries to a spreadsheet makes multi-cycle graphing effortless.
If you use a smartphone for logging and photography, keep a dedicated wipeable case or stylus at the grow table so you never transfer foliar sap or fertilizer salts onto your everyday device.
Scientific References
- Cranshaw, W., Schreiner, M., Britt, K., Kuhar, T. P., McPartland, J., & Grant, J. (2019). Developing insect pest management systems for hemp in the United States: A hurdle approach. Journal of Integrated Pest Management, 10(1), 26.
- Bugbee, B. (2021). Principles of environmental and root-zone monitoring in controlled-environment cannabis production. Utah State University Crop Physiology Laboratory Extension Bulletin.
- Cavins, T. J., Whipker, B. E., Fonteno, W. C., Harden, B., McCall, I., & Gibson, J. L. (2000). Monitoring and managing pH and EC using the PourThru extraction method. North Carolina State University Cooperative Extension Horticulture Information Leaflet, 590.
- Punja, Z. K., Collyer, D., Scott, C., Lung, S., Holmes, J., & Sutton, D. (2019). Pathogens and molds affecting production and quality of Cannabis sativa L. Frontiers in Plant Science, 10, 1120.
Share this article
A quick overview of the topics covered in this article.
Follow us
Latest articles
November 9, 2026
November 9, 2026
November 9, 2026
November 9, 2026