
Grow Light Placement for SCROG Canopies
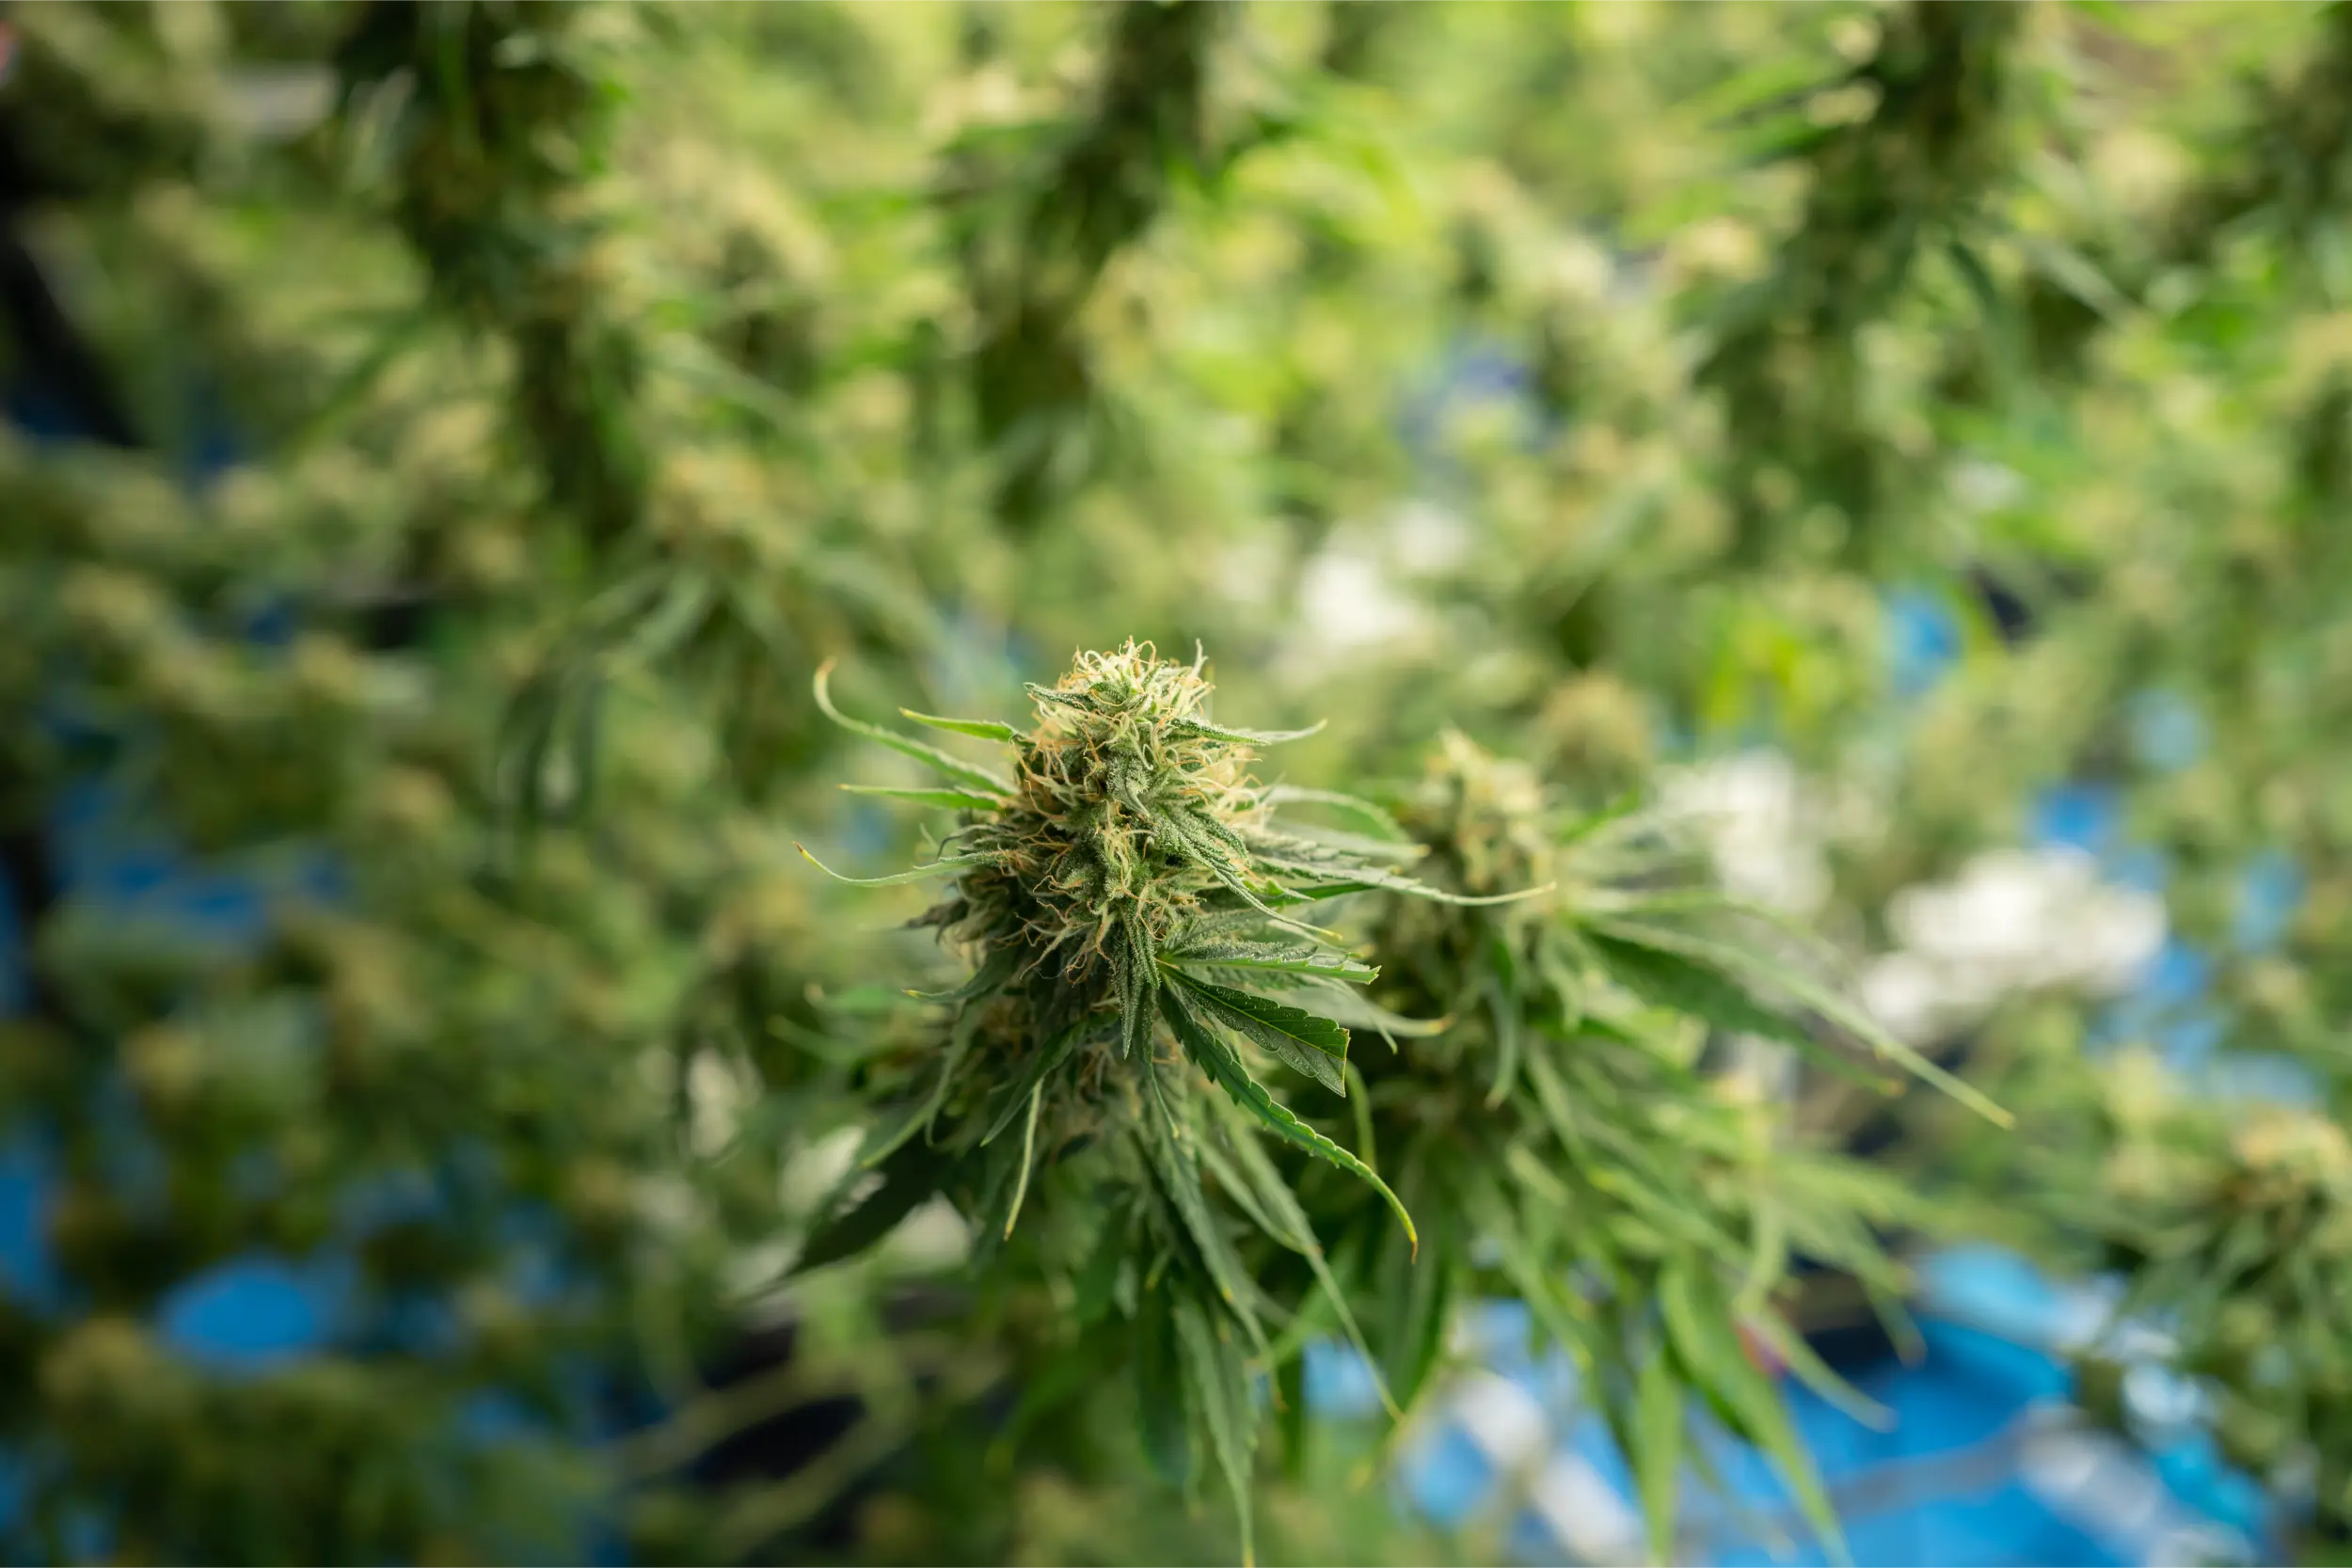
Screen of Green (SCROG) cultivation represents one of the most effective plant training methodologies for indoor cannabis production. By weaving vegetative branches horizontally through an inert mesh screen, growers transform an apical, Christmas-tree-shaped cannabis plant into a flat, two-dimensional photosynthetic carpet. This structural transformation levels the canopy surface, ensuring that every emerging terminal shoot and secondary floral site occupies the exact same horizontal plane. However, establishing a perfectly level botanical screen solves only half of the horticultural equation. The ultimate productivity, cannabinoid density, and harvest consistency of a SCROG system depend entirely on how you calibrate grow light placement above that screen.
When cannabis grows naturally without horizontal training, top colas absorb excessive photon flux while lower canopy tiers suffer from severe light starvation. In a SCROG arrangement, because the vertical depth of the active floral zone is compressed into a narrow 8 to 12 inch horizontal stratum, light placement errors carry exaggerated consequences. Hanging an LED fixture even three inches too close generates severe localized hotspots, bleached pistils, and stomatal closure in the center of the net. Conversely, mounting luminaires too high disperses photon density across tent perimeter walls, starving lateral edge colas of the micromoles needed to achieve commercial floral density.
Optimizing grow light placement for SCROG requires balancing three foundational physics principles: the inverse-square law of radiant flux, beam angle distribution from primary optics, and boundary overlap from multi-bar luminaire arrays. Unlike single-point High-Pressure Sodium (HPS) reflectors that require deep vertical clearance to disperse thermal radiant heat, modern horticultural LED bars permit closer canopy proximity. Yet proximity without meticulous spatial planning leads to severe photon heterogeneity across the screen. To harvest uniform, top-shelf flowers from the center of your net to the absolute tent perimeter, light placement must be treated as a quantifiable geometric calculation rather than guesswork.
This comprehensive technical guide provides an exhaustive blueprint for hanging, leveling, and calibrating grow lights above SCROG canopies. We examine the biophysical photobiology of horizontal leaves, evaluate how strain stretch, screen mesh dimension, and diode layout dictate minimum mounting distance, provide a repeatable 5-step PPFD mapping protocol, identify deceptive hotspot look-alikes, and detail field verification methods using quantum flux sensors and infrared thermography.
Direct Answer: Height, Uniformity, and Hanging Geometry Over a SCROG Screen
For a standard Screen of Green canopy illuminated by modern broad-spectrum bar LED luminaires, the optimal grow light placement maintains a hanging height of 12 to 18 inches (30 to 45 cm) above the upper floral tips during peak flowering, delivering an average Photosynthetic Photon Flux Density (PPFD) between 750 and 1,050 μmol/m²/s across 90 percent of the netted area. If using concentrated quantum board fixtures or legacy High-Pressure Sodium (HPS) luminaires, hanging clearance must be expanded to 20 to 28 inches (50 to 70 cm) to avoid leaf temperature spikes and extreme center photon concentration.
Canopy Photon Uniformity Ratio
The mathematical quotient of minimum measured PPFD divided by maximum measured PPFD across a defined horizontal grid (Min/Max PPFD). In an elite commercial SCROG canopy, the photon uniformity ratio across all screen quadrants should exceed 0.80 (80%), ensuring that perimeter edge buds receive nearly identical light energy to central shoots without requiring manual plant rotation.
Achieving this uniformity requires understanding that a SCROG canopy cannot be illuminated effectively using point-source lighting strategies. In a conventional garden, apical colas stretch upward toward a single focal point, naturally creating an uneven profile where light falloff matches lateral branch distance. In contrast, a SCROG screen presents an uncompromisingly flat plane of thousands of identical photosynthetic leaves. If your luminaire emits a bell-shaped intensity curve with 1,200 μmol/m²/s in the dead center and 350 μmol/m²/s at the outer perimeter net edges, the plants in the middle will suffer photoinhibition while perimeter colas remain airy and underdeveloped.
Field Rule: Never set your fixture height based solely on center PPFD readings. Measure your four outermost screen corners first. If your perimeter corners receive less than 65 percent of your center measurement, you must either raise the fixture height and increase drive current, or adjust bar spacing to flatten the photon footprint.
The Photobiology of Horizontal SCROG Canopies: LOP, PAR, and Lateral Nodes
The physiological mechanics of a SCROG canopy differ radically from natural vertical growth. When cannabis branches are bent horizontally and secured beneath a screen, gravitational cues and auxin distribution shift rapidly. Auxin, the primary plant hormone responsible for apical dominance, normally migrates down the main vertical stem from the terminal apex, actively suppressing the growth of secondary lateral nodes. When the dominant stem is pulled horizontal, auxin concentration redistributes evenly along the stem length, releasing every dormant lateral axillary bud from apical repression simultaneously.
Light Interception Efficiency and Leaf Optical Properties (LOP)
In an untrained cannabis plant, light extinction follows the Beer-Lambert Law of canopy light attenuation: photon flux drops exponentially as it penetrates through successive layers of vertical foliage. However, in an apical structure, intermediate foliage often sits at acute angles, reflecting substantial fractions of incoming photons sideways into surrounding walls. A perfectly trained SCROG canopy maximizes Light Interception Efficiency (LIE) by orienting nearly 100 percent of active leaf blades perpendicular to incoming vertical photons.
Cannabis foliage exhibits specific Leaf Optical Properties (LOP): healthy leaves absorb approximately 90 to 95 percent of blue and deep red photons, while reflecting and transmitting approximately 10 to 15 percent of green photons. When hundreds of lateral shoots form a continuous horizontal carpet, photon interception approaches theoretical maximums. Because light does not penetrate deeply past the dense upper horizontal leaf layer, lower canopy tiers must be strategically pruned (lollipopped) below the screen. The entire photosynthetic payload of the plant is concentrated into the top 8 to 12 inches of vertical growth emerging above the mesh.
Under-Screen Foliage Photosynthetic Debt
Foliage retained more than 6 inches below a dense SCROG screen operates below the light compensation point (typically receiving less than 80 μmol/m²/s PPFD). These shaded leaves consume more carbohydrate energy through dark cellular respiration than they generate through photosynthesis, acting as metabolic carbon sinks that diminish flower swelling in the upper canopy. Strip all foliage beneath the net before week three of flowering.
Photomorphogenesis and Internodal Spacing Control
During the first three weeks following the transition to a 12/12 photoperiod, cannabis undergoes the flowering stretch. The rate of stem elongation between nodes is governed by cryptochrome (blue light photoreceptors) and phytochrome photoequilibrium (Pfr/Ptotal ratios). If your grow light is placed too high above the screen during the transition phase, the localized photon flux density drops, prompting the plant to interpret the low light environment as shade. This triggers shade avoidance syndrome, causing emerging shoots to stretch uncontrollably through the mesh, ruining the flat SCROG architecture. Keeping fixtures lowered to maintain at least 500 to 650 μmol/m²/s during early stretch preserves tight internodal spacing and keeps the floral layer compact.
via Indoor Cultivation Forum
Question: I am running my first SCROG with an 8-bar 680W LED in a 4×4 tent. How far above the actual trellis net should my light be when I flip to 12/12, and how does that change as the buds grow up?
Expert Answer: At the flip to 12/12, your screen should be roughly 70 to 80 percent full of green foliage woven horizontally. Set your fixture 20 to 24 inches above the screen surface at 60 to 70 percent power, delivering around 550 to 650 μmol/m²/s across the net. As the shoots stretch vertically 6 to 10 inches above the mesh over the next 21 days, do not raise your light immediately. Allow the shoots to grow into the light until the distance between the fixture and the emerging bud tips narrows to 14 to 16 inches, while gradually dialing your dimmer up to 100 percent. This creates a rising PPFD curve that matches increasing photosynthetic enzyme capacity without shocking the plants.
Variables That Alter Placement: Screen Mesh, Stretch Index, and Diode Distribution
Grow light placement cannot be dictated by a single universal hanging distance. Three critical physical and biological variables dictate the precise geometry required for your specific grow room configuration: the structural dimensions of your screen, the genetic stretch index of your cultivar, and the physical form factor of your luminaire.
1. Screen Mesh Dimensions and Elevation
The physical construction of your SCROG net directly influences canopy density and vertical clearance:
- Mesh Aperture Size: Standard SCROG screens utilize square mesh apertures ranging from 2×2 inches (5×5 cm) to 4×4 inches (10×10 cm). Smaller 2-inch squares hold shoots down tighter, creating an ultra-flat horizontal plane that permits hanging lights closer (12 to 14 inches). Larger 4-inch squares allow branches to buckle and arch upward between grid intersections, producing an undulating canopy profile with 3 to 4 inches of peak-to-valley variance that demands a higher mounting distance (16 to 20 inches) to prevent crown bleaching.
- Screen-to-Pot Clearance: The distance between the container rim and the net (ideally 10 to 14 inches) determines under-canopy air circulation and irrigation access. If the screen is installed too low, humidity accumulates beneath the dense canopy, increasing boundary layer resistance and leaf temperatures, which reduces the canopy photon saturation threshold.
2. Genetic Stretch Index and Flower Structure
Cultivar genetics dictate both the morphological response to photon pressure and physical height gain:
- High-Stretch Cultivars (Narrow-Leaf Dominant / Sativa): Strains with a stretch multiplier of 2.0x to 3.0x continue extending shoots for up to four weeks after 12/12 induction. If luminaires are hung too high, these cultivars explode through the net and grow into the diodes. For high-stretch genetics, maintain photon flux at the upper threshold (650 to 750 μmol/m²/s) during transition to suppress excessive internodal elongation.
- Compact Cultivars (Broad-Leaf Dominant / Indica): Strains with low stretch (1.2x to 1.5x) produce dense floral clusters that barely clear the net. These compact canopies tolerate lower hanging heights (10 to 14 inches) with diffuse bar arrays, provided canopy airflow is sufficient to strip heat from leaf surfaces.
3. Luminaire Architecture: Multi-Bar Array vs Quantum Board vs COB
The optical emission pattern of your luminaire is the single most important mechanical factor determining hanging clearance:
Multi-bar LED arrays distribute lower-power diodes evenly across 6 to 8 aluminum extrusion bars spanning the entire footprint of the tent. Because each diode operates at lower drive current and photon emission is distributed across hundreds of square inches, multi-bar fixtures can be operated within 10 to 14 inches of a SCROG canopy with exceptional uniformity. In contrast, concentrated quantum boards or Chip-on-Board (COB) arrays focus immense photon flux onto compact central circuit boards. To allow the wide 120-degree beam angles of these concentrated sources to cross-illuminate and overlap before striking foliage, quantum boards require a minimum hanging clearance of 18 to 24 inches above the screen.
| Fixture Architecture | Minimum SCROG Clearance | Optimal SCROG Clearance | Photon Distribution Profile | Thermal Hotspot Risk |
|---|---|---|---|---|
| Multi-Bar Commercial LED (6-8 Bars) | 8 – 10 in (20 – 25 cm) | 12 – 16 in (30 – 40 cm) | Extremely Flat, Wall-to-Wall Overlap | Very Low (Diffuse Passive Dissipation) |
| Quantum Board / Large Flat Panel | 16 – 18 in (40 – 45 cm) | 20 – 24 in (50 – 60 cm) | Center-Weighted Bell Curve | Moderate (Direct Downward Radiation) |
| High-Power COB Matrix (Focused Lenses) | 22 – 26 in (55 – 65 cm) | 26 – 32 in (65 – 80 cm) | Intense Conical Spotlights | High (Severe Center IR & Photobleaching) |
| Single-Ended / Double-Ended HPS | 24 – 30 in (60 – 75 cm) | 30 – 36 in (75 – 90 cm) | Reflector-Dependent Batwing Curve | Extreme (High Radiant Infrared Heat Load) |
Step-by-Step Hanging Height and PPFD Mapping Procedure for SCROG
To eliminate guesswork, every grower should execute a calibrated spatial PPFD audit when setting up a SCROG canopy. This repeatable 5-step protocol establishes baseline uniformity, validates driver efficiency, and identifies precise hanging heights for vegetative training, early transition, and peak floral swelling.
Step 1: Level the Screen and Luminaire to Within 0.2 Degrees
Uniform light distribution requires parallel geometric planes. If your SCROG screen is perfectly horizontal but your LED fixture tilts down 1.5 inches on one side due to uneven ratchet hangers, the inverse-square law will introduce a 25 to 35 percent photon disparity between the left and right quadrants of your tent. Use a 24-inch torpedo spirit level or digital inclinometer. First, verify that your screen frame is level across both axes (X and Y). Next, place the level directly across the central chassis or aluminum bars of your luminaire and adjust suspension cables until the fixture is dead level.
Step 2: Establish a 9-Point or 16-Point Spatial Measurement Grid
Divide your horizontal SCROG footprint into a balanced grid using the screen mesh as your ruler. For a 3×3 or 4×4 screen, establish a 16-point grid (a 4×4 matrix of test points). Mark each measurement node with a colored zip tie directly on the mesh strings. The grid must include:
- Four outermost corner points (positioned 4 to 6 inches inward from the tent walls)
- Eight perimeter intermediate points along the four screen edges
- Four interior center points directly beneath the core diode array
Step 3: Measure Baseline PPFD at Benchmark Hanging Heights
Using a calibrated quantum flux PAR meter (such as an Apogee ePAR or MQ-500 sensor mounted on an extension wand), place the sensor head flat on the screen mesh at each marked grid coordinate with all tent doors and access zippers completely closed. Fabric walls reflect between 15 and 30 percent of lateral photons back into the screen; taking measurements with tent doors open produces artificially depressed perimeter readings.
Record values across three benchmark fixture heights: 12 inches, 16 inches, and 20 inches above the mesh. Calculate the Uniformity Coefficient for each height: divide the lowest measured corner reading by the highest center reading. The height that delivers a uniformity coefficient of 0.75 or higher while maintaining the required stage-specific average PPFD is your operational baseline.
Step 4: Calibrate Stage-Specific Dimmer Schedules
Instead of constantly adjusting ratchet cables up and down multiple times per week, modern cultivation best practice combines a fixed structural height with precision solid-state dimming. Set your fixture at its optimal peak-flowering height (typically 14 to 18 inches above the finished canopy target) and adjust output voltage via the dimmer knob:
- Late Vegetative Weaving: 400 – 550 μmol/m²/s (DLI: 26 – 36 mol/m²/day under 18 hours of light). Encourages rapid lateral stem elongation without photoinhibition.
- Transition & Stretch (Weeks 1-3): 550 – 700 μmol/m²/s (DLI: 24 – 30 mol/m²/day under 12 hours of light). Suppresses excessive internodal stretching while establishing bud sites.
- Peak Floral Bulking (Weeks 4-7): 800 – 1,050 μmol/m²/s (DLI: 35 – 45 mol/m²/day without supplemental CO&sub2;; up to 1,200 μmol/m²/s with 1,200 ppm CO&sub2;). Maximizes carbon assimilation and floral biomass.
- Late Ripening (Final 10-14 Days): 650 – 750 μmol/m²/s. Reduces thermal stress, preserving delicate monoterpenes and preventing chlorophyll degradation.
Step 5: Daily Inspection of Canopy Crown Elevation
During the vertical surge of weeks two and three of bloom, buds grow toward the light source at rates exceeding 0.5 to 1.0 inch (1.2 to 2.5 cm) per 24 hours. Because the inverse-square law dictates that radiant flux increases exponentially as distance closes, a fixture delivering 900 μmol/m²/s at 16 inches will deliver over 1,250 μmol/m²/s at 10 inches. Check canopy-to-diode clearance daily during early flowering. Raise fixture ratchet hangers in 1-inch increments to preserve your target clearance as the vertical flower tier forms.
The Multi-Bar SCROG Edge Transformation
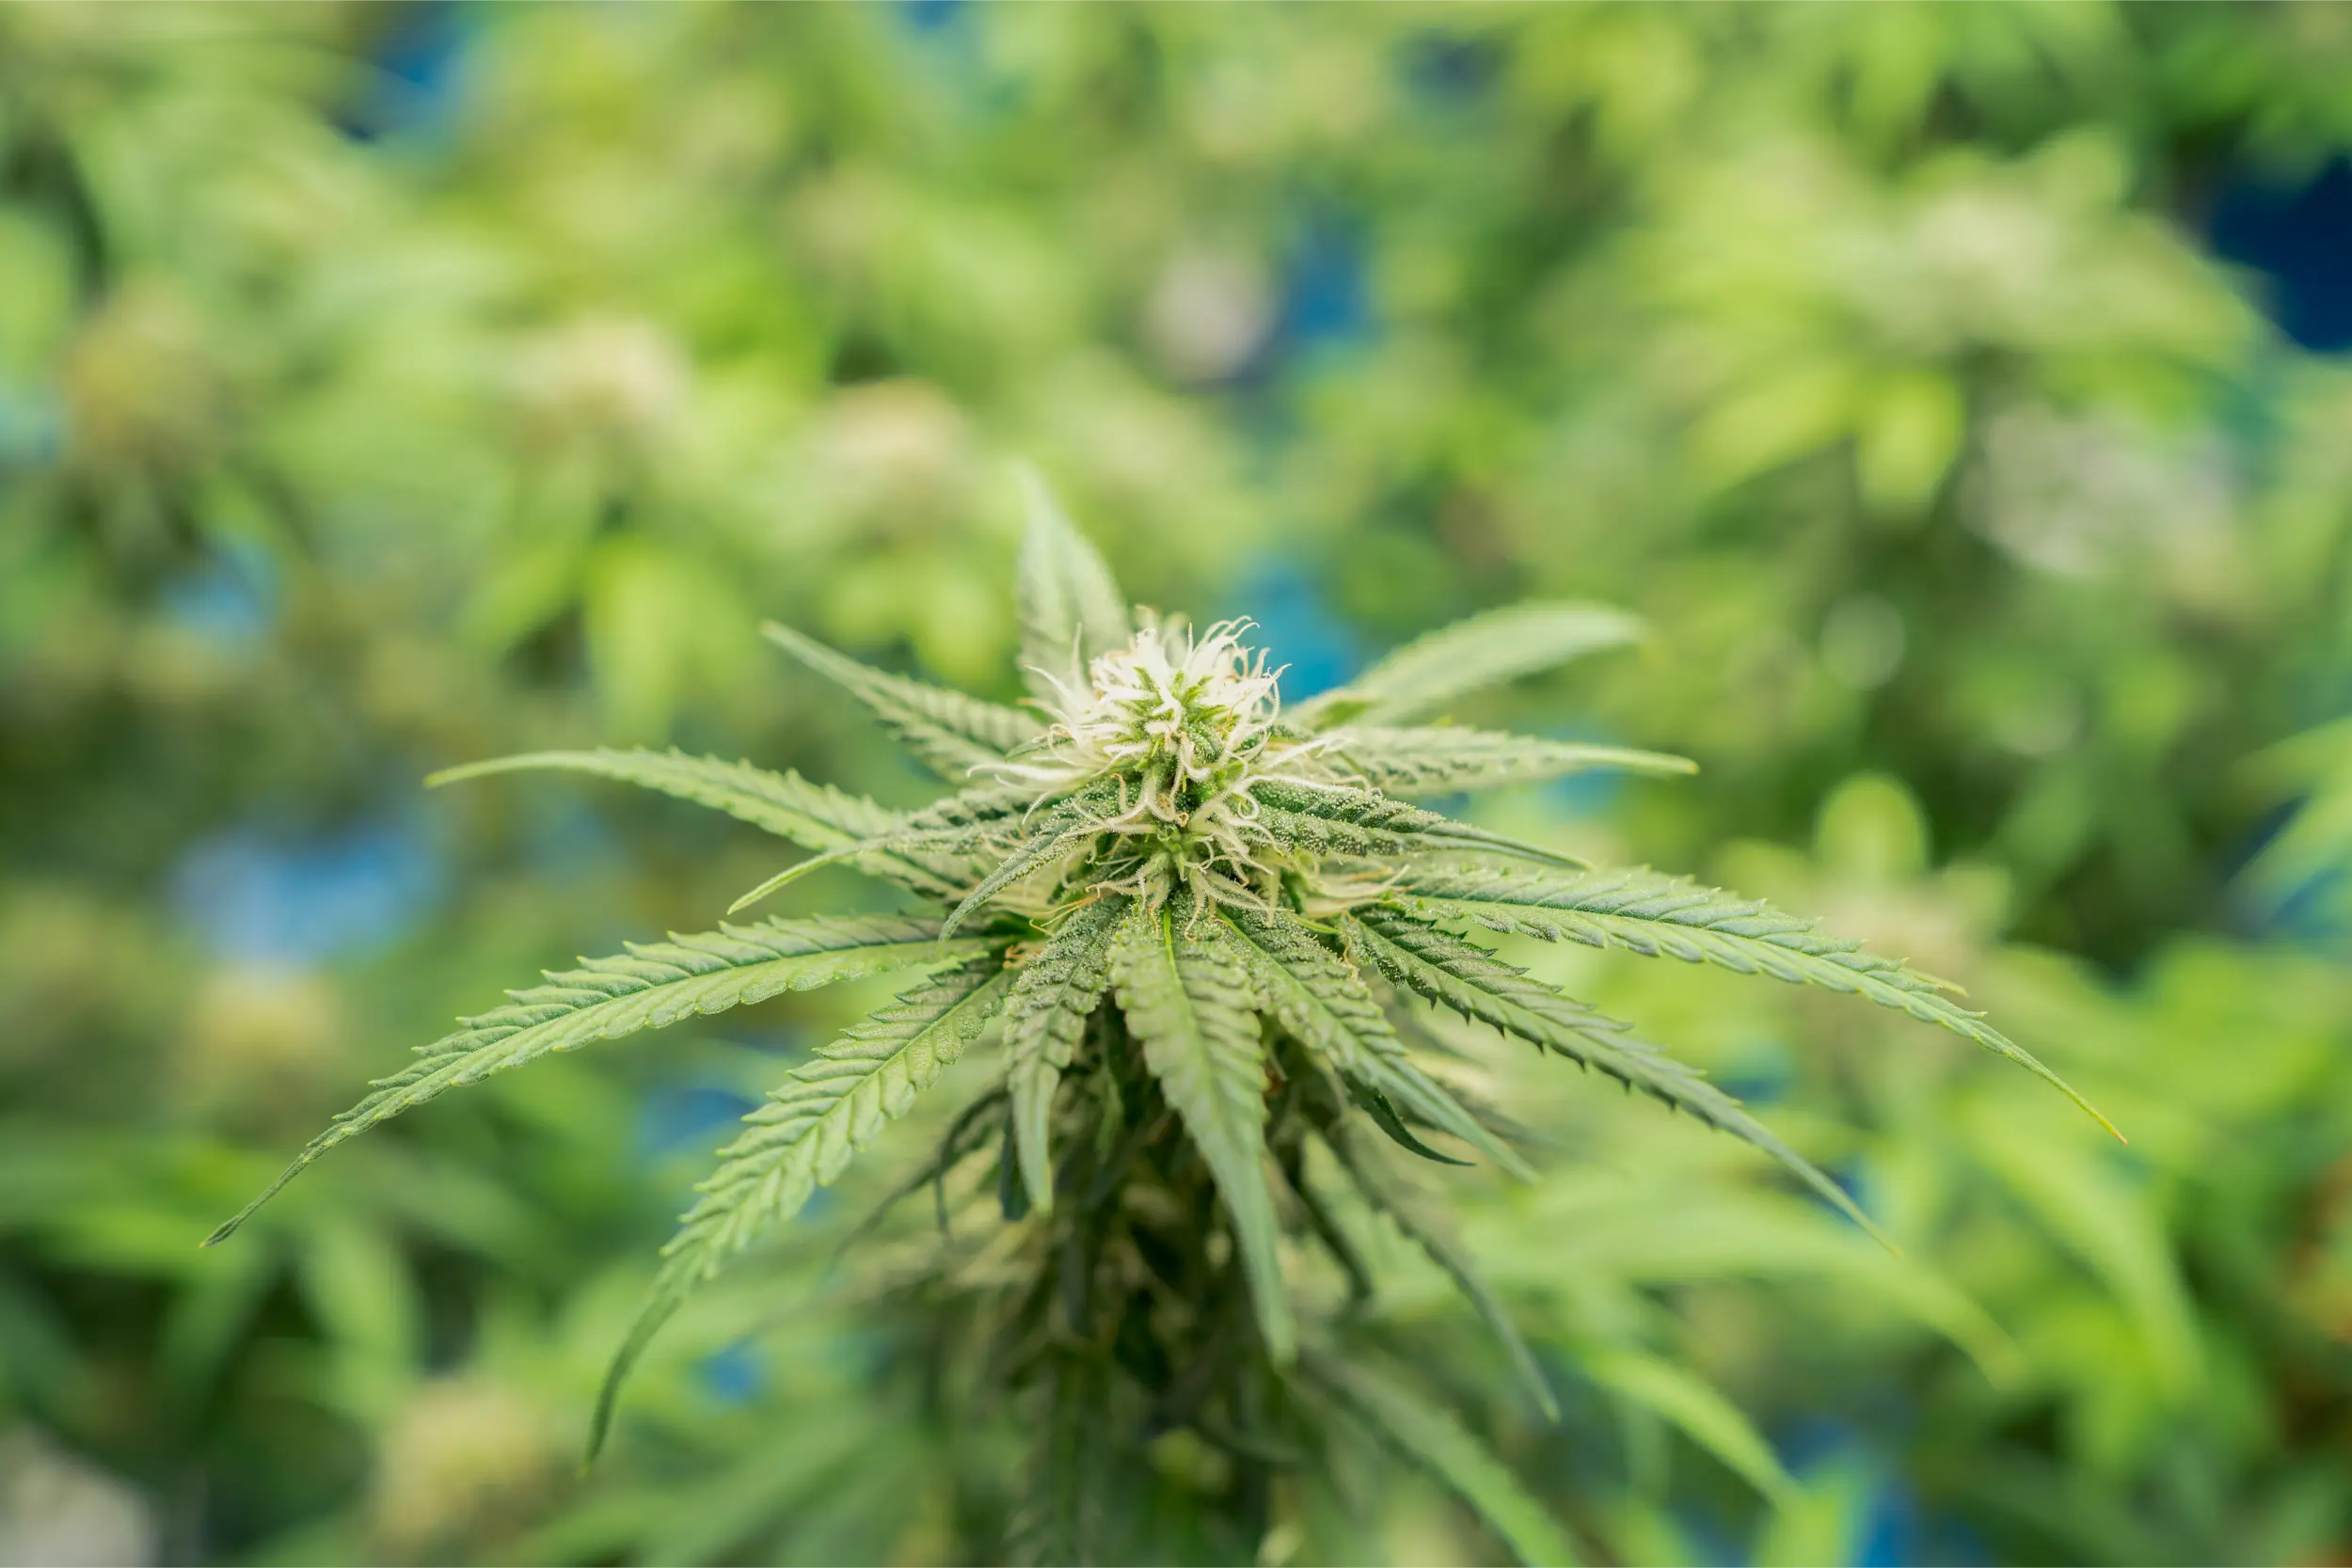
In our commercial facility audits, we frequently encounter growers using 600W quantum board panels hung 14 inches above 4×4 SCROG screens. Their harvest data consistently revealed severe quality stratification: center buds tested at 27% cannabinoids with rock-hard density, while perimeter buds beneath the identical screen yielded airy, larfy flower testing under 19%. By transitioning these rooms to 8-bar distributed LED luminaires hung at 15 inches, the corner-to-center PPFD uniformity ratio jumped from 0.48 to 0.84. Without increasing total facility wattage by a single watt, marketable A-grade flower yields increased by 22 percent across the perimeter squares.
Common SCROG Lighting Pitfalls, Edge Drop-Off, and Center Hotspots
Diagnosing light placement issues over a SCROG canopy requires separating photon-induced physiological symptoms from nutritional, thermal, and irrigation errors. Because horizontal screens pack high root mass into limited spatial boundaries, lighting mistakes frequently masquerade as root-zone deficiencies.
1. The Proximity Trap: Dropping Fixtures Too Low for “More Penetration”
A pervasive myth in indoor growing claims that dropping an LED fixture closer to the canopy improves light penetration through lower leaves. In a SCROG system, this practice is doubly harmful. First, as established by photobiological principles, upper leaves absorb 95% of red and blue photons regardless of proximity; lowering the light does not force photons past the horizontal barrier. Second, dropping the fixture narrows the beam angle intersection footprint, creating an intense central hotspot while catastrophically starving the perimeter screen edges. Raising the light by 4 inches and increasing drive current flattens the photon field, delivering vastly superior whole-canopy photosynthetic assimilation.
2. Photobleaching vs Nitrogen/Iron Chlorosis
When central buds in a SCROG net receive photon flux exceeding their photosynthetic saturation capacity (>1,150 μmol/m²/s without CO&sub2; enrichment), Photosystem II reaction centers overload. Chlorophyll molecules degrade faster than the plant can synthesize new pigments, resulting in stark white, bleached upper flower tips. Novice cultivators frequently mistake photobleaching for iron deficiency or nitrogen chlorosis and apply heavy nutrient flushes or micronutrient supplements. The diagnostic differentiator is purely spatial: photobleaching occurs exclusively on the top surfaces of floral crowns located directly beneath the central diodes, while leaves shaded by the net retain deep, lush green coloration.
3. Leaf Canoeing and Tacoing from Thermal IR Radiation
When grow lights are hung too close to a SCROG screen, the combination of high photon pressure and radiant heat increases the Vapor Pressure Deficit (VPD) at the leaf surface beyond tolerable limits. Leaf serrations curl upward into a canoe or taco shape as stomata close to minimize transpirational moisture loss. If this occurs across the center of your screen while edge plants remain flat and relaxed, your fixture is too low or your horizontal air circulation is insufficient to break the boundary layer.
via Cultivation Masterclass
Question: The center colas on my SCROG are 12 inches from my LED and looking slightly pale, but my corner colas are 18 inches away and dark green. Should I raise the whole light, or can I just tie the center colas down lower?
Expert Answer: If you are still in weeks 2 to 4 of flowering, gently supercrop or pull the taller central colas sideways beneath an adjoining screen square to level the physical canopy. However, if your stems have already lignified and become rigid (week 5 onward), attempting to bend them risks snapping primary floral branches. In that scenario, raise your fixture 3 to 4 inches immediately and increase your overall dimmer output by 10 to 15 percent. This reduces the intense focal photon flux on your central colas while raising the light levels on your lagging perimeter edges, restoring canopy metabolic balance.
What to Do
- Maintain luminaire chassis dead level with your SCROG screen using a torpedo spirit level.
- Adjust dimmer output first to change intensity, preserving optimal beam spread and overlap.
- Map PPFD with all tent doors completely closed to capture reflective wall bounce.
- Ensure oscillating fans sweep airflow across the 12-inch gap between fixture and screen.
- Prune all foliage and tertiary shoots located more than 6 inches below the mesh plane.
What to Avoid
- Do not drop multi-bar LEDs closer than 10 inches to force light into lower under-screen tiers.
- Avoid measuring PPFD exclusively at the center while ignoring 40% light drop-offs at tent edges.
- Do not allow flexible trellis netting to sag in the middle, creating a concave canopy bowl.
- Avoid diagnosing center flower bleaching as a root-zone nutrient deficiency.
- Do not use single-point HPS or focused COBs at close proximity over horizontal screens.
How to Verify Uniformity: Quantum Sensors, Thermal Imaging, and Bud Density
Validating whether your grow light placement is dialed in requires objective, repeatable measurements rather than visual inspection with human eyes. The human eye adapts automatically to luminance levels through pupil dilation, making it impossible to detect a 250 μmol/m²/s photon disparity across a green screen. Employ these three verification methods throughout your flowering cycle.
Target Photometric and Thermal Metrics for SCROG Canopies
| Metric / Measurement | Vegetative Weaving | Transition Stretch | Peak Bloom (Weeks 4-7) | Late Ripening |
|---|---|---|---|---|
| Center PPFD (μmol/m²/s) | 450 – 550 | 600 – 750 | 850 – 1,050 | 650 – 750 |
| Corner / Edge PPFD (μmol/m²/s) | 350 – 450 | 500 – 650 | 700 – 900 | 550 – 650 |
| Min/Max Uniformity Ratio | ||||
| Canopy Surface Temp Delta (°F) | ||||
| Target Daily Light Integral (mol/m²/d) |
1. Full-Grid Quantum PAR Sensor Mapping
Using an ePAR or standard PAR sensor, map your 16 grid coordinates once per week throughout the flowering cycle. Calculate both the Min/Max uniformity ratio (lowest reading divided by highest reading) and the Average PPFD. If your uniformity ratio dips below 0.75, your fixture is mounted too close to the screen. Raise the fixture in 2-inch increments until your uniformity exceeds 0.80, then compensate for the slight drop in average intensity by dialing up your driver output.
2. Infrared (IR) Thermography and Leaf Temperature Deltas
Leaf temperature governs the internal enzymatic reactions of photosynthesis. Use an infrared radiometer or thermal imaging camera to measure leaf surface temperatures across the screen. Under LED lighting, leaf temperature typically runs 2 to 4 degrees Fahrenheit below ambient air temperature due to active transpirational cooling. If leaves directly beneath the center of your luminaire register surface temperatures equal to or higher than ambient room air (e.g., 82 °F leaf temp in an 80 °F room), those leaves are experiencing severe radiative thermal stress and stomatal closure. Increase hanging clearance immediately.
3. Post-Harvest Caliper and Calyx Density Audits
The ultimate biological verification occurs at harvest. Sample ten primary colas from the central four squares of your SCROG and ten colas from the outermost perimeter squares. Weigh each sample group wet, then dry them under identical environmental conditions (60 °F / 60% RH) for 14 days. Calculate the average dry weight per cola and measure bud diameter with digital calipers. In a well-calibrated SCROG with balanced light placement, average perimeter cola weight will reach at least 85 percent of center cola weight, confirming true canopy parity.
via Craft Cultivators Guild
Question: My tent walls are bowing inward slightly from strong exhaust negative pressure. Does that change how I should hang my light over my SCROG?
Expert Answer: Yes, significantly. Inward bowing tent fabric narrows your reflective boundary and alters the angle of reflective return photons. Instead of bouncing light back onto your outer screen squares, bowed walls reflect photons downward into your runoff trays or directly back into the light fixture chassis. Install rigid space booster clips or tent reinforcement poles on your vertical frame corners to hold the fabric taut. This restores your reflective boundary geometry and boosts perimeter SCROG PPFD readings by 8 to 12 percent without changing fixture height.
Final SCROG Light Placement Checklist and Next Weedth Resources
Before flipping your garden to a 12/12 flowering photoperiod, run through this comprehensive operational checklist to ensure that fixture suspension, spatial clearance, and environmental integration are fully aligned with your SCROG canopy goals.
Scientific References
- Zhen, S., & Bugbee, B. (2020). Far-red photons have equivalent efficiency to traditional photosynthetic photons: Implications for redefining photosynthetically active radiation. Plant, Cell & Environment, 43(5), 1259-1272. DOI: 10.1111/pce.13730
- Eichhorn Bilodeau, S., Wu, B. S., Rufyikiri, A. S., MacPherson, S., & Lefsrud, M. (2019). An update on plant photobiology and implications for cannabis production. Frontiers in Plant Science, 10, 296. DOI: 10.3389/fpls.2019.00296
- Nelson, J. A., & Bugbee, B. (2014). Economic analysis of greenhouse lighting: light emitting diodes vs. high pressure sodium. PLOS ONE, 9(6), e99010. DOI: 10.1371/journal.pone.0099010
- Poorter, H., Fiorani, F., Pieruschka, R., Wojciechowski, T., van der Putten, W. H., Kleyer, M., Schurr, U., & Postma, J. (2012). Pampered inside, pestered outside? Differences and similarities between plants growing in controlled conditions and in the field. New Phytologist, 195(3), 550-562. DOI: 10.1111/j.1469-8137.2012.04231.x
- Marcelis, L. F. M., Broekhuijsen, A. G. M., Meinen, E., Nijs, E. M. F. M., & Raaphorst, M. G. M. (2006). Quantification of the effect of light quantity on crop yield. Acta Horticulturae, 711, 351-360. DOI: 10.17660/ActaHortic.2006.711.45
- Taiz, L., Zeiger, E., Møller, I. M., & Murphy, A. (2015). Plant Physiology and Development (6th ed.). Sinauer Associates, Sunderland, MA.
Share this article
A quick overview of the topics covered in this article.
Follow us
Latest articles
October 29, 2026
October 29, 2026
October 29, 2026