Grow Room Sensor Placement and Data Logging
In high-performance indoor cannabis cultivation, environmental automation is only as intelligent as the data feeding its control loops. Advanced commercial climate computers, modulating variable-speed fans, and inverter-driven HVACD systems rely entirely on electronic transducers to make millisecond thermodynamic decisions. If an environmental sensor is improperly positioned (hung bare beneath a high-intensity LED light bar, mounted against a cold exterior foundation wall, or trapped in an unventilated stagnant corner), it reports corrupted physical data. The automated climate controller reacts to this distorted feedback, triggering cascading mechanical errors that overheat the canopy, drive relative humidity into danger zones, and ruin harvest quality.
Sensor placement and data logging are not secondary aesthetic choices; they represent the sensory nervous system of the controlled environment facility. Cultivators who make multi-thousand-dollar equipment investments often undermine their entire operation by taping cheap thermo-hygrometers to tent fabric walls or suspending bare probes directly above hot electrical drivers. Establishing true environmental control requires understanding transducer physics, radiation shielding, boundary layer microclimates, and multi-point spatial telemetry.
Biophysical Principle: The Radiative Photon Absorption Error
Solid-state temperature thermistors and capacitive humidity sensors possess physical mass and dark polymer or metallic housings. When suspended unprotected beneath high-intensity horticultural lighting emitting 900 to 1,200 μmol/m²/s PPFD, the dark housing absorbs radiant photonic energy directly. This converts electromagnetic radiation into sensible heat through contact conduction, heating the internal thermistor far above true ambient air temperature. Unshielded sensors routinely exhibit a positive radiation bias of 3 to 6 degrees Celsius (5 to 11 degrees Fahrenheit), which artificially depresses the reported relative humidity by 15 to 25 percent.
This radiant absorption error represents the single most common false-positive environmental failure in indoor cultivation. When a grower observes an unshielded sensor displaying 31 degrees Celsius and 45 percent relative humidity, their automated controller calculates an alarming Leaf Vapor Pressure Deficit (VPD) exceeding 2.0 kPa. The controller commands exhaust fans to ramp to 100 percent speed or throttles dehumidification, attempting to correct an environmental crisis that does not actually exist. Meanwhile, the actual air bathing the foliage is a comfortable 26 degrees Celsius with 60 percent relative humidity, perfectly positioned within optimal metabolic bounds.
Eliminating this error requires housing every environmental transducer inside an active aspirated radiation shield. An aspirated shield utilizes a reflective, dual-wall concentric white plastic housing paired with a continuous miniature 12-volt fan. The fan draws ambient air across the sensor probes at a constant velocity (approximately 2 to 3 meters per second) while the reflective louvered shell completely blocks radiant photons from striking the sensor housing. Aspirated shielding ensures that the sensor measures true convective air temperature and actual vapor pressure, completely decoupled from radiant light energy.
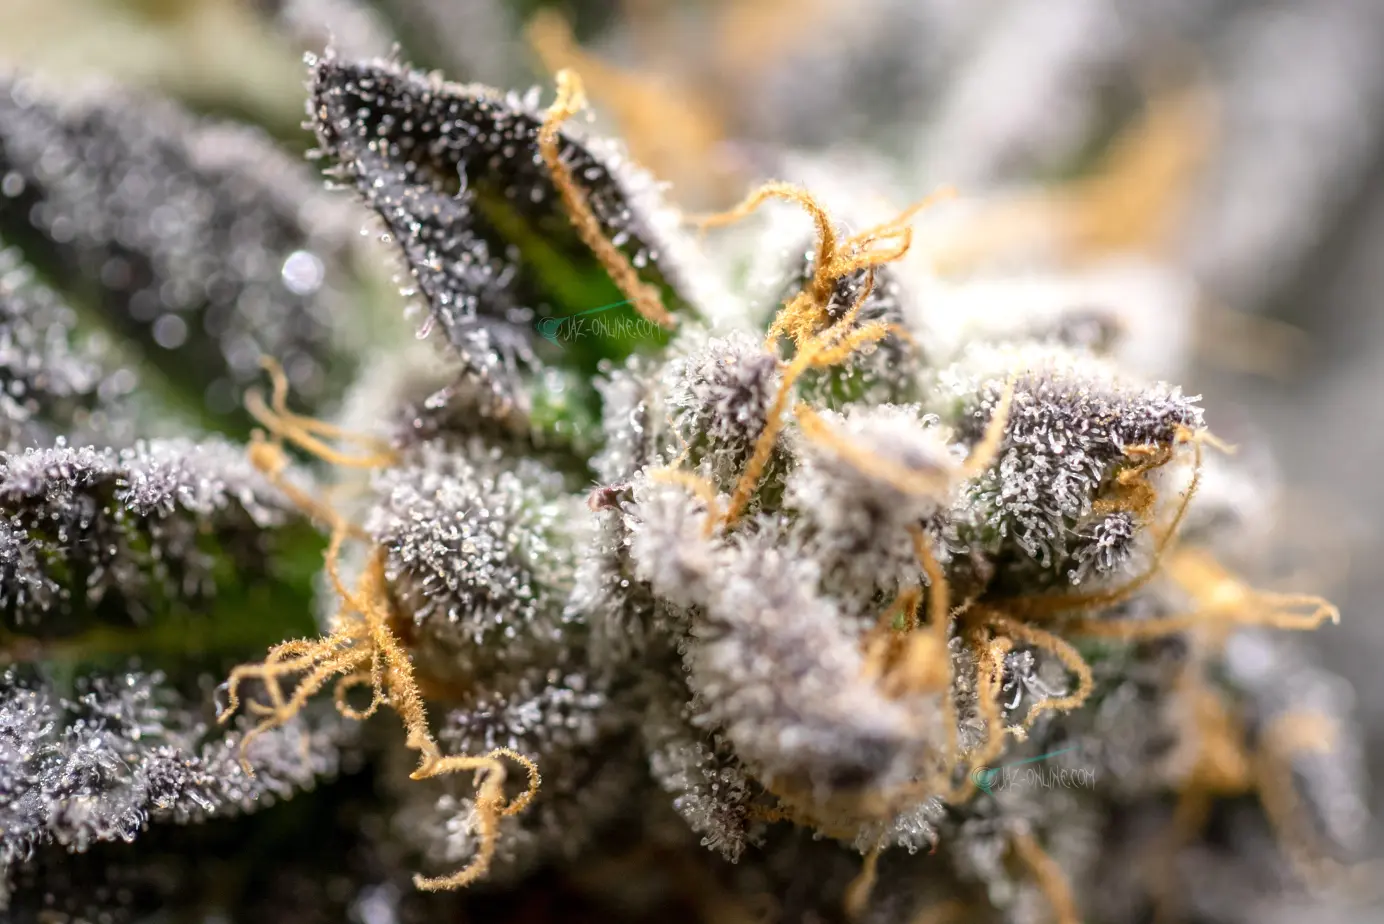
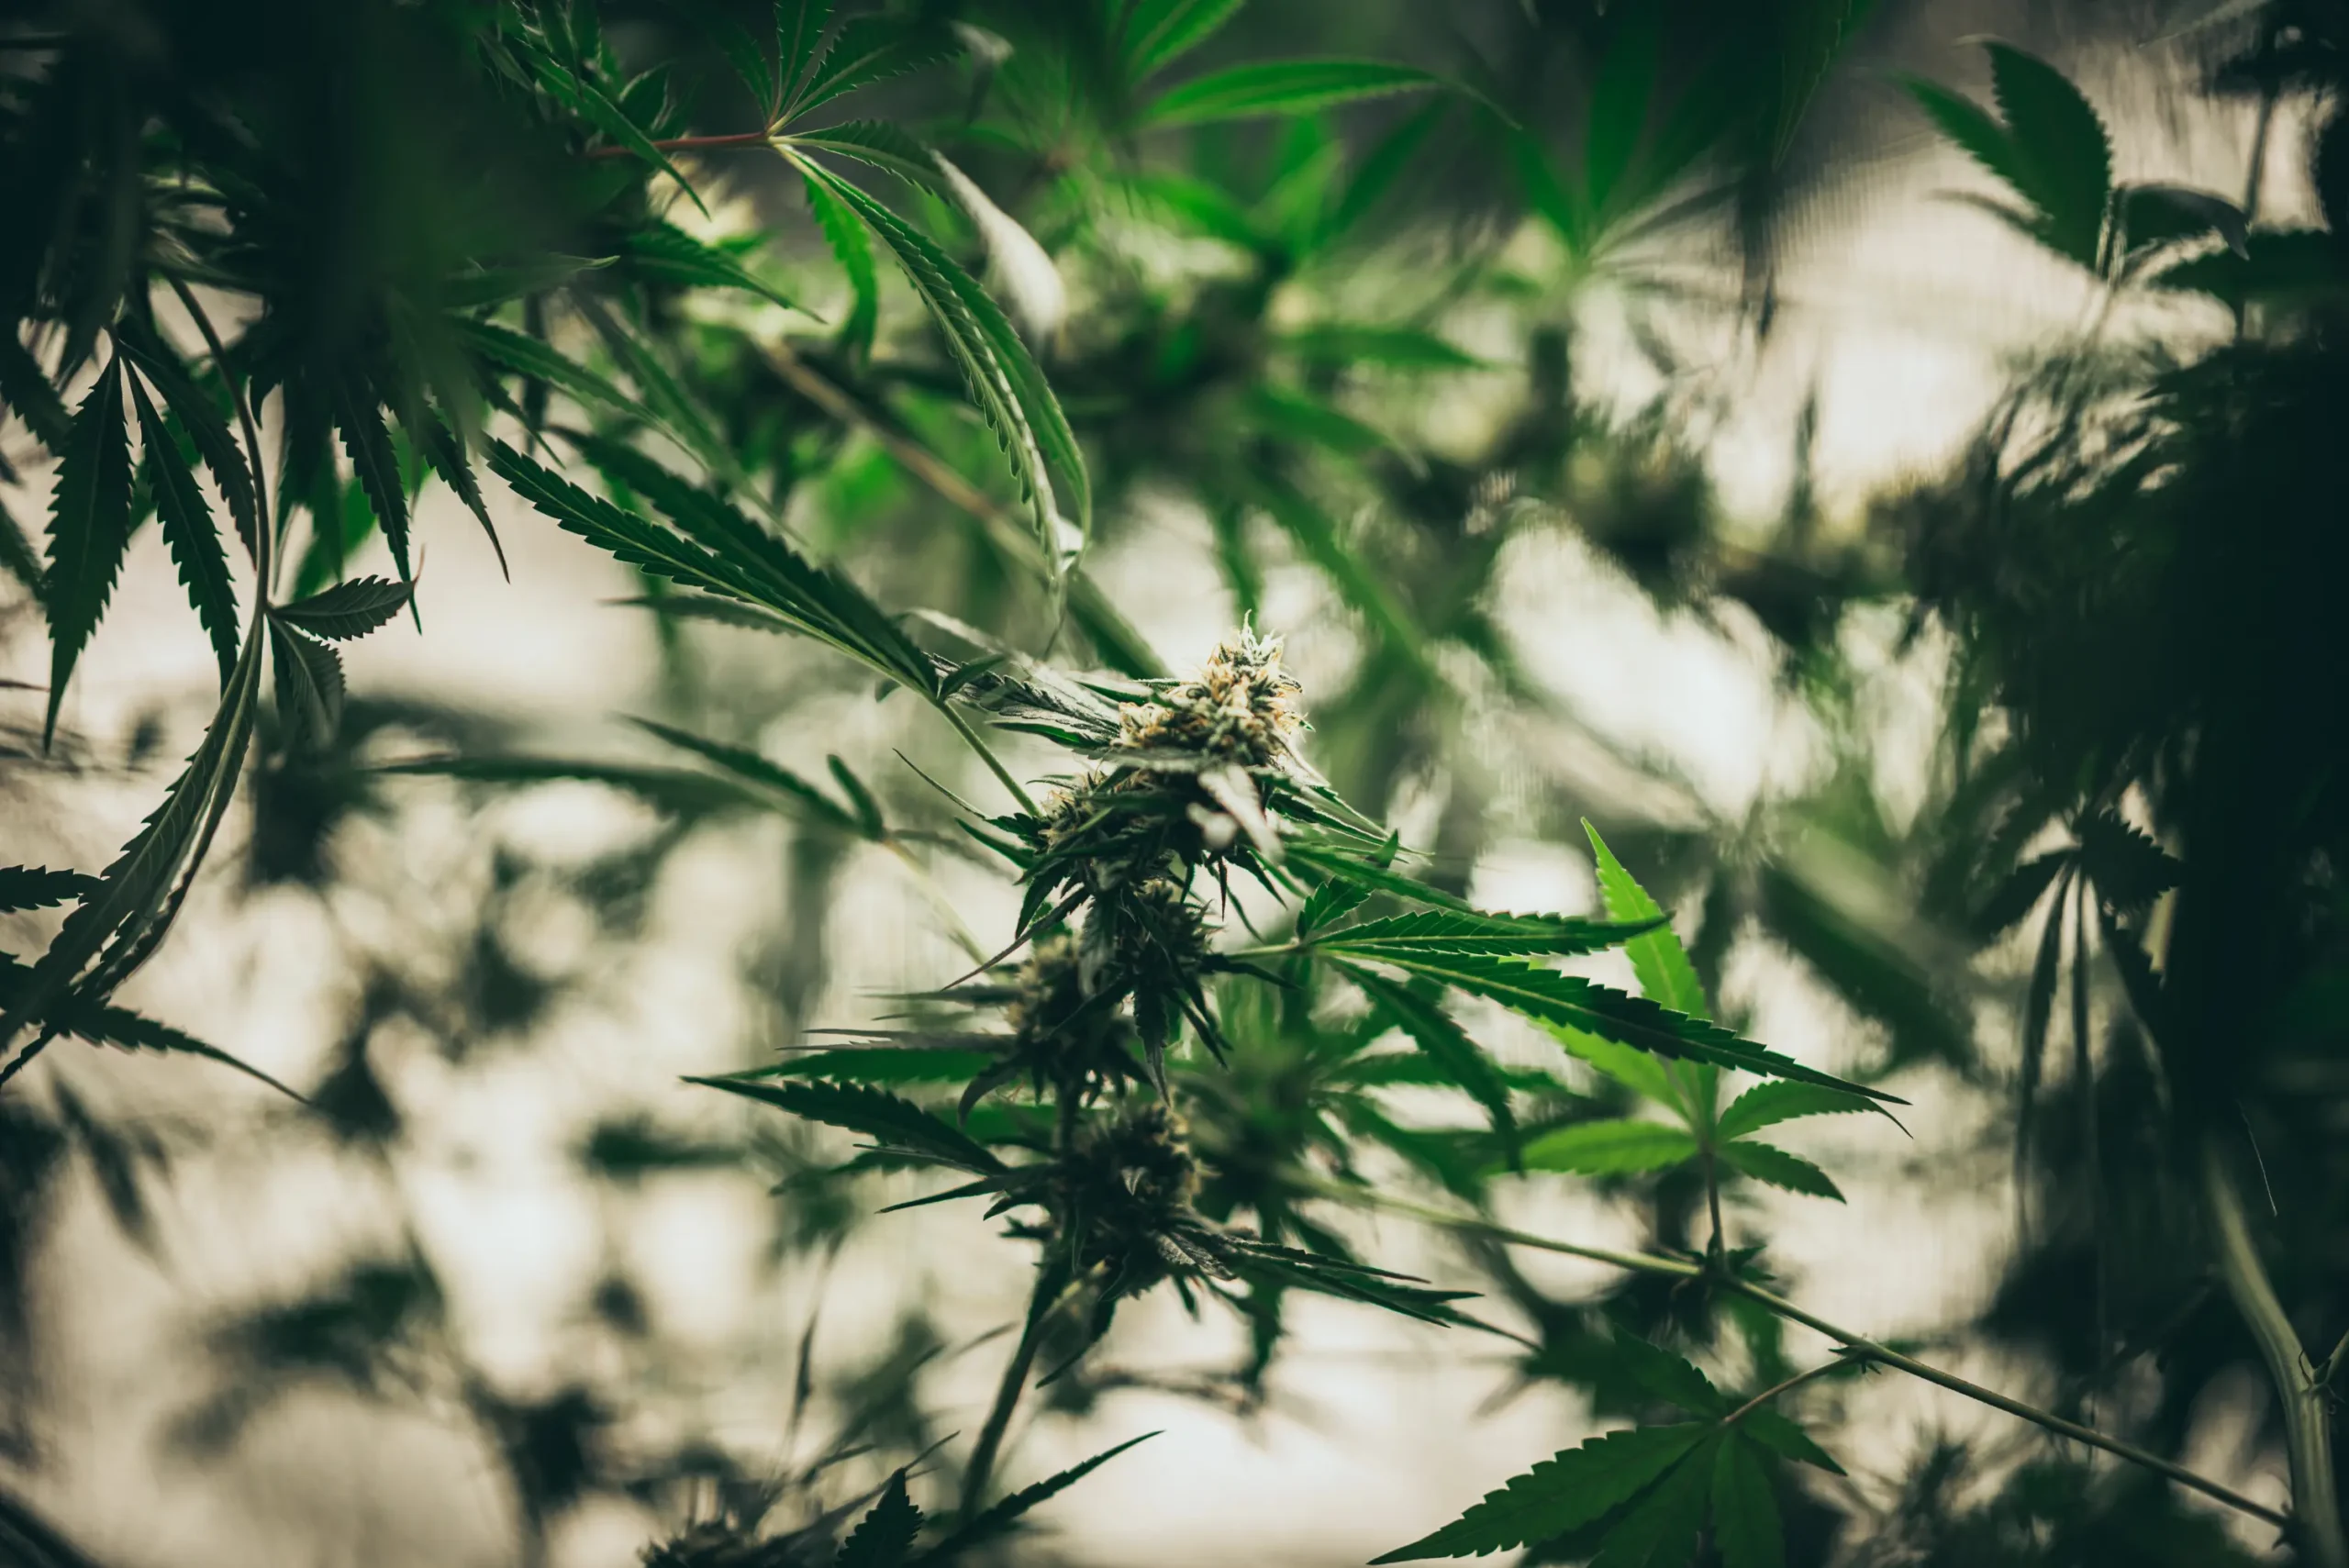
Active aspirated radiation shield suspended at canopy level, continuously sampling bulk air while blocking direct photon radiation from high-intensity LED fixtures.
Furthermore, indoor cultivation facilities are not homogeneous fluid cubes; they are complex microclimatic landscapes characterized by thermal stratification, transpirational humidity plumes, and localized airflow dead zones. Relying on a single sensor to govern an entire cultivation room guarantees blind spots. Professional facilities implement spatial grid telemetry, deploying distributed sensor nodes to map microclimatic variations and track historical trend lines over time.
This guide provides a comprehensive engineering framework for sensor placement, wiring topology, data logging architecture, and sensor maintenance. By eliminating transducer bias and implementing structured analytical logging, cultivators transform environmental guesswork into repeatable, commercial-grade horticultural precision.
Defining Spatial Constraints: Room Dimensions, Microclimates, and Transducer Limits
Before purchasing sensor hardware or programming automation hubs, cultivators must analyze the physical space constraints that dictate atmospheric distribution. Every enclosed room possesses three distinct environmental zones: the upper ceiling heat accumulation zone, the middle active canopy transpirational zone, and the lower under-bench drainage and root zone.
Transducers placed in the upper ceiling zone (above the lighting plane) measure the superheated convective plume rising from LED heat sinks and electrical ballasts. While this data is valuable for measuring exhaust heat removal efficiency, using a ceiling sensor to govern room cooling guarantees that the plant canopy will be severely overcooled. Conversely, placing sensors on perimeter walls exposes probes to building envelope conduction. During winter, a sensor mounted against an uninsulated exterior concrete wall reads several degrees colder than the actual canopy, causing heating systems to cycle excessively.
Where is the exact best height to hang my temperature and humidity sensor inside a 4×4 grow tent under a 650-watt LED light?
The sensor must be suspended at the exact level of the upper canopy, positioned in the center of the plant canopy footprint, and housed inside an aspirated radiation shield. As your plants grow and stretch during vegetative and flowering stages, you must adjust the hanging height of the sensor weekly to keep it level with the top sun leaves. Never mount it to the tent corner poles or hang it directly below the light without shielding, as radiant heat will distort your readings.
Question sent by: Sean, via email.
Sean’s question highlights the dynamic nature of canopy sensor placement. A static sensor mounted at a fixed height becomes obsolete as crops develop. In early vegetative growth, a sensor suspended five feet off the ground measures open room air while seedlings sit two feet below in high-moisture potting soil. During late bloom, a dense canopy can stretch past a low-hanging sensor, burying the probe beneath foliage where stagnant transpirational moisture artificially elevates relative humidity readings.
Sensors must be mounted on adjustable ratcheting rope hangers or motorized positioning brackets, allowing cultivators to maintain the probe strictly within the active boundary layer zone: between two and four inches beneath the top of the upper leaf plane. This ensures that the environmental computer receives continuous telemetry from the exact microclimate where photosynthesis, stomatal gas exchange, and transpirational cooling occur.
Vertical profiling audits provide crucial insights into canopy penetration and thermal stratification. In tall flowering canopies reaching four to five feet in height, temperature and humidity vary dramatically from top colas down to lower lateral branches. Top colas bathed in intense photon flux absorb radiant heat, while under-canopy foliage experiences dense transpirational humidity accumulation with lower light levels. Suspending secondary aspirated sensor probes at the mid-canopy level (approximately 24 inches below the upper sun leaves) reveals the true vertical microclimatic delta, allowing growers to optimize under-canopy defoliation (lollipopping) and adjust oscillating fan angles to eliminate humid stagnant pockets before Botrytis spores can germinate.
Layout Architecture Before Equipment Purchase: Sensor Grid Geometry and Airpath Alignment
In medium and large commercial cultivation rooms, microclimatic gradients expand significantly. Air entering from supply diffusers is cool and dry, while air exiting the canopy toward return grilles is warm and humid. Engineering an accurate data acquisition network requires aligning sensor positions with the primary airflow axis of the room.
Commercial facilities deploy a 3×3 or 4×4 horizontal spatial grid, placing dedicated sensor nodes across multiple quadrants of the room. A standard commercial room containing 24 to 36 lighting fixtures should incorporate a minimum of four aspirated canopy sensor nodes, supplemented by dedicated supply-duct and return-duct temperature and humidity sensors. Comparing the supply air enthalpy against the return air enthalpy allows facility management systems to calculate real-time sensible heat extraction and total canopy transpirational mass flow continuously.
Aerodynamic Rule: Airflow Velocity Alignment for Aspirated Shields
Aspirated radiation shields must be oriented parallel to the prevailing horizontal circulation currents in the room. The intake port of the shield should face into the gentle breeze created by oscillating fans, ensuring that ambient canopy air enters the housing without aerodynamic backpressure or stagnation. Never place an aspirated sensor directly in the high-velocity discharge path of a duct diffuser or inline fan; high air velocity (> 2.5 m/s) strips moisture prematurely and induces acoustic vibration that can loosen low-voltage wiring terminals.
In addition to atmospheric air sensors, professional layouts must integrate specialized contact and remote transducers. Infrared canopy temperature sensors (thermal radiometers) should be installed on overhead structural unistruts, aimed downward at a 45-degree angle across the upper leaf canopy. These infrared radiometers measure the absolute foliar surface temperature (Leaf Temp), which is essential for calculating true Leaf VPD.
Root-zone sensor integration is equally critical. Time-Domain Reflectometry (TDR) or Frequency-Domain Reflectometry (FDR) soil moisture probes should be inserted horizontally into substrate containers at the mid-depth root zone. These multi-parameter probes measure volumetric water content (VWC percentage), substrate pore-water electrical conductivity (EC), and root-zone temperature. Integrating root-zone telemetry with atmospheric data allows cultivators to link irrigation dry-back curves directly with transpirational VPD demand.
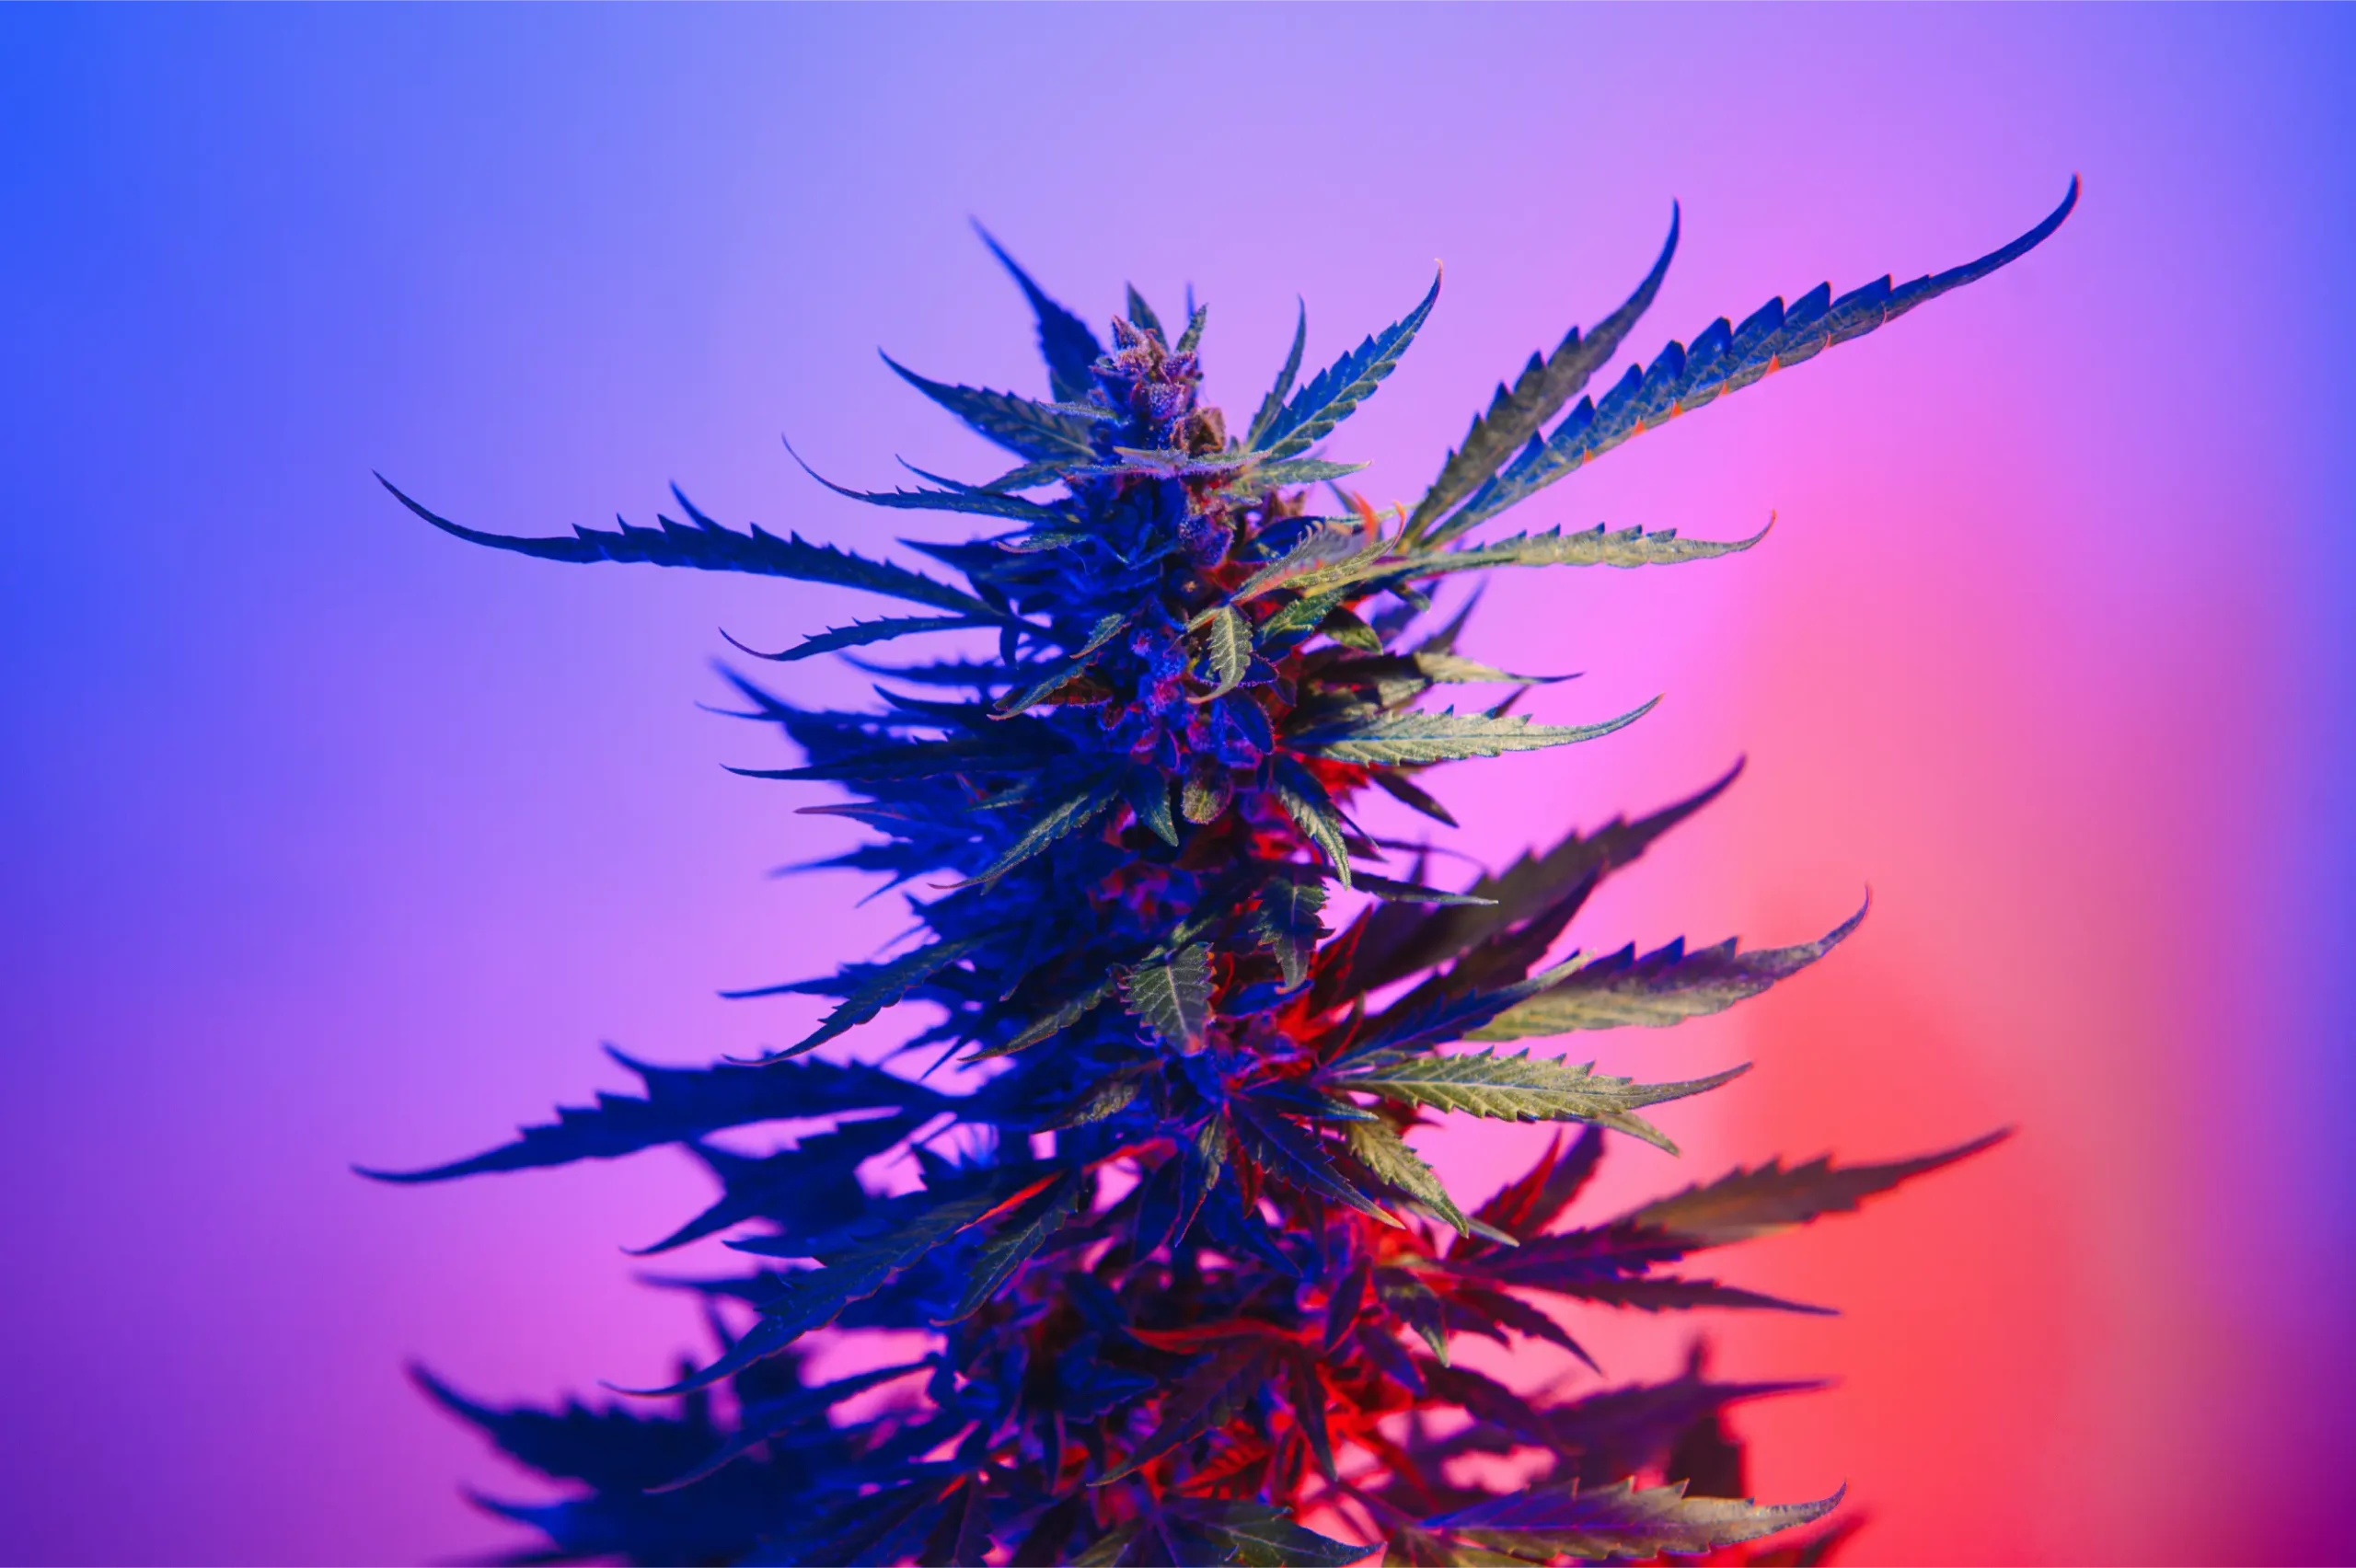
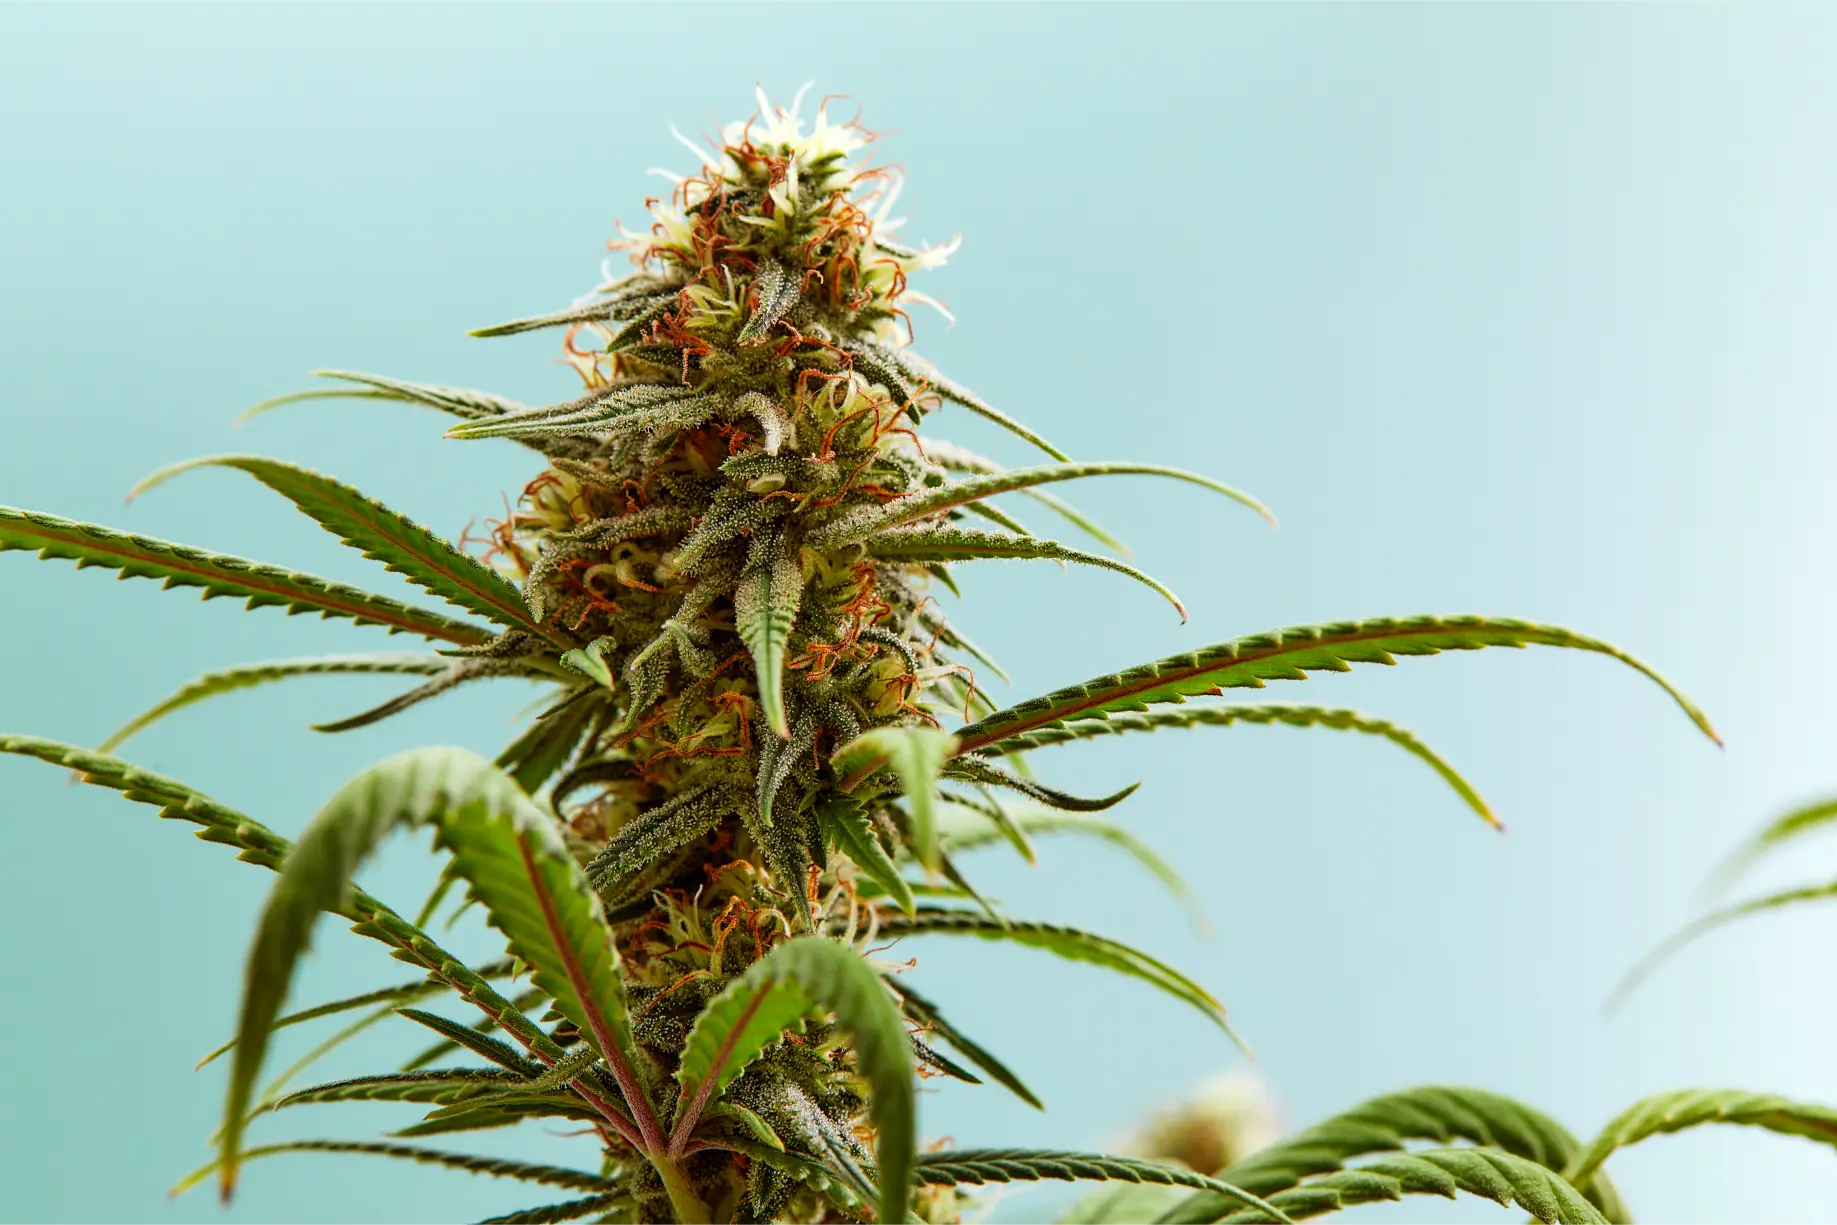
Dense late-stage flowering canopy monitored by multi-point sensor telemetry, ensuring uniform vapor pressure deficit and temperature across all bench quadrants.
Sensor cable routing must follow strict electrical separation protocols. Low-voltage sensor signal cables (typically 0-10V, 4-20mA, RS-485 Modbus, or 1-Wire digital lines) carry micro-volt signals that are highly vulnerable to electromagnetic interference (EMI). Running sensor cables parallel to high-voltage AC electrical lines feeding LED fixtures, electronic ballasts, or motor variable-frequency drives (VFDs) induces electrical noise into the signal wires, causing sensor values to spike and jitter erratically.
Low-voltage telemetry cables must be run inside dedicated grounded metallic conduit or suspended in separate low-voltage cable trays maintained at least 12 inches away from high-voltage AC conductors. When sensor cables must cross AC power lines, they must cross at a strict 90-degree right angle to minimize inductive coupling. Utilizing shielded twisted-pair (STP) cabling with drain wires grounded at the controller panel ensures clean, noise-free data transmission.
Equipment Selection and Telemetry Architecture: Sizing Data Resolution
Selecting the appropriate sensor technology dictates the accuracy, response time, and longevity of the environmental control system. Cultivators must choose sensors engineered specifically for harsh, high-humidity agricultural environments rather than generic consumer electronics.
Relative humidity sensors are the most vulnerable component of the telemetry network. Budget hygrometers utilize low-cost resistive or unsealed capacitive polymer elements that degrade rapidly when exposed to high relative humidity, volatile organic plant terpenes, and aerosolized sulfur or mineral mists. Professional CEA facilities specify industrial-grade capacitive polymer sensors equipped with protective sintered stainless steel or PTFE filter caps, offering an accuracy rating of plus or minus 1.5 to 2.0 percent RH and featuring onboard temperature compensation.
| Sensor Type | Physical Transducer Technology | Measurement Accuracy | Response Time (τ90) | Primary Agricultural Role |
|---|---|---|---|---|
| Air Temperature | Class A Pt100/Pt1000 RTD or NTC Thermistor | ±0.1 to ±0.2 °C | 10 to 30 seconds (aspirated) | Ambient convective dry-bulb measurement. |
| Relative Humidity | Thin-film Capacitive Polymer with PTFE filter | ±1.5% to ±2.0% RH | 5 to 15 seconds | Atmospheric water vapor calculation; dew point. |
| Leaf Temperature | Thermopile Infrared Radiometer (8-14 μm) | ±0.3 to ±0.5 °C | < 1 second | True foliar surface energy balance; Leaf VPD. |
| Carbon Dioxide | Dual-Beam Non-Dispersive Infrared (NDIR) | ±30 ppm ±3% of reading | 20 to 60 seconds | Photosynthetic enrichment dosing control. |
| Substrate Matrix | Time-Domain Reflectometry (TDR / FDR) | ±2% VWC; ±0.1 mS/cm EC | Instantaneous | Root hydration, dry-back curves, and salt buildup. |
| Light Intensity | Cosine-corrected Silicon Photodiode / Quantum | ±5% PPFD (μmol/m²/s) | < 1 millisecond | Photoperiod verification and light dimming control. |
The sensor selection matrix above outlines the specific technical standards required for commercial-grade telemetry. Dual-beam Non-Dispersive Infrared (NDIR) sensors are mandatory for carbon dioxide measurement. Single-beam NDIR sensors rely on software algorithms (Automatic Baseline Calibration or ABC) that assume the room drops to fresh outdoor air (400 ppm) every 24 hours. In an enriched sealed grow room where CO2 never drops below 800 ppm, ABC logic causes the sensor to drift catastrophically high, resulting in severe under-dosing. Dual-beam NDIR sensors utilize a secondary reference optical channel that prevents calibration drift without requiring outdoor air baselines.
Data logging architecture must provide high-frequency sampling and redundant storage. Environmental controllers must sample sensor inputs every one to five seconds, logging rolling 1-minute and 5-minute averages to local non-volatile flash memory and transmitting data to an encrypted cloud time-series database (such as InfluxDB or AWS IoT Core). High-resolution logging allows cultivators to analyze fast thermodynamic transients (such as the sudden humidity spike at lights-out) that are completely invisible on hourly summary graphs.
Industrial communication bus protocols form the operational backbone of commercial data logging. While consumer wireless protocols (such as Wi-Fi, Bluetooth, or Zigbee) are susceptible to radio frequency (RF) attenuation through metal reflective tent fabrics and dense water-laden foliage, hardwired industrial buses (specifically RS-485 Modbus RTU or BACnet MS/TP) deliver rock-solid transmission over hundreds of feet. In multi-room facilities, deploying Ethernet-based Modbus TCP or MQTT (Message Queuing Telemetry Transport) publish-subscribe brokers enables edge controllers to transmit millions of data points with microsecond timestamps, allowing advanced machine learning algorithms to detect subtle mechanical degradation (such as failing compressor valves or slipping fan belts) weeks before catastrophic component failure occurs.
Electrical Infrastructure, Low-Voltage Cabling, and Life Safety
Installing complex electronic telemetry arrays inside wet agricultural environments introduces serious electrical safety considerations. Sensors operate at low direct-current voltages (typically 5V, 12V, or 24V DC), but their power supplies and control interfaces connect directly to main building electrical panels.
Power supplies feeding sensor networks and aspirated shield fans must be Class 2 limited-power circuits, protected by dedicated primary fuses or circuit breakers. Connecting sensor arrays to un-fused secondary DC supplies creates severe fire hazards: an internal short circuit in a sensor probe or an insect bridging a circuit board can melt wiring insulation and ignite surrounding plastic housings or drywall framing. Utilizing UL-listed, regulated DC power supplies with integrated short-circuit and over-voltage protection is mandatory.
Life Safety Rule: Low-Voltage Junction Elevation and Drip Loops
All sensor signal junction boxes, analog-to-digital converter modules, and communication bus repeaters must be mounted at a minimum height of 48 inches above the finished floor. In addition, every low-voltage cable entering a sensor housing or junction box must incorporate a downward drip loop. A drip loop is a simple downward U-shaped dip in the cable directly before the entry gland: any condensation or moisture droplets running down the wire will drip harmlessly off the bottom of the loop rather than entering the delicate electronic enclosure.
Enclosure sealing must comply with strict industrial ingress protection ratings. Sensor junction boxes and aspirated shield electronic compartments must meet NEMA 4X or IP66 standards, ensuring complete protection against airborne agricultural dust, corrosive foliar nutrient sprays, and high-pressure water washdowns between cropping cycles. Cable entry ports must be sealed with threaded liquid-tight cord grips (strain relief glands) fitted with elastomeric rubber grommets.
Furthermore, life-safety sensors must be decoupled from standard crop-optimization controllers. Dedicated, hardwired carbon dioxide safety alarms and combustible gas monitors (for facilities utilizing CO2 burners) must be equipped with their own internal backup batteries and mechanical relay outputs connected directly to emergency exhaust blowers and audible sirens. If the main agricultural PLC crashes or loses power, the life-safety system continues monitoring the space independently, protecting human workers from fatal asphyxiation.
Central environmental automation dashboard displaying real-time VPD, temperature stratification, and historical dry-back logging curves across multiple zones.
Transient voltage surge suppression (TVSS) is another vital safety layer. In indoor facilities operating multi-kilowatt LED drivers and inductive compressor motors, inductive switching events generate violent voltage spikes (surges) on electrical lines. Installing surge protection devices (SPDs) on both AC electrical panels and low-voltage communication buses protects delicate microprocessor boards and analog sensor inputs from high-voltage degradation.
Empty-Room Commissioning and Multi-Point Telemetry Verification
Before relying on sensor data to automate an active cultivation room, cultivators must execute a comprehensive commissioning protocol to verify transducer accuracy, signal continuity, and communication bus reliability under artificial load.
Begin by conducting a static calibration audit (the “bucket test”). Gather all ambient temperature, humidity, and CO2 sensor probes in the center of the empty room, placing them side by side inside an aspirated shroud. Run circulation fans to homogenize the air and allow readings to stabilize for two hours. Record the output of every sensor: temperature readings must agree within plus or minus 0.3 degrees Celsius, and relative humidity readings must agree within plus or minus 2.0 percent RH. Any sensor deviating outside this tolerance band must be re-calibrated or replaced before deployment.
- Static Sensor Agreement Audit: Confirm all co-located sensors agree within ±0.3 °C and ±2% RH in still air.
- Aspirated Shield Velocity Check: Verify internal 12V fan delivers continuous 2.0 to 3.0 m/s velocity across probes.
- Saturated Salt Calibration Check: Test capacitive humidity probes against 75% NaCl certified reference salt slurry.
- Dual-Beam NDIR Outdoor Baseline: Confirm CO2 sensors read 415 to 425 ppm when exposed to pure outdoor air.
- Signal Cable EMI Noise Scan: Check analog sensor signals on oscilloscope or controller graph for inductive noise spikes.
- High-Rate Data Logging Verification: Confirm telemetry database logs continuous 1-minute time-series records without packet drops.
- Automated Emergency Alert Test: Manually trigger simulated high-temperature reading to verify SMS and email alert delivery.
Executing this commissioning checklist eliminates false-positive sensor readings and validates automation responsiveness. A vital commissioning step is testing the emergency notification pipeline. Artificially simulate an out-of-spec environmental event: disconnect a temperature sensor to simulate a probe failure (open circuit) or expose the sensor to warm air to breach the high-temperature threshold (31 degrees Celsius). Verify that the central automation computer detects the anomaly instantly, activates failsafe protocols (such as dimming lights), and transmits high-priority smartphone notifications to facility managers within 60 seconds.
Next, perform an empty-room dynamic stress run. Power on all lighting arrays at 100 percent intensity and operate HVACD equipment through a full 12-hour lights-on and 12-hour lights-off cycle. Analyze the historical time-series data log: verify that spatial temperature variance across different room quadrants remains below 1.5 degrees Celsius, and confirm that the automated controller transitions smoothly across the lights-off photoperiod boundary without hunting or erratic compressor short-cycling.
Failure Modes: Telemetry Blackouts, Drift Cascades, and Failsafe Automation
Electronic sensor systems are susceptible to hardware failures, wiring degradation, and environmental contamination. In unattended cultivation facilities, an undetected sensor failure can result in catastrophic crop loss within hours.
The most common electronic failure is transducer signal drift. Capacitive relative humidity sensors exposed to volatile plant terpenes (such as myrcene, caryophyllene, and pinene) steadily absorb organic compounds into their polymer dielectric. This organic contamination causes the sensor to drift high over several months of continuous operation, reading 65 percent RH when actual ambient humidity is only 52 percent. An automated climate controller relying on this drifted sensor will run commercial dehumidifiers continuously, driving actual Leaf VPD into severe stress territory without the cultivator realizing it.
Diagnostic Warning: Communication Bus Lockup and Stale Data Freezing
In digital communication networks (such as RS-485 Modbus or 1-Wire sensor buses), a single shorted wire, loose terminal screw, or line transceiver failure can freeze the communication loop. When a bus locks up, the central environmental controller may continue displaying the last valid reading it received (stale data). If the controller believes the room is sitting at 24 degrees Celsius when temperatures are actively surging to 38 degrees Celsius, it will never trigger cooling. Controllers must be configured with active heartbeat polling and stale-data watchdog timers that trigger audible alarms if sensor telemetry fails to update for more than 30 consecutive seconds.
To guard against single-sensor failures, commercial facilities deploy multi-sensor voting logic. Rather than allowing a single transducer to command cooling or dehumidification, the PLC software evaluates three redundant sensors per zone using median filtering or outlier rejection algorithms. If Sensor A reads 25 degrees, Sensor B reads 25.2 degrees, and Sensor C suddenly reads 42 degrees (due to a failed thermistor), the algorithm automatically flags Sensor C as defective, discards its data, triggers a maintenance alarm, and continues operating the room smoothly based on the average of Sensors A and B.
In addition, hardwired failsafe cutoffs must protect crops against total controller brain lockups. Mechanical line-voltage capillary thermostats wired in series with lighting contactors provide absolute hardware backup. If the digital automation computer completely freezes and fails to turn off lights when temperatures exceed 32 degrees Celsius, the mechanical capillary thermostat physically snaps open, cutting electrical power to the lighting arrays independently of software.
Preventative Maintenance Schedule and Transducer Recalibration
Maintaining analytical precision across multiple harvest cycles requires structured, ongoing preventative maintenance. Solid-state sensors operating continuously in warm, humid, dusty agricultural atmospheres must be regularly cleaned and recalibrated.
Establish a monthly sensor hygiene routine between cropping cycles. Disconnect electrical power to aspirated shields and inspect the miniature 12-volt cooling fans. Dust, loose perlite particles, and airborne insect debris can accumulate on fan blades, slowing fan speed and reducing air velocity across the sensor probes. Wipe fan blades clean with a cotton swab moistened with isopropyl alcohol. Inspect the protective sintered metal or PTFE caps on relative humidity probes; if the filter cap shows signs of dust or mineral discoloration, unscrew the cap and clean it in an ultrasonic bath of distilled water, or replace it with a fresh sterile cap.
Maintenance Protocol: Saturated Salt Slurry Recalibration
Every 90 days, execute a two-point calibration check on all capacitive humidity sensors utilizing certified saturated salt reference standards. In an airtight container, a saturated slurry of sodium chloride (NaCl) and distilled water generates an exact relative humidity baseline of 75.3 percent at 25 degrees Celsius, while a magnesium chloride (MgCl2) slurry generates a 32.8 percent baseline. Place sensor probes inside the sealed chamber for two hours until equilibrium is reached: if the transducer deviates by more than plus or minus 2 percent RH, execute digital offset calibration in the controller software.
Quarterly maintenance must also verify infrared radiometer optical cleanliness. The germanium or silicon optical lens of an infrared canopy thermometer is vulnerable to airborne organic terpene coatings and dried water spots from foliar sprays. A dirty lens absorbs infrared radiation, causing the radiometer to underestimate leaf surface temperature. Clean optical lenses gently using a specialized optical microfiber wipe dampened with anhydrous isopropyl alcohol; never use abrasive cloths or chemical glass cleaners that scratch delicate anti-reflective lens coatings.
Substrate moisture sensor recalibration and maintenance must not be neglected. Time-Domain Reflectometry (TDR) and capacitance probes inserted into coco coir or rockwool slabs are subject to fertilizer mineral salt encrustation along their stainless steel sensing rods. Over continuous fertigation cycles, accumulated sulfate and nitrate salts form an electrically conductive crust, skewing volumetric water content readings upward and distorting pore-water EC measurements. Between cropping cycles, withdraw substrate probes, soak the metal prongs in a mild 5 percent citric acid or sulfamic acid descaling solution to dissolve mineral scale, rinse thoroughly with deionized water, and execute air-and-water two-point dielectric validation before reinserting into fresh media.
By treating sensor placement, radiation shielding, and data logging as foundational engineering disciplines rather than casual afterthoughts, indoor cannabis cultivators establish absolute environmental visibility. Transducers deliver pristine, uncorrupted physical telemetry to environmental automation computers, eliminating false-positive controller cycling and optimizing plant transpirational vitality. Cultivators protect high-value crops from microclimatic stress, minimize energy overhead, and achieve consistent, world-class harvest yields crop after crop.
Scientific and Technical References
- ASABE Standards. (2018). Heating, Ventilating and Cooling Greenhouses (ANSI/ASAE EP406.4). American Society of Agricultural and Biological Engineers. Engineering standards for sensor placement, radiation shielding, aspirated psychrometric housings, and environmental telemetry in CEA.
- Tanner, C. B. (1963). Basic instrumentation and measurements for plant environment and micrometeorology. Soils Bulletin, 6, Department of Soil Science, University of Wisconsin. Foundational research on radiation errors in temperature sensors, aspirated thermocouple design, and microclimate measurement.
- Albright, L. D. (1990). Environment Control for Animals and Plants. American Society of Agricultural and Biological Engineers. Comprehensive analysis of agricultural transducers, signal conditioning, electronic noise mitigation, and psychrometric data acquisition.
- Nobel, P. S. (2020). Physicochemical and Environmental Plant Physiology (5th ed.). Academic Press. In-depth analysis of foliar energy balance, leaf temperature measurement via infrared thermometry, and boundary layer transpirational dynamics.
Share this article
A quick overview of the topics covered in this article.
Follow us
Latest articles

November 6, 2026

November 6, 2026

November 6, 2026