
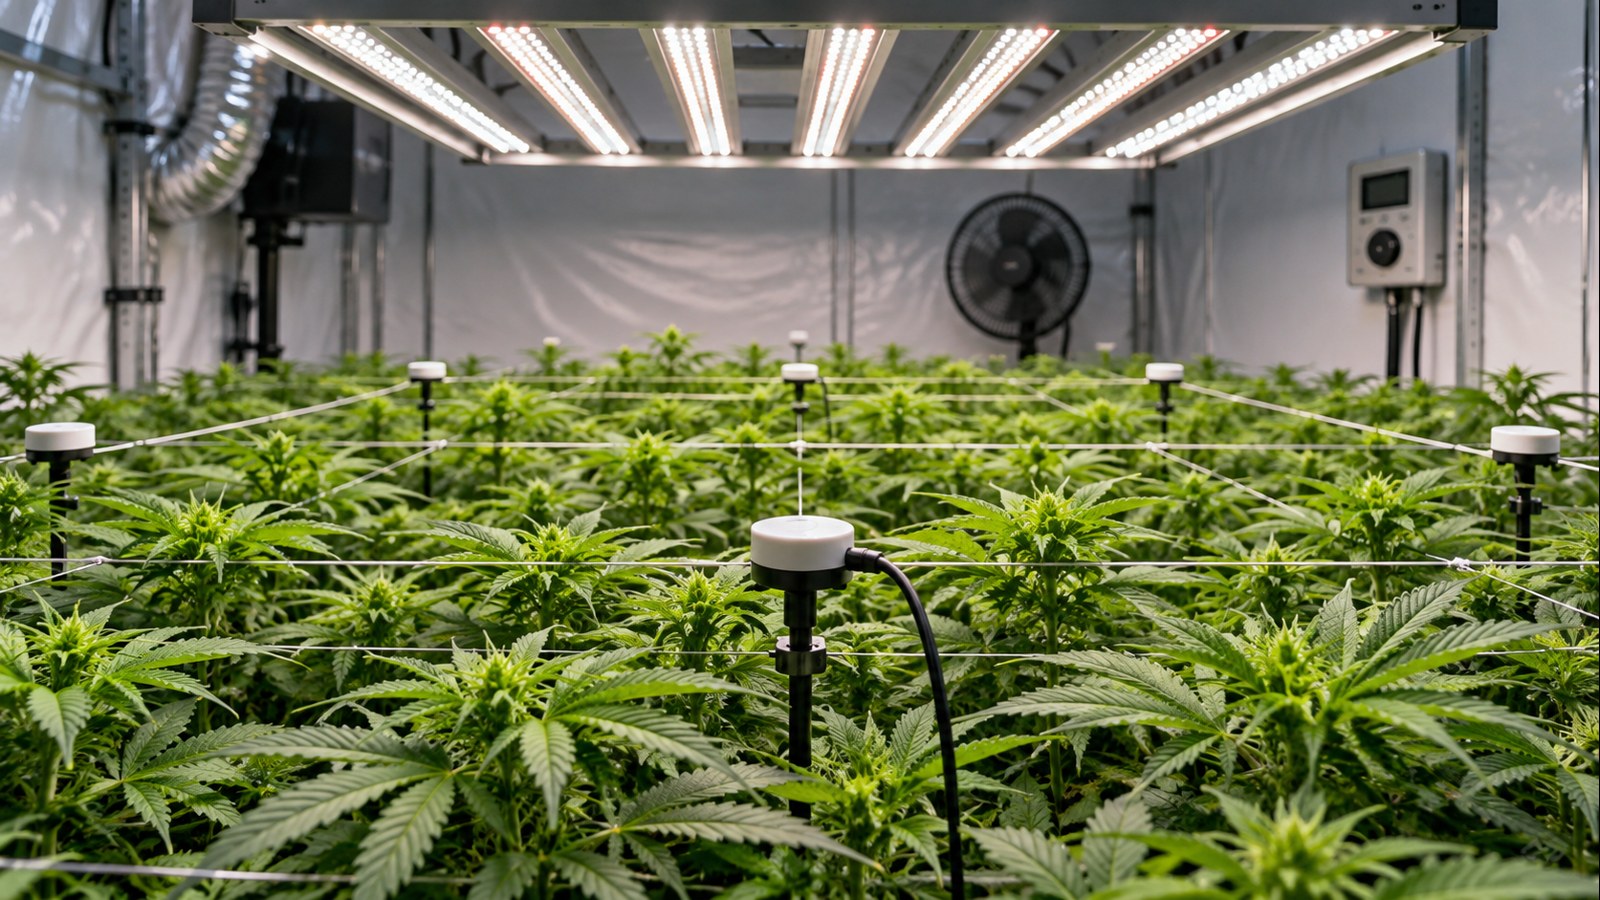
PPFD & DLI Calculator for Cannabis
Enter a measured canopy PPFD and the actual number of light hours to calculate daily light integral (DLI), the photosynthetic photon dose delivered to a square meter in one day. The calculator below also works backward from a chosen DLI to the average PPFD or the operating hours required. A fourth mode adds several consecutive lighting periods, which is useful when an electric fixture has a programmed dimming schedule.
The calculation is exact for the values you enter; the accuracy of the result depends on the measurements. A single center-canopy reading is not automatically a whole-canopy average, and a midday outdoor reading is not a daily sunlight integral. Use this tool to check arithmetic and compare proposed schedules, not to certify that a particular light dose is biologically optimal or safe for every cultivar.
Use the DLI Calculator
Select the question you need to answer, provide measurements in the units shown, and choose Calculate. The input limits catch impossible arithmetic such as a lighting day longer than 24 hours; they are not biological cannabis target recommendations. All result modes distinguish a calculated value from a validated cultivation setting. The tool runs in your browser and does not require an account.
DLI, PPFD, and photoperiod calculator
Uses conventional PPFD in µmol/m²/s (400-700 nm PAR) and reports DLI in mol/m²/day. A row in the variable-light mode describes an average PPFD maintained for its stated number of hours.
Calculated DLI
32.40 mol/m²/day
500.00 × 18.00 × 0.0036 = 32.40
Assumes the measured PPFD represents the selected canopy location throughout the entered hours.
Interpretation: No result is an automatic instruction to increase illumination, change a flowering photoperiod, or operate a fixture beyond its safety rating. The result is a mathematical estimate for the specified inputs.
Which calculation mode should you choose?
DLI from PPFD and hours answers what a known, reasonably stable lighting schedule delivers. It is the default. Required average PPFD works backward from a DLI chosen elsewhere, while operating hours reveals how much time the same photon rate would mathematically need. Neither reverse calculation establishes an appropriate target by itself. Finally, changing light periods lets you sum the contributions of sequential dimming steps or several measured time blocks instead of pretending the entire day runs at a single rate.
If you are starting with a meter reading, use the first mode. If you are checking what dimmer output might be needed after a legitimate schedule change, use the second, then measure again rather than assuming that a percentage on the dimmer maps linearly onto canopy PPFD. If you have a sunrise or greenhouse light logger, the segment mode can approximate the daily integral using time blocks. The coarser the blocks and the faster the light varies, the less certain that estimate becomes.
| Question | Enter | Output | What the result cannot confirm |
|---|---|---|---|
| How much light arrived in this stable schedule? | Representative PPFD and actual hours | DLI | That every plant received the average or can use the dose. |
| What intensity gives my chosen DLI? | Selected DLI and fixed photoperiod | Required average PPFD | That the fixture can deliver it evenly or safely. |
| How many hours would the math require? | Selected DLI and measured PPFD | Hours | That those hours are appropriate for a flowering cultivar. |
| My LED has a programmed ramp. What is its approximate DLI? | Consecutive time blocks and average PPFD per block | Summed DLI | Unmeasured transitions, external daylight, or an incomplete day. |
Try a worked constant-light example
Set the first mode to 500 µmol/m²/s and 18 hours. The result is 32.40 mol/m²/day. Change the hours to 12 without touching PPFD and it becomes 21.60 mol/m²/day. Those are calculation examples, not statements that either schedule is suitable for a particular plant. Now keep 12 hours and select Required average PPFD with a chosen DLI of 30: the result is about 694.44 µmol/m²/s. If a meter subsequently reads 694 at one point, that still does not verify a whole-canopy average.
Switch to the changing-light mode and use 300 PPFD for two hours followed by 650 PPFD for ten hours. Their contributions are 2.16 and 23.40 mol/m², respectively, for a combined 25.56 mol/m²/day. The remaining twelve hours contribute zero only if there is genuinely no other photosynthetically relevant light at the measured plane. If sunlight enters the space or a fixture stays on, document and include that contribution.
Tip: Save the PPFD reading, measurement location, fixture height, dimmer setting, light schedule, and date beside every calculator result. A DLI value without its inputs is difficult to audit later.
What the calculator deliberately does not do
It does not select a cannabis growth stage, produce a universal seedling or flowering target, predict yield, estimate electrical consumption from PPFD, convert lux to PPFD with an unknown spectrum, or infer canopy intensity from the wattage printed on a light. Those are different tasks. A separate stage-specific resource should explain how published cannabis studies, cultivar response, plant age, environment, and grower objectives inform a target. Here, a DLI target is always an explicit user input.
The tool also does not treat 24 hours as a valid cannabis recommendation. The upper bound exists because a calendar day cannot contain more than 24 hours. A result of 23 hours may be arithmetically possible while being inconsistent with a planned dark period. If a calculation conflicts with the crop’s developmental requirements, the correct response is to reconsider the combination of inputs rather than allowing the calculator to choose a photoperiod for you.
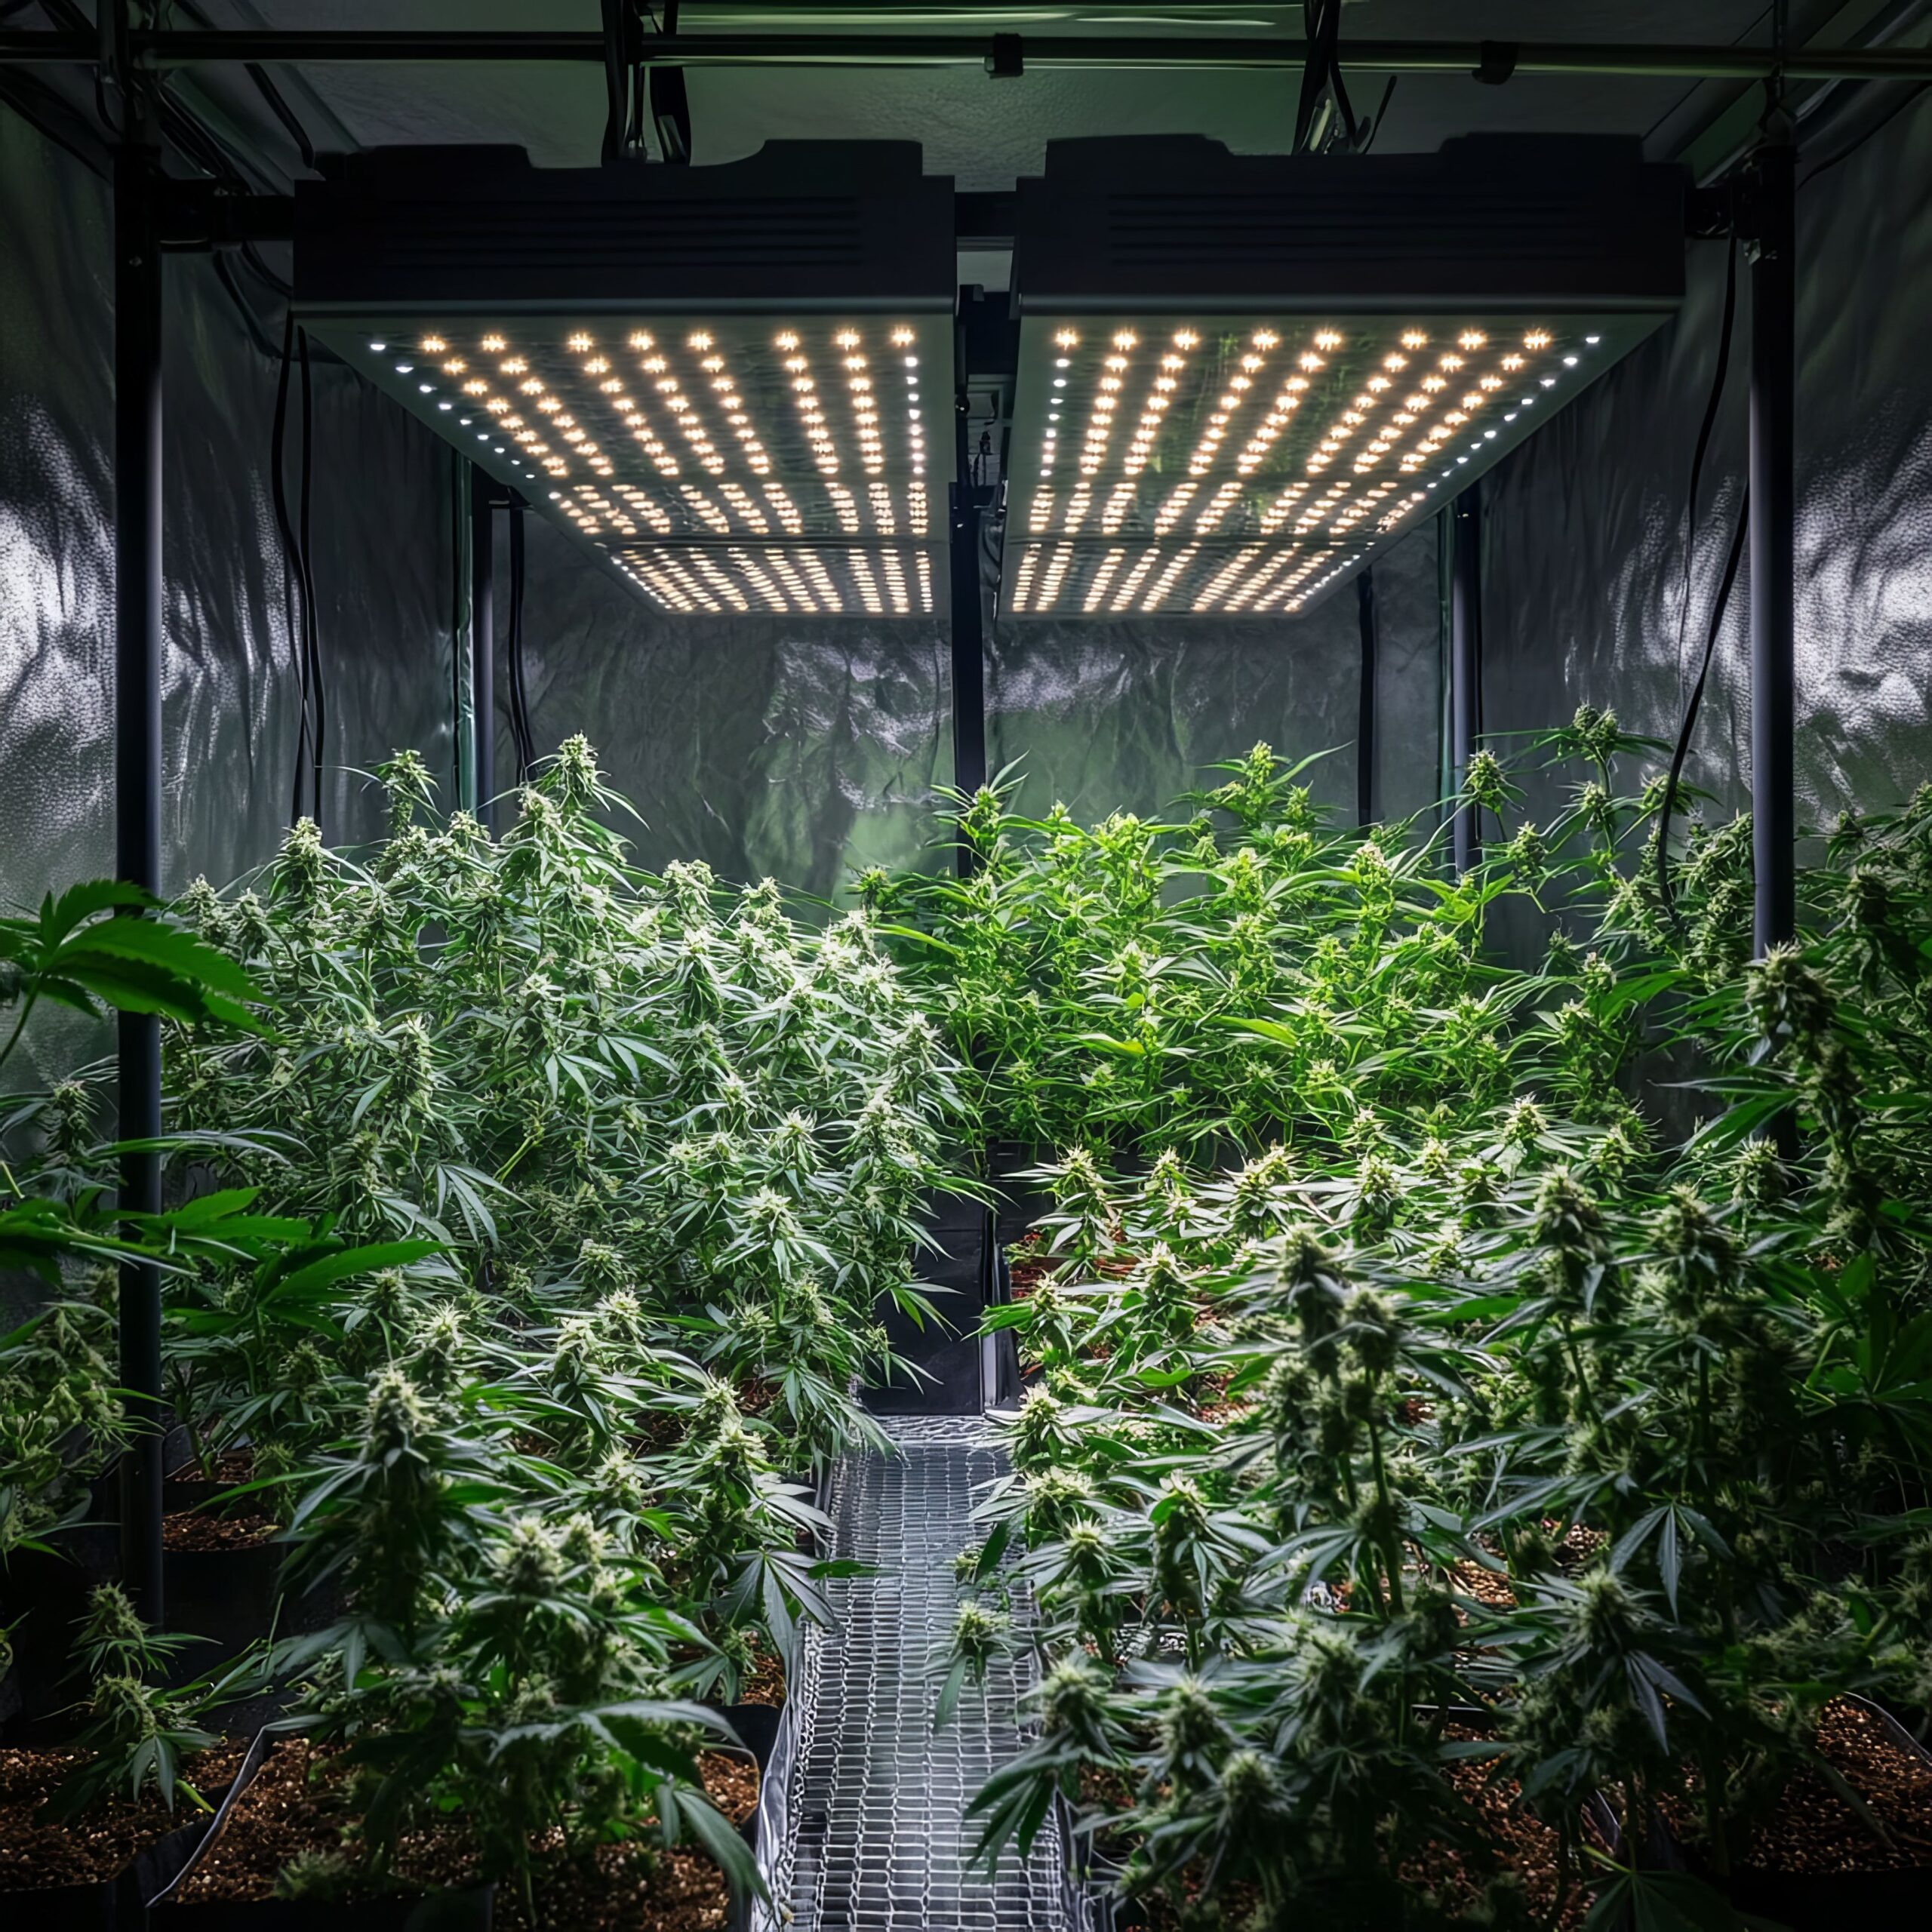
Understand the Formula and Units
A reliable calculator begins with the physical meaning of the two measurements. Photosynthetic photon flux density, or PPFD, describes how many photons within the conventional 400-700 nm photosynthetically active radiation band reach one square meter in one second. It has the units µmol/m²/s. Daily light integral is the total amount of those photons received by that square meter during one complete day, expressed as mol/m²/day. The distinction is a rate versus an accumulated quantity.
Derive the conversion rather than memorizing an unexplained number
One hour contains 3,600 seconds, and one mole contains one million micromoles. Consequently, when PPFD remains constant across the light period, multiply the numerical PPFD by the light hours and by 3,600, then divide by one million. The compact conversion factor is 0.0036. The formula has no cannabis-specific adjustment term.
DLI (mol/m²/day) = PPFD (µmol/m²/s) × light hours/day × 0.0036. The reverse formulas are required PPFD = chosen DLI ÷ (hours × 0.0036) and mathematical hours = chosen DLI ÷ (PPFD × 0.0036). The word mathematical matters: those inverse equations identify a numerical combination, not an independently tested cultivation procedure.
Why 0.0036 is the correct constant
The expression 3,600 seconds/hour divided by 1,000,000 micromoles/mole equals 0.0036. It is simply a unit conversion. It is not a photosynthesis efficiency factor, a cannabis yield coefficient, or an allowance for photons missed by the canopy.
Why a 24-hour average uses a different-looking shortcut
Some extension publications express DLI as 24-hour-average PPFD multiplied by 0.0864. This is mathematically equivalent because 24 × 0.0036 equals 0.0864. The catch is the averaging convention. If your PPFD is the average over the entire 24 hours, including darkness as zero, the full-day factor works. If your PPFD is the average only while the fixture is on, multiply by the actual illuminated hours and use 0.0036 instead. Applying 0.0864 to an illuminated-only reading from a twelve-hour fixture doubles the real DLI.
Suppose a measured fixture produces a stable 600 PPFD for twelve hours and is off for twelve. Its illuminated-period average is 600, its 24-hour average is 300, and its DLI is 25.92 by either legitimate approach: 600 × 12 × 0.0036 or 300 × 0.0864. The misleading result, 51.84, comes from mixing the first type of average with the second conversion factor. Whenever you copy a formula from a datasheet or spreadsheet, identify what time period its PPFD average covers.
A photon-rate measurement is not fixture wattage
A 300 W fixture describes electrical input. Its photon output depends on efficacy, optics, temperature, power settings, and the fixture design. Even if a manufacturer gives total photosynthetic photon flux (PPF), that is expressed in µmol/s and lacks the square-meter area term. Neither watts nor total PPF can be inserted directly in the DLI calculator’s PPFD field. You need a measurement or defensible estimate of incident PPFD at the crop plane, with enough spatial coverage to represent the question you are asking.
Photometric units such as lux and lumens describe light using a human-vision weighting curve. An app may display a PPFD estimate inferred from lux, but the conversion depends heavily on lamp spectrum and calibration. Under a red-rich and a broad-spectrum source, identical lux readings need not mean identical photosynthetic photon flux. Record a spectrum-specific conversion as an estimate, or use a quantum sensor appropriate to the light source when accuracy matters.
Do not silently mix conventional PAR with extended PAR
Conventional horticultural PPFD counts photons from roughly 400 to 700 nm. Some newer instruments also report extended photosynthetic photon flux density over 400-750 nm, often labeled ePPFD, and the corresponding eDLI. A number measured across 400-750 nm should not be dropped into the conventional PPFD field and compared to a 400-700 nm study as if the waveband were identical. The arithmetic can integrate either instrument’s reported photon rate, but the physical quantity and its label must remain consistent throughout the calculation and comparison.
Remember: A calculator cannot repair a unit error. Before entering any value, check whether the display says µmol/m²/s, µmol/s, lux, or a different waveband.
Choose Representative Inputs Before You Calculate
The most consequential calculator decision happens before clicking the button: deciding which PPFD reading describes the area and period of interest. If you only care about one marked canopy point, use that location and label the result as point DLI. If you want a room-average estimate, sample an evenly defined canopy grid and record the spatial mean. If your purpose is to identify uneven lighting, keep the minimum, maximum, and individual locations rather than hiding them behind a single average.
One measurement point versus the entire canopy
Light intensity normally varies below a fixture. Distance from the emitters, reflector design, beam angle, overlapping fixtures, obstructions, and neighboring plants affect what reaches different positions. A high reading directly under the central diode or lamp is a useful hotspot measurement; it is not a substitute for representative canopy sampling. Conversely, a low reading at an unoccupied corner may not describe the active crop area. Define the measurement boundary before taking the readings.
For a rectangular, evenly occupied canopy, create a regular grid at the plane of the crop’s upper growth and include edge and center cells. Take the same number of readings in comparable grid cells, then calculate the arithmetic average. If cells represent different areas, use an area-weighted mean rather than treating a small corner and a large section as equal. Keep sensor height and orientation consistent and document whether you measure at top-of-canopy or another defined plane. As plants grow, repeat the grid at the new canopy height: yesterday’s map does not automatically remain valid after the tops move closer to the lights.
“Can I use the brightest center reading as my PPFD input?”
Question sent by: Ethan Brooks, via email.
Only if you are calculating DLI for that exact point. For a canopy-wide estimate, use a repeatable grid and enter a representative spatial average while retaining the minimum and maximum readings.
What canopy averaging can and cannot reveal
For example, a four-point canopy might have PPFD readings of 350, 450, 550, and 650 under a stable sixteen-hour light period. Their equally weighted mean is 500, so the area-average estimated DLI is 28.8 mol/m²/day. The local DLIs range from 20.16 to 37.44. A report containing only 28.8 conceals that spread. Since DLI is linear in PPFD when duration is shared, averaging the four PPFD values before conversion produces the same average as converting each local measurement and then averaging. It does not mean every leaf receives that average.
Uneven grids also interact with uneven canopies. If the lower edge of the crop is shaded while a high central top is close to a bar LED, no single horizontal plane captures every leaf. Use a consistent top-canopy plane for routine comparisons and record additional readings at problem areas when interpreting local stress. It is not necessary to turn this simple calculator into a three-dimensional light model, but it is necessary to name which locations its input represents.
Choose actual fixture hours, not the timer label alone
If a timer is set for eighteen hours but the light spends the first hour ramping up and the last hour ramping down, a single full-output PPFD multiplied by eighteen overstates the dose. The timer may also experience power interruptions, programmed dark intervals, or controller behavior that differs from its display. Confirm the schedule physically or from reliable logged operation. A conventional timer running a stable-output fixture is a good use case for the first mode; a dimming schedule belongs in the segment mode or, for more precision, a time-series integration outside this simple browser tool.
In the segment mode each row should be a non-overlapping interval with an appropriate mean PPFD for that interval. Two rows that describe the same hour cannot be added as consecutive blocks, because that would double-count time. If two independently measured light sources operate at the same time, either measure their combined canopy PPFD or, under comparable sensor geometry and waveband, sum their simultaneous photon rates and then integrate once over that interval.
Genetics, growth stage, climate, and root health change interpretation
These variables do not alter the mathematical formula. They change how an existing dose should be interpreted. Newly rooted cuttings, established vegetative plants, and mature flowering plants can respond differently to the same PPFD or DLI because their leaf area, acclimation history, water supply, and developmental signals differ. Cultivars do not all respond identically to additional light. Leaf temperature, air movement, humidity, CO₂ availability, and root-zone limitations affect whether extra photons translate into useful growth or additional stress.
In a controlled cannabis study published in 2021, flowering plants were exposed to a broad set of canopy-level PPFD treatments from approximately 120 to 1,800 µmol/m²/s across a twelve-hour photoperiod. The tested DLI span was approximately 5.2 to 78 mol/m²/day. This is experimental evidence about the tested plants and conditions, not a blanket recommendation to run the highest treatment. A separate 2024 comparison of twelve- and thirteen-hour flowering days in two cultivars showed that photoperiod length itself can affect crop response. The calculator therefore never turns a computed result into a cultivar-independent optimal target.
Equal DLI does not mean equal biology
A schedule of 600 PPFD for twelve hours and one of 400 PPFD for eighteen hours each deliver 25.92 mol/m²/day mathematically. Their photon arrival rates and dark periods differ. Do not substitute one flowering schedule for another solely because the calculator displays the same DLI.
Outdoor and greenhouse measurements need time coverage
Outdoor PPFD changes with the sun’s elevation, clouds, shade, nearby structures, and season. A reading taken at noon is not the average over daylight hours. Even a cloudless day does not have constant PPFD. In a greenhouse, incoming sunlight and any supplemental electric photons combine, while the cover, structure, and shade modify the sunlight that reaches crop height. For a true daily total, integrate a sensor’s measurements over the day at the canopy, or use a defensible daylight time series plus known supplemental-light contribution.
If you only have a single morning or noon spot reading, record it as a spot reading and do not label the calculator output as observed outdoor DLI. You may use a clearly described assumed average for scenario planning, but distinguish modeled estimates from measurements. Use the same convention when evaluating a proposed greenhouse retrofit: an outside weather-station DLI cannot be inserted as if it were the inside-canopy DLI without accounting for transmission and local shading.
Field Advice: Record the spatial and temporal basis beside the number: center spot, five-point canopy average, logged full-day mean, or estimated interval average. These descriptions are often more useful than an extra decimal place.
With the measurement limits clear, the next workflow turns those inputs into a reproducible calculation record.
Follow a Repeatable Measurement and Calculation Workflow
You can make a reliable calculation with a small set of measurements if the lighting is stable, but a reproducible process matters more than entering an impressive-looking number. The following method deliberately separates field measurements from arithmetic and biological decisions. Complete the steps in order and document any assumptions instead of quietly replacing missing measurements with guessed values.
Step 1: Define the purpose and the reporting plane
Write down whether you need the DLI of one problem plant, the whole canopy, an existing schedule, or a hypothetical revised schedule. This choice determines how many PPFD readings you need and whether to calculate separate results. Draw a simple top-view sketch of the crop area; mark its dimensions and the fixtures. Set the sensor plane at a consistent canopy height and note any plants unusually close to or far from the lamp. Photograph the setup if the canopy shape is likely to change quickly.
Keep one coordinate system across repeat measurements. If you change from a three-by-three grid to a different layout without noting the change, your reported average may move simply because the sampling method changed. A repeatable grid should include representative edge positions and areas beneath fixture overlap as well as the center. For a single plant, a top reading and several surrounding readings can answer whether the center is misleading, but they should not be described as a full-room survey.
Step 2: Verify the instrument and wait for stable output
Use an appropriate quantum sensor when available. Confirm that it measures the relevant PAR waveband, that calibration guidance is followed, and that the sensor is clean and reasonably level. Spectral error matters when an older sunlight-focused sensor is used beneath a narrow-band or unusual LED spectrum. Check the manufacturer’s specifications rather than assuming every instrument labeled a PAR meter has identical response. Keep your body, hand, and the sensor cable from shading the detection surface.
Allow the fixture to reach stable operation according to its instructions and confirm that the intended dimmer level is active. Avoid making one reading as soon as the switch clicks if the lamp or control program is still changing. Keep neighboring lights in the same state used for the real crop unless you are deliberately measuring an individual fixture. Check that reflective walls, hanging objects, and an open grow-tent door do not change the geometry between measurements.
Step 3: Record the PPFD grid and the timing profile
Measure each marked point at the defined height and write the PPFD beside the coordinate. Repeat a suspicious reading rather than deleting it merely because it is inconvenient. When values vary, inspect whether the cause is a hotspot, genuine edge drop-off, a height difference, a sensor shadow, or changing fixture output. The average is useful, but record the minimum and maximum too. For a fixed-output indoor fixture, document the real daily on-time. For changing-output programs, record the start and finish times or the duration of every meaningful setting.
For a ramp, use a mean PPFD measured or calculated across the segment, not the endpoint value. If the output rises approximately linearly from 200 to 600 PPFD over one hour, 400 would be the exact time average only under that linear assumption; without evidence of linearity, collect several readings or use a logger. In strongly variable sunlight, use frequent time-series data rather than treating a handful of arbitrary samples as exact. The segment calculator offers a practical approximation, not a substitute for high-resolution integration when conditions change rapidly.
Step 4: Select the appropriate mode and enter the units
With stable light, choose DLI from PPFD and hours. Enter the representative canopy PPFD in µmol/m²/s and the actual illuminated duration in hours, allowing decimals for partial hours. The result is in mol/m²/day. A timer set to eighteen hours and thirty minutes is 18.5 hours, not 18.30. Entering 1,080 minutes into a field labeled hours is invalid. Do not copy a reading in lux into the PPFD field or a fixture’s PPF rating into a measurement of PPFD.
For reverse calculation, first write where your chosen DLI came from. If it came from a study, identify its cultivar, growth stage, spectrum, photoperiod, environment, and outcome. Treat the reversed result as a planning number. With a fixed flowering photoperiod, solve for PPFD instead of freely changing hours. Even then, a calculated required average must be checked against the actual measured distribution and the plant’s response.
“My dimmer says 60%. Can I enter 60% of the fixture’s maximum PPFD?”
Question sent by: Julia Schneider, via contact form.
Do not assume a perfectly linear relationship. Set the fixture, allow it to stabilize, and measure the canopy again. Use the measured PPFD distribution rather than converting the controller percentage directly.
Step 5: Audit the result manually
Multiply the PPFD by 0.0036 to determine the photon contribution for one hour. Then multiply that value by the number of hours. For example, 650 PPFD contributes 2.34 mol/m² each hour and supplies 28.08 over twelve hours. If the calculator reports an unrelated value, recheck the fields, units, and whether you used twelve or eighteen hours. For a reverse mode, put the output back into the original formula. If 30 DLI and twelve hours produce about 694.44 required PPFD, then 694.44 × 12 × 0.0036 should return approximately 30.
A separate sanity check is proportionality. At constant duration, twice the PPFD gives twice the DLI. At constant PPFD, half the hours gives half the DLI. If a result appears to break either relationship, the problem is likely in the input interpretation, spreadsheet reference, or unit conversion. These checks are especially useful when moving numbers between a manufacturer’s map, a note-taking app, and a browser calculator.
Step 6: Interpret the result with the rest of the plant data
Do not use DLI as a standalone diagnosis of pale leaves, slow growth, curling, or bleaching. Compare the result with local minimum and maximum PPFD, the actual fixture-to-canopy distance, recent changes, temperature and humidity, root-zone condition, and canopy uniformity. Some symptoms overlap across heat, water imbalance, pests, nutrients, and lighting. A mathematically high DLI can coexist with insufficient photons at shaded edges, while a moderate canopy average can conceal a local hotspot.
Likewise, if the result differs from a stage guide’s suggested starting range, that difference is a prompt to investigate, not a command to chase the range immediately. Ask whether the stage, cultivar, room conditions, and units match those behind the reference. A low DLI combined with healthy compact growth may still warrant a different decision from the same reading in visibly stretched plants under otherwise adequate conditions.
Step 7: Change one parameter and verify again
If a change is justified, choose one controlled adjustment such as fixture intensity or hanging height within the manufacturer’s safe installation limits. Keep photoperiod appropriate to the plant’s developmental program. Document the date and the old and new settings, and map the canopy again once the fixture output is stable. Measure the changed PPFD rather than converting dimmer percentages directly into photons. Inspect the plants over a suitable observation window without attributing every visible response to the most recent light adjustment.
Pro Tip: Before and after a change, keep the same grid, sensor, orientation, photoperiod notation, and representative height. Changing several measurement conventions at once makes it difficult to identify whether DLI really changed.
Keep a calculation record that can be audited
| Field | Example entry (illustrative) | Why it matters |
|---|---|---|
| Date and identifier | Day 1, tent A | Matches readings to a specific baseline. |
| Growth stage and schedule | Vegetative, 18 h | Preserves photoperiod context without implying a target. |
| Fixture position | 52 cm above defined plane | Explains why an old map may no longer apply. |
| Dimmer setting | 60% indicated | Describes the controller, not measured photons. |
| Grid values | 420 / 480 / 500 / 600 PPFD | Retains distribution instead of only a mean. |
| Representative mean | 500 PPFD | Defines the DLI calculation input. |
| Computed DLI | 32.40 mol/m²/day | Provides the comparable arithmetic result. |
| Follow-up | Re-map after canopy growth | Turns a calculation into a repeatable check. |
Troubleshoot Misleading Calculator Results
Most DLI calculator errors are not failures of multiplication. They arise when the input represents a different quantity from the one the formula requires. The best correction is to identify the type of error before touching a dimmer, extending a timer, or changing equipment. The following problems are organized by their diagnostic signature so you can trace a suspicious result back to its cause.
A result that is twice as large or small as expected
Check whether you used the actual light period or a full twenty-four-hour conversion factor. For a twelve-hour fixture with 600 PPFD, the legitimate DLI is 25.92. A result of 51.84 often means someone treated the illuminated-period PPFD as a full-day average and multiplied by 0.0864. A result near 12.96 may reflect incorrectly halving the hours, or treating a twelve-hour period as six. Recalculate using 600 × 12 × 0.0036 and inspect the source of every numerical input.
Minutes, hours, decimals, and rounding
Enter eighteen hours and thirty minutes as 18.5 hours. The decimal 18.30 is eighteen hours plus 0.30 of an hour, which is eighteen hours and eighteen minutes, not thirty minutes. If you start with elapsed minutes, divide by sixty before entering the value. Avoid rounding PPFD to the nearest hundred before calculating when you are trying to compare small changes. At the same time, a displayed result with two decimal places should not be mistaken for measurement accuracy to 0.01 mol/m²/day if the sensor itself is less precise.
Wattage, lux, PPF, and DLI mixed in the same field
A grow light labeled 400 W does not provide a PPFD input of 400. A datasheet listing 1,000 µmol/s reports PPF, not PPFD. A phone displaying 30,000 lux reports a human-vision weighted value rather than quantum photon density. The calculator intentionally labels the field in µmol/m²/s; if the source unit differs, stop and obtain a compatible measurement or carefully qualified conversion before proceeding. Guessing silently produces plausible-looking but meaningless results.
A center reading produces an impressive but misleading average
Re-map the active canopy and calculate the mean of representative grid points. If the crop receives 800 at the center but 350 at an edge, do not enter 800 for a whole-canopy DLI just because it is the highest number. Record local results separately if your aim is hotspot assessment. Consider a second grid after fixture height adjustment or canopy training, but do not use a calculator output alone to justify a physical rearrangement without checking access, electrical safety, plant clearance, and environment.
A manufacturer PPFD map does not match your room
A fixture map may be produced at a particular hanging height, dimming setting, coverage area, wall reflectance, and measurement plane. Your setup may differ in every one of those conditions. It is useful as an initial expectation but not a verified canopy map. Compare the test conditions printed with the map and measure your actual installation. If the chart lacks sufficient information, treat its values as preliminary. An advertised average PPFD may also conceal a different edge value than your own canopy experiences.
Variable output was treated as constant
For sunrise, cloud cover, dimming ramps, intermittent supplemental lighting, or greenhouse curtains, a simple PPFD-times-hours computation is only valid if the PPFD input is an accurate time-average for that interval. Divide the day into meaningful consecutive blocks and sum each contribution, or use logged readings. If a cloud passes across the sun repeatedly, a few large time blocks may still miss substantial variation. A high-resolution logger provides a more defensible daily integral. Report whether you used measured interval averages, interpolation, or an explicit estimate.
Double-counting sunlight and LEDs
When sunlight and electric lighting overlap, separate the contributions carefully. A quantum sensor measuring total canopy PPFD while LEDs are on already includes both sources. Adding a second full LED DLI on top of that integrated total counts the LED photons twice. Either log the total combined PPFD once or calculate independently measured solar and electric contributions in non-overlapping accounting terms and sum them. If you do not know the solar contribution, disclose that total DLI is unknown rather than silently treating it as zero.
Positive DLI target, zero PPFD, and impossible operating hours
At zero PPFD no positive target DLI can be delivered, regardless of finite operating time; this is why the tool rejects that inverse calculation. If a target requires more than 24 hours at the entered intensity, the tool reports that the mathematical operating time exceeds one day. Do not treat the number as advice to run a lamp indefinitely. Review whether the chosen DLI has suitable evidence, confirm the measured intensity, and evaluate fixture capability and a biologically appropriate schedule separately.
An apparently acceptable DLI accompanies light stress
DLI averages photons through time, not temperature, photon distribution, spectrum, or plant stress physiology. A hot central top can be exposed to an excessive local PPFD while the room-average daily dose seems reasonable. Leaf damage may also be linked to nutrient issues, humidity, root stress, or thermal radiation. Take local readings and record leaf and air temperature, position, and the sequence of recent changes. If injury is progressing, prioritize reducing the exposure to the affected plants and investigate safely; do not rely on the calculator to distinguish the cause.
Verify the inputs before changing the installation
Check units, timer hours, sensor source, sampling position, and overlapping light periods first.
Do not chase a number blindly
Do not increase PPFD merely to make a target turn green, borrow a noon outdoor reading as the daily mean, or extend a flowering schedule because a reverse formula produces a convenient number.
Quick diagnostic table
| What looks wrong | First check | Next action |
|---|---|---|
| DLI about twice the expected result | Illuminated-only PPFD multiplied by a 24-hour factor? | Use actual lit hours with 0.0036. |
| Reverse PPFD looks unrealistically high | Target DLI, available hours, and units | Reconsider the chosen target and check equipment limits. |
| One plant differs from the room average | Local PPFD, canopy height, and shading | Record local DLI rather than reusing the spatial mean. |
| Greenhouse reading changes by the hour | Daylight and LED contribution over time | Use a logger or time-weighted intervals. |
| App and quantum meter disagree | Spectral calibration, angle, and conversion settings | Validate against a suitable instrument; flag app value as estimate. |
| DLI matches target but tops show stress | Local hotspot, temperature, water status | Investigate environment and plant response rather than treating DLI as proof of safety. |
Verify the Calculation Against the Actual Canopy
Verification has two levels. The arithmetic must reproduce the equation, and the underlying PPFD must describe the light that reaches the crop over the specified time. A calculator can pass the first level perfectly and fail the second because the input was a mislabeled unit, a single hotspot, an outdated fixture chart, or an outdoor spot reading. Keep both checks visible in the grow record.
Perform a numerical cross-check
Re-enter the same values in the inverse mode. If stable 500 PPFD across eighteen hours produces 32.40 DLI, then a target of 32.40 with eighteen hours should return 500 PPFD. The same target with 500 PPFD should return eighteen hours. Small discrepancies may result from rounding the displayed output; they should not create large changes. For sequential periods, calculate each contribution on paper and add them before comparing with the tool. These cross-checks detect transcription errors or a broken equation but cannot detect a sensor placed at the wrong height.
Check the measured exposure independently
At the same fixture power and after stable operation, repeat the original grid with the same sensor orientation and sample locations. Check whether the measured center, edges, and representative mean resemble the baseline. If an independent logger is available, compare its complete-day DLI with the calculated result for a sufficiently stable day. Expect legitimate differences when the fixture output drifts with temperature, the canopy moves, sunlight enters, or the meter’s calibration differs. Investigate the discrepancy rather than altering the input solely to make the numbers agree.
Under variable daylight, independent integration of logged readings is the meaningful check. Suppose a logging interval is fifteen minutes. Each sample contributes PPFD × 900 ÷ 1,000,000 mol/m² if that sample fairly represents its interval. Sum all intervals across the chosen 24-hour day. If the PPFD record contains missing periods, identify and document how they were handled; interpolating across a brief gap is an estimate, and extrapolating a cloudy hour from one noon observation is a much larger assumption.
Track measurement uncertainty without fake precision
A sensor’s specified calibration uncertainty, spectral response, orientation error, and long-term drift affect the measured PPFD. The spatial grid introduces uncertainty about unmeasured canopy positions. The timing schedule may add uncertainty when a ramp, power interruption, or daylight contribution is poorly logged. The calculator’s multiplication adds comparatively little error to these factors. Treat a result such as 31.27 mol/m²/day as arithmetic precision, not proof that the canopy received exactly that value in practice.
When the measurement uncertainty is not known, report the method instead of inventing an accuracy percentage. If the meter has a manufacturer specification for your light source, record it along with calibration date and operating conditions. Avoid claiming that a sensor rated within a certain uncertainty is automatically that accurate under every spectrum, angle, and field condition. A basic repeat measurement with a consistent layout can reveal unstable readings even before a more formal instrument audit.
“If two schedules have the same DLI, are they interchangeable?”
Question sent by: MapleGrower, via Facebook page.
No. Equal DLI can come from different PPFD levels and photoperiods, which changes instantaneous intensity and the dark period. Keep the biologically appropriate schedule and use DLI as one comparison metric, not the sole decision rule.
Compare before and after without mixing spatial and temporal averages
If you want to know how much your lighting adjustment changed canopy-average DLI, compute comparable area means at both settings under the same schedule and grid. Do not compare the initial center point with the later nine-point average and call the difference a fixture gain. If you change both the photoperiod and the fixture intensity, record them separately, compute the old and new doses, and keep the altered developmental context visible. DLI provides a useful common unit, but it does not isolate which change caused a later response in the plant.
At the next observation, look for stable or changing growth, local bleaching or shade effects, leaf temperature, water demand, and any other indicators appropriate to the stage. A single follow-up photograph will not prove that a DLI adjustment caused a yield difference. If the question is causality, comparable plants, controlled changes, adequate replication, and consistent harvest measurements are required. For everyday cultivation, simply document the adjustment and verify the measured light before drawing more modest conclusions from subsequent growth.
Master Advice: The best DLI number is one you can reproduce. Keep the original sensor grid and time assumptions with every calculation, then verify the light environment after the physical setup changes.
Final Checklist, FAQs, and Related Reading
The calculator is most useful as a short loop: choose the question, obtain appropriate measurements, calculate, inspect the limits, and verify the light actually reaching the canopy. A fixed indoor fixture is the simplest case. A mixed-light greenhouse or outdoor garden needs more temporal information. In every case, the calculation supports a lighting decision but cannot replace evidence about photoperiod, plant response, environment, or electrical safety.
Before you rely on the result
- Confirm the input is PPFD in µmol/m²/s, not watts, PPF, lux, or ePPFD mislabeled as conventional PPFD.
- Choose whether the result describes one location, a sampled canopy mean, or an explicitly modeled scenario.
- Use the true operating hours and retain the appropriate dark period for the crop’s developmental program.
- Use time blocks or full-day logging if intensity changes during the day; never substitute a midday outdoor spot reading.
- Check for double-counting when daylight and supplemental lighting overlap.
- Inspect local minimum and maximum readings instead of using average DLI as proof of uniformity.
- Audit the units and verify at least one example with the original or inverse equation.
- Record the date, fixture settings, canopy height, sensor and grid, photoperiod, result, and any assumptions.
- Make only a justified and safe change, then re-measure the same grid and observe the plants.
Can I calculate DLI from watts alone?
No. Watts describe electrical power, not incident photon density. Even high photon efficacy does not tell you how photons are distributed over the crop area without fixture geometry and light losses. Obtain a canopy-level PPFD measurement or a clearly qualified, matching manufacturer map. For fixture buying decisions, consult the separate grow-light guide rather than using this calculator to infer photons from marketing wattage.
Can a phone app provide a PPFD value for this tool?
Some apps estimate PPFD using a phone light sensor and a lamp-specific conversion. Such estimates depend on the device, calibration, spectrum, orientation, and software method. If you cannot validate your app against a suitable quantum sensor, label the reading as an estimate and avoid presenting the resulting DLI as measured precision. A phone can still be useful for rough comparisons under a constant lamp if its limitations are made explicit.
Should I use average PPFD, the minimum, or the maximum?
Use the representative spatial average when the question is canopy-average DLI and the grid samples the active area fairly. Calculate individual local DLIs from the minimum and maximum or the underlying grid readings if you want to assess hotspots or shaded edges. Do not report one number as if it described both the whole canopy and every individual plant.
Do I need to add DLI from the sun and a grow light?
Yes, if the contributions are measured separately and are not already part of the same integrated total. Photons from the two sources accumulate across the day. However, if a sensor measures the combined PPFD at canopy level with the LED operating, that measurement already contains both contributions. Add only components that have not already been counted, and account for greenhouse coverings or shade by measuring at the crop rather than assuming outside sunlight enters unchanged.
What should I do if required PPFD is above my fixture’s capability?
First verify the chosen target, correct units, actual hours, and the fixture’s published operating limits. A calculated requirement does not justify unsafe modification, bypassing thermal protection, moving a lamp closer than approved, or disturbing the plant’s necessary night. It may mean that the chosen target is not feasible for the current system; any redesign belongs to a separate equipment and environment assessment.
Does the same DLI guarantee the same yield?
No. DLI counts incident photons, while yield depends on cultivar, stage, plant architecture, temperature, CO₂, water availability, crop management, spectrum, and time. Experiments on cannabis demonstrate responses to both instantaneous intensity and photoperiod; those findings are not interchangeable with a simple universal yield-per-DLI coefficient. Use the calculator to compare photon dose, not to predict grams of flower.
How often should I recalculate?
Calculate a new baseline when you change the actual light schedule, dimmer setting, fixture position, number of fixtures, or the canopy’s height and shape enough to affect incident light. Recheck after equipment service and when plant response suggests a local hotspot or shaded area. In outdoor or greenhouse settings, seasonal daylight variation means that yesterday’s integrated DLI may not describe today’s conditions; use current logging when accurate daily totals matter.
Educational content. Follow your local laws and all lighting equipment safety instructions.
Share this article
A quick overview of the topics covered in this article.
Follow us
Latest articles
November 10, 2026
November 10, 2026
November 10, 2026
November 10, 2026