Cannabis Grow Light Coverage and Power by Canopy Size
A grow light is not correctly sized because its box says “2 x 4 coverage” or because its wattage looks appropriate for the tent. Coverage is a relationship between the usable canopy area, fixture photon output, PPFD distribution, hanging height, photoperiod, and the environment that lets the plant use that light.
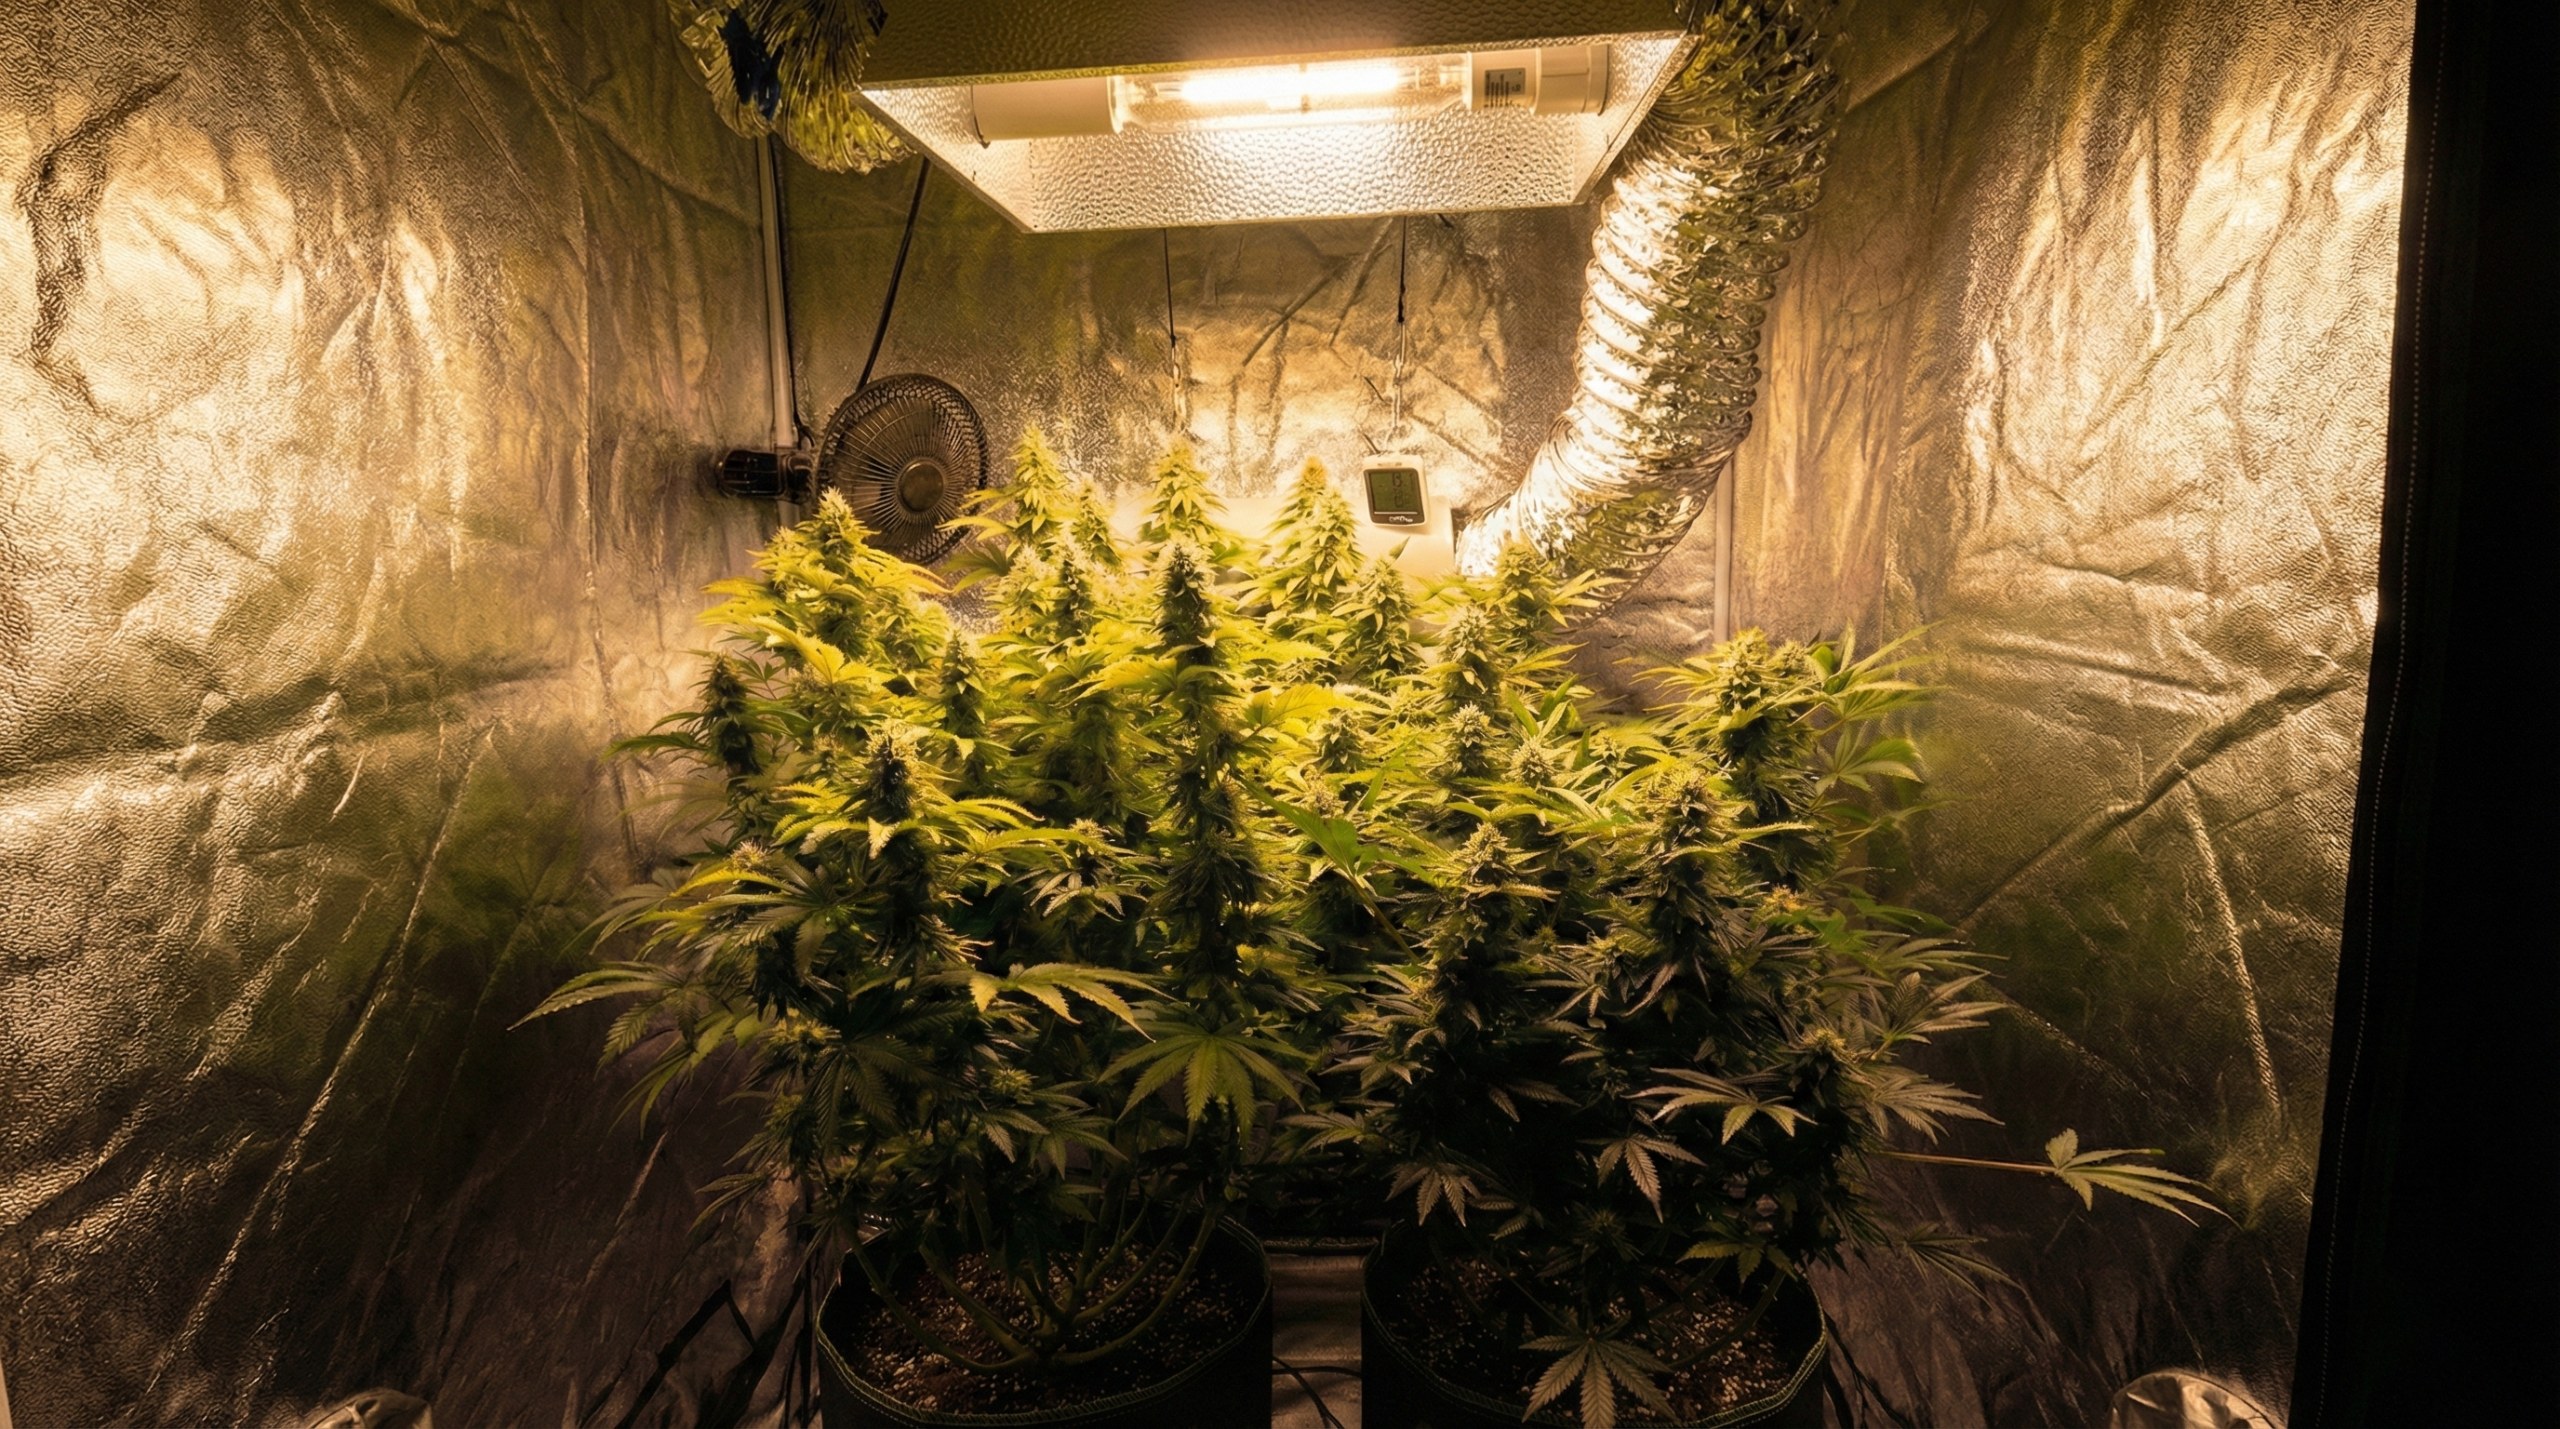
The most reliable way to size lighting is to begin with the productive canopy rather than the fixture. Measure the area you actually intend to fill with leaves and flowering tops. Then define the light level you want to evaluate, translate that area into a canopy-plane photon requirement, compare fixtures by PPF and PPFD maps, and verify the installed result with measurements across the canopy.
This resource is focused on canopy sizing and coverage. For broader explanations of lighting biology, PPF, PPFD, DLI, spectrum, and fixture placement, use the complete cannabis grow-light guide. If you are still planning the room itself, the grow-room setup guide is the better place to start.
Measure the Usable Canopy Before You Size the Light
The floor area of a tent or room is not automatically the area that needs full-intensity light. A productive canopy is the horizontal surface occupied by the plant tops you actually intend to illuminate. Fans, access space, irrigation hardware, wall clearance, support frames, dehumidifiers, and uneven plant development can all reduce that area.
This distinction matters because fixture sizing becomes much clearer once the canopy is treated as a measured surface. A nominal 4 x 4 ft enclosure can contain a smaller productive canopy, while an open room may contain several separate canopy zones that should not be treated as one rectangle.

How to Measure Usable Indoor Canopy Space
Measure the length and width of the area that will actually carry productive foliage. If the canopy is rectangular, multiply length by width. If the canopy is irregular, divide it into smaller rectangles, calculate each area, and add them together. Record the dimensions in both feet and meters if you expect to work with horticultural light data, because PPFD and PPF calculations use square meters.
For example, a nominal 4 x 4 ft canopy has an area of 16 ft², which is about 1.49 m². A 2 x 4 ft canopy has the same length but half the area, about 0.74 m². That area difference is why one fixture cannot be judged by wattage alone. The same photon output spread across twice the area produces a lower average photon density if the distribution is otherwise similar.
Field Advice: Measure the productive leaf surface you expect to maintain, not the outside dimensions printed on the tent. Lighting a walkway, empty corner, humidifier, or wall does not improve canopy performance.
Use the final canopy shape, not only the plant footprint on day one
Young plants rarely occupy the area they will fill later. If you size the light only around the early vegetative footprint, the canopy can outgrow the useful PPFD zone. If you size only for the maximum theoretical floor area, you may buy more fixture than the room can use efficiently.
Estimate the finished productive footprint. Training style, container spacing, cultivar architecture, vegetative duration, plant count, aisle access, and the number of fixtures all influence that footprint. The goal is not to predict every branch. It is to define the horizontal area that the lighting system must cover evenly enough for your chosen production plan.
Usable Canopy Area
Usable canopy area is the horizontal area occupied by productive foliage that you intend to illuminate and manage as one lighting zone. It is more useful for fixture sizing than total room or tent floor area because it excludes space that is not part of the crop surface.
Canopy area is not the same as leaf area
A dense cannabis canopy contains far more total leaf surface than its floor footprint because leaves overlap and exist at multiple heights. Grow-light coverage calculations normally use the horizontal canopy projection, not the sum of every leaf surface. PPFD is measured on a plane or at selected points across that canopy.
This is one reason lower-canopy performance cannot be predicted from a single top-plane PPFD value. Light interception, leaf angle, branch architecture, pruning, spacing, spectrum, and canopy depth all affect how photons move below the top layer. This article sizes the primary lighting plane. It does not claim that equal top-canopy PPFD guarantees equal light penetration through every plant.
Why Watts Alone Cannot Define Coverage
Wattage is electrical input. Coverage is a photon-delivery problem. The two are related, but they are not interchangeable.
A fixture drawing 300 watts at 2.0 µmol/J produces roughly 600 µmol/s of PPF. A 300-watt fixture at 2.8 µmol/J produces roughly 840 µmol/s. Both add about the same electrical load to the circuit, yet the second creates far more photosynthetic photons. Fixture geometry then determines how those photons are distributed across the canopy.
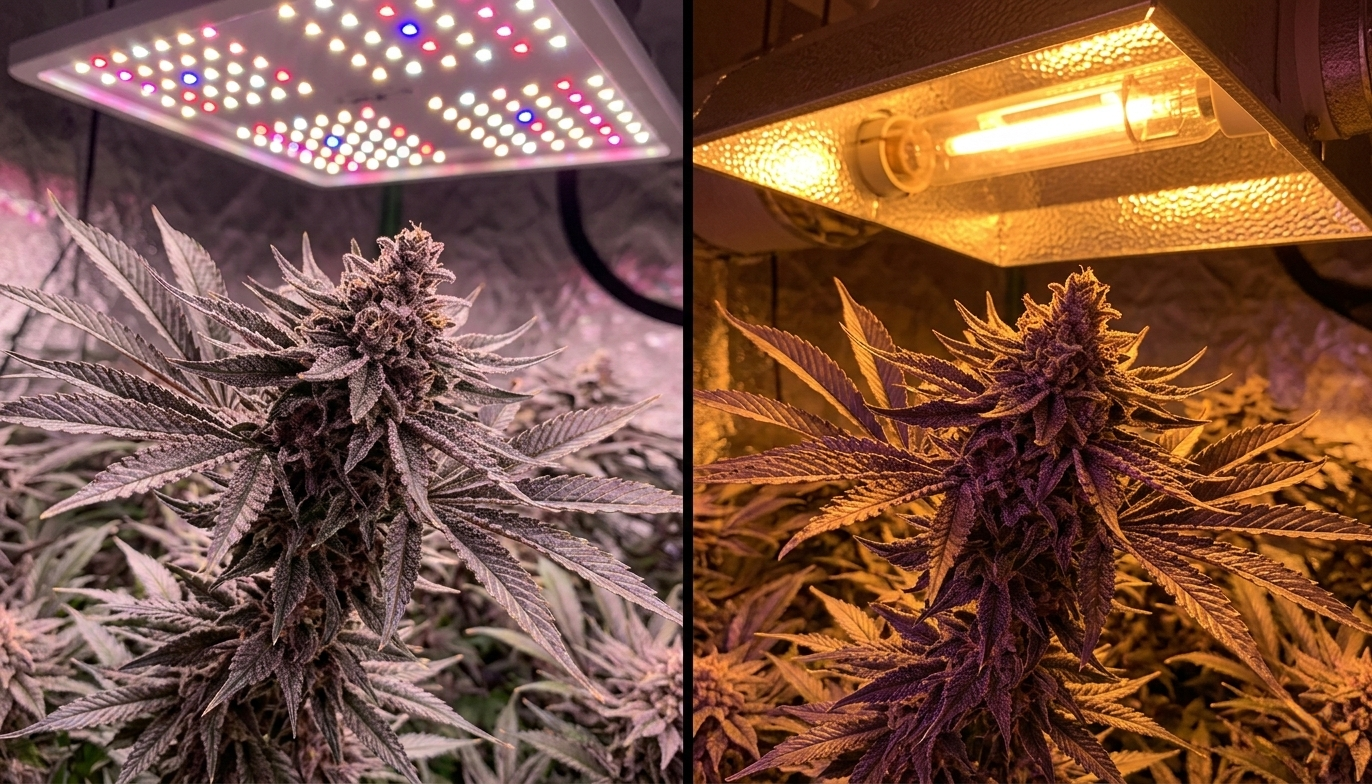
This is why the familiar “watts per square foot” rule can be useful only as a rough electrical sanity check. It cannot tell you whether two fixtures with different efficacies create the same canopy intensity.
How Much Grow Light Power Does Your Space Really Need?
The answer begins with photons, then returns to watts. First determine how much light needs to reach the canopy. Then compare fixtures capable of delivering that photon distribution. Finally use the fixture’s PPE and actual input power to understand how much electricity is required to produce it.
The approximate relationship between fixture output and electrical input is:
PPF = actual input watts x PPE
This equation is useful for checking whether a specification is internally plausible. It still does not prove coverage. A fixture can have high PPF and poor distribution for your particular canopy, while another can use the same total output more effectively because its physical dimensions and optical pattern fit the area better.
Use watts after you understand photon needs
Estimate the canopy photon requirement, compare fixture PPF and PPFD distribution, then use actual watts and PPE to compare electricity and heat.
Do not start with a fixed watts-per-square-foot rule
A fixed electrical ratio ignores fixture efficacy, distribution, optics, hanging height, dimming, and losses outside the productive canopy.
Modern fixture efficacy changes old wattage rules
Lighting technology improves over time. The current DesignLights Consortium Horticultural V4.0 qualification requirements use a minimum PPE of 2.5 µmol/J for eligible LED horticultural products. That number is a qualification benchmark, not a universal minimum for every home grow, but it shows why old wattage rules become unreliable when fixture efficacy changes.
If one grower sizes from a decades-old wattage rule and another sizes from measured photon output, they can reach very different conclusions about the same canopy. The photon-based method is more portable because it describes what the crop receives rather than how much electricity a historical lamp category happened to consume.
“Can I just buy 30 or 40 watts per square foot and stop there?”
Use that only as a rough cross-check. Two fixtures at the same watts per square foot can deliver different PPF and very different edge coverage. Compare actual wattage, PPE, PPF, and a PPFD map at the canopy size and hanging height you plan to use.
Question sent by: Julia Schneider, via email.
If wattage labels are still causing confusion, the actual wattage versus equivalent wattage guide separates electrical input from marketing replacement claims.
Turn Canopy Area Into a Photon Requirement
Once the canopy area is known, you can translate a chosen average PPFD into the photon flux that must cross that canopy plane. This creates a useful bridge between PPFD and fixture PPF without pretending that all emitted photons land inside the crop area.
The basic canopy-plane relationship is:
Incident canopy photon flux = average PPFD x canopy area in m²
If a 1.0 m² canopy averages 700 µmol/m²/s, about 700 µmol/s of photosynthetic photons are crossing that canopy plane. If the same average PPFD is required across 1.5 m², the canopy-plane requirement rises to about 1,050 µmol/s.
Canopy-plane photon flux is not the same as fixture PPF
Fixture PPF is the total photosynthetic photon output emitted by the luminaire. The canopy-plane calculation counts photons arriving across the selected area. Some emitted photons may land outside the canopy, strike walls, remain above the plane, or be distributed unevenly. Do not treat PPFD x area as an exact fixture-output requirement.
How to Match Grow Light Power to Canopy Size
The practical sequence is to calculate the canopy-plane requirement, then use fixture data to see whether a candidate can deliver it with acceptable uniformity. Do not divide by an invented universal “capture efficiency” percentage. Room reflectivity, fixture shape, optics, mounting height, wall distance, neighboring fixtures, and canopy dimensions all change how much emitted PPF reaches the target plane.
A credible PPFD map already contains much of that delivery information because it shows what was measured or modeled on a defined plane. The map is therefore more useful than trying to convert PPF into coverage with one generic loss factor.
| Nominal Canopy | Area | Photon Flux Across Canopy per 100 PPFD |
|---|---|---|
| 2 x 2 ft | 0.372 m² | 37.2 µmol/s |
| 2 x 4 ft | 0.743 m² | 74.3 µmol/s |
| 3 x 3 ft | 0.836 m² | 83.6 µmol/s |
| 4 x 4 ft | 1.486 m² | 148.6 µmol/s |
This table deliberately avoids prescribing a universal PPFD target. Multiply the right-hand value by the target in hundreds. For example, a 3 x 3 ft canopy at an illustrative average of 600 µmol/m²/s would receive about 502 µmol/s across the canopy plane. At an illustrative 900 µmol/m²/s, it would receive about 753 µmol/s.
Those examples describe incident photons across the measured area. The fixture’s published PPF must normally be higher because real rooms do not deliver every emitted photon perfectly onto the canopy.
Why there is no single universal cannabis PPFD target
Cannabis can use high light intensities under controlled conditions, but one study should not be turned into a universal home-grow target. In a 2021 controlled indoor experiment on one cultivar, average canopy PPFD treatments ranged from about 120 to 1,800 µmol/m²/s and dry inflorescence yield increased across that experimental range. The authors also emphasized that economics and production conditions matter, and the result came from a specific cultivar, environment, photoperiod, nutrition program, and experimental design.
That study shows why lighting capacity can matter. It does not prove that every canopy should be driven toward the highest treatment. Genetics, acclimation, CO₂, temperature, root-zone function, irrigation, nutrition, canopy architecture, and operating cost all change the useful light level.
Master Advice: Size for a controllable range, not one heroic number. A fixture with enough output and useful dimming gives you room to acclimate the canopy, respond to environmental limits, and correct an overestimated target without replacing the light.
Connect PPFD to DLI before increasing power
PPFD is an instantaneous rate. Daily Light Integral adds that rate across the photoperiod. Under a constant electric light, the relationship is:
DLI = PPFD x light hours x 3,600 / 1,000,000
This means that a canopy does not experience 600 µmol/m²/s for 12 hours the same way it experiences 600 µmol/m²/s for 18 hours. The fixture has not changed, but the daily photon dose has. Whenever photoperiod changes, recalculate DLI before assuming the dimmer should stay in the same position.
The grow-light guide covers PPFD and DLI in broader cultivation context. Here the key point is simpler: coverage must be evaluated together with the time that coverage is applied.
How to Read 2 x 2, 2 x 4, 3 x 3, and 4 x 4 Coverage
Coverage labels are convenient because tents and small rooms are often built around familiar footprints. The problem begins when a footprint is treated as a performance rating. “4 x 4 coverage” tells you the area the manufacturer wants you to associate with the fixture. It does not tell you the average PPFD, edge intensity, hanging height, dimmer setting, growth stage, or measurement method unless those conditions are shown.
Grow Light Coverage Explained: 2 x 2, 2 x 4, 3 x 3, and 4 x 4 Spaces
These footprints differ by more than a small change in side length. A 4 x 4 ft canopy has four times the area of a 2 x 2 ft canopy. A 3 x 3 ft canopy is 9 ft², while a 2 x 4 ft canopy is 8 ft², yet their shapes are very different. Similar area does not mean the same fixture geometry fits both.
A square fixture can align naturally with a square canopy. A long bar fixture or two smaller fixtures may fit a 2 x 4 ft rectangle better. The correct choice depends on the PPFD map, not the visual symmetry alone.

| Canopy Size | Area | Main Coverage Question | Common Mistake |
|---|---|---|---|
| 2 x 2 ft | 4 ft² / 0.372 m² | Can the fixture dim low enough and stay uniform at short room distances? | Buying excess PPF because the fixture is marketed as “future-proof.” |
| 2 x 4 ft | 8 ft² / 0.743 m² | Does the distribution follow the rectangular canopy without weak short edges? | Using a square PPFD map to justify rectangular coverage. |
| 3 x 3 ft | 9 ft² / 0.836 m² | Does the map maintain useful corners without forcing an excessive center? | Choosing from center PPFD and ignoring the perimeter. |
| 4 x 4 ft | 16 ft² / 1.486 m² | Can the fixture or fixture array cover the larger plane with acceptable uniformity and service access? | Assuming one fixture is automatically better than two because the total wattage is similar. |
2 x 2 ft: small area, little room for sloppy distribution
A small canopy needs fewer total photons than a large one, but that does not make fixture selection trivial. A powerful compact fixture can create a steep center-to-edge gradient if it must hang very close. A physically large fixture may not fit the enclosure or may leave no room for ducting, filters, fans, and safe adjustment.
For a small canopy, dimming range and physical dimensions often matter as much as maximum output. The best fixture is not the one that can create the highest center PPFD. It is the one that can produce the intended map at a workable height while leaving enough adjustment range for earlier stages and environmental changes.
2 x 4 ft: shape matters as much as area
A 2 x 4 ft canopy is almost the same area as a 3 x 3 ft canopy, but its aspect ratio is very different. This is where fixture geometry becomes obvious. A square light can create good average PPFD while still leaving the long ends weak, or it can be driven hard enough to fill the ends and over-intensify the center.
Look for a PPFD map measured across the actual 2 x 4 ft footprint. If the manufacturer only publishes a square map, do not assume the corners of a rectangle will behave the same way.
3 x 3 ft: watch the corners
A 3 x 3 ft footprint is large enough for edge and corner behavior to become meaningful, yet small enough that many fixtures can claim to cover it. Compare map conditions carefully. A fixture can produce an excellent average while the corners receive much less light than the center.
If you plan to fill the entire footprint with productive tops, those corners matter. If the plant canopy is intentionally smaller than the tent, a weaker perimeter may be irrelevant. This is another reason to measure usable canopy rather than automatically buying for wall-to-wall coverage.
4 x 4 ft: evaluate one fixture against an array
A 4 x 4 ft canopy is large enough that fixture geometry, wall interaction, overlap, and working height can strongly affect uniformity. One large fixture may fit well. Two smaller fixtures can also create useful overlap and independent dimming, depending on the room.
Do not assume that identical total wattage means identical performance. Compare total PPF, PPE, map distribution, hanging height, driver placement, dimming control, service access, and the ability to adjust sections independently.
“A light says 3 x 3 flower and 4 x 4 veg. Which coverage number is real?”
Both may describe different intensity goals, but the labels are not enough on their own. Check the PPFD maps, hanging heights, dimmer settings, and measurement footprints behind each claim. Coverage should be tied to a measurable canopy intensity, not only a growth-stage word.
Question sent by: Ethan Brooks, via contact form.
How Much Indoor Grow Space Does One Plant Need?
One plant does not have one fixed square-foot requirement. Plant count and canopy area are different variables.
A single plant can be kept compact or trained to occupy a much wider footprint. Several smaller plants can fill the same canopy that one larger plant would occupy. Genetics, vegetative duration, container size, pruning, training, plant health, cultivar architecture, legal plant-count limits, and the grower’s preferred workflow all change the relationship.
How Much Indoor Grow Space Does One Plant Need?
The better question is: how much canopy area will this plant be allowed to occupy? Lighting should be sized to that productive area, not to the number of stems or containers underneath it.
If four plants are trained into one continuous 3 x 3 ft canopy, the fixture sees a 3 x 3 ft photon-distribution problem. If one plant is trained into the same 3 x 3 ft area, the fixture sees essentially the same top-plane coverage problem. Root volume, irrigation demand, and plant management differ, but the lighting plane does not suddenly become four times larger because four containers are present.
Size the light to the finished canopy
Decide how much horizontal area the tops will occupy and measure that area as one lighting zone.
Do not buy light by plant count alone
One trained plant can occupy more area than several small plants. Plant count does not define photon density.
Plant count can still affect uniformity indirectly
Although plant count does not directly determine fixture size, it can change canopy shape. Many small plants may create a flatter and more continuous surface. A few large plants may create taller centers, gaps, and uneven tops. Those differences can change how well one measurement plane represents the real canopy.
When canopy height varies substantially, measure more than one location and consider whether training or fixture adjustment can reduce the height difference. The goal is to avoid solving a plant-architecture problem only by adding more power.
Remember: A lighting system covers area, not plant count. Count plants for legal compliance, irrigation, containers, labor, and workflow. Size photons to the canopy they create.
Match Fixture Geometry and PPFD Maps to the Canopy
Total PPF tells you how many photosynthetic photons leave the fixture each second. The PPFD map tells you how those photons arrive across a plane. Coverage decisions require both.
This is where form factor, diode spacing, optics, reflector design, bar spacing, board size, hanging height, and neighboring fixtures become practical rather than cosmetic. A fixture may have enough total PPF for the canopy but distribute it poorly for your shape.
Start with the map footprint and measurement height
Compare PPFD maps only when you know the footprint and hanging height. A map measured over 2 x 2 ft cannot be used directly to prove 3 x 3 ft performance. A map at 12 inches cannot be compared fairly with another at 24 inches without understanding how the beam spreads.
Also confirm whether the map is measured, simulated, or unspecified. Simulation can be useful when the inputs and method are credible, but it should not be presented as if a quantum sensor physically measured every point.
Average PPFD matters, but minimum and maximum explain the map
Average PPFD tells you the overall photon density across the mapped area. The minimum and maximum help reveal the spread. A high maximum with a weak minimum can indicate a strong center and weak perimeter. A lower maximum with a stronger minimum may represent a more even canopy, depending on the average and your target.
No single uniformity ratio should be treated as a universal cannabis pass/fail standard. The acceptable spread depends on canopy management, cultivar, fixture overlap, room walls, and how close the crop operates to its upper light tolerance.
Coverage is a distribution, not a rectangle
A coverage claim should describe how photon density is distributed across a defined plane at a defined height and power setting. A footprint label without that distribution hides the difference between a well-lit edge and a barely illuminated edge.
Use the fixture’s physical shape as a first clue, not a verdict
A long fixture often matches a rectangular canopy more naturally. A broad square fixture may align well with a square footprint. Distributed bar fixtures can provide multiple light-emitting lines across a large plane. Compact boards can work extremely well when their diode distribution, optics, and mounting height create the map the canopy needs.
Form factor alone does not decide uniformity. Bar-style and board-style fixtures can both work well when their dimensions, diode layout, and tested distribution fit the canopy. Keep the larger coverage decision focused on the measured map rather than the fixture’s appearance.
Walls and neighboring fixtures change the installed map
Manufacturer maps are usually produced under controlled conditions. Reflective walls can return some photons toward the canopy. Dark room surfaces can absorb them. Multiple fixtures can overlap and raise edge intensity between units. Fixtures too close to a wall can create a different distribution from the same light in an open test area.
This means a published map is a planning tool, not the final measurement of your room. Use it to select a plausible fixture and starting height. Then measure the installed canopy.
“If the manufacturer’s PPFD map looks perfect, do I still need to measure my canopy?”
Yes if you want to verify the setup. Your walls, fixture height, dimmer position, canopy shape, neighboring lights, and meter can differ from the test conditions. Use the published map as the starting hypothesis and your installed measurements as the check.
Question sent by: MapleGrower, via Facebook page.
Fixture overlap can solve edge weakness or create new hotspots
In multi-fixture rooms, the edge of one light can overlap with the edge of another. This can improve uniformity, but the centerline between fixtures can also become too intense if spacing is too tight or the fixtures are driven too hard.
Do not size each fixture as if it operates alone and then assume the maps simply tile together. Build a grid across the combined canopy and measure the overlap zones after installation.
Pro Tip: When comparing two layouts with similar total PPF, prefer the one that reaches the target canopy with less extreme dimming, fewer deep edge losses, and enough adjustment range to correct real measurements later.
Power, Height, Heat, and Headroom Change the Useful Coverage
A lighting plan can be photon-correct on paper and still fail in the room. Vertical clearance, dimming, environmental control, and electrical capacity determine whether you can operate the fixture at the map you intended to use.
Hanging height changes distribution
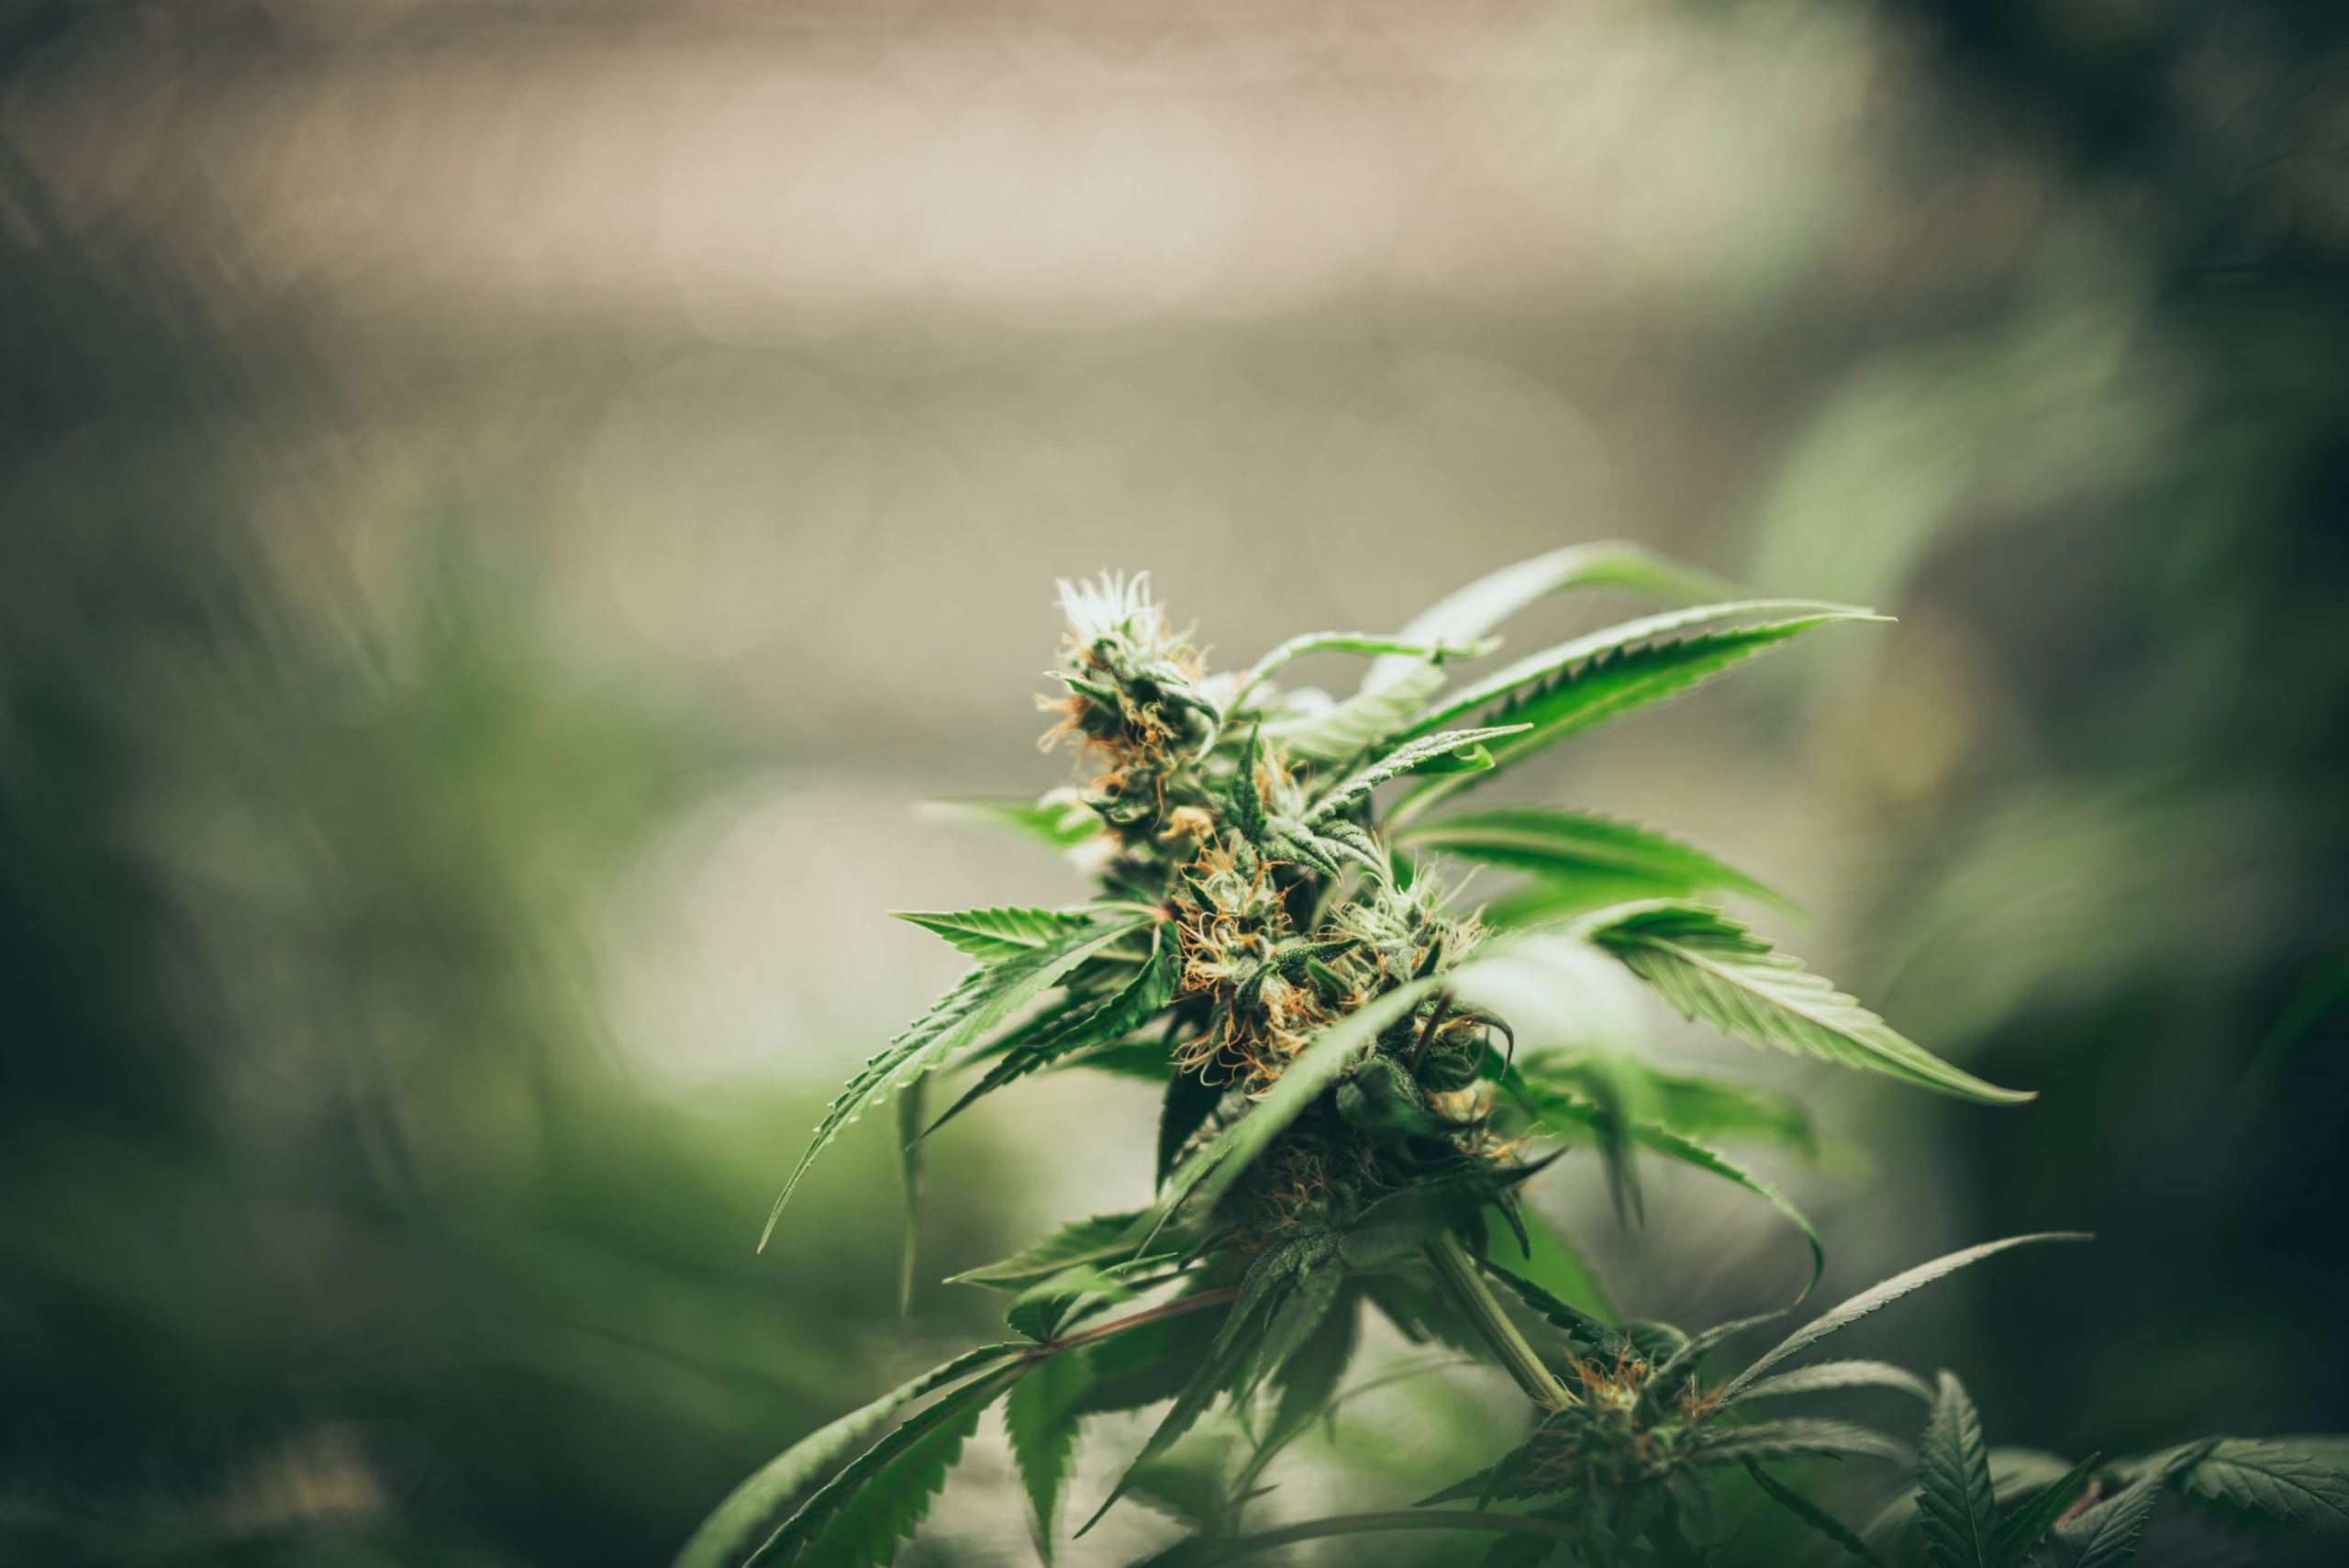
Moving a fixture closer usually raises intensity near the center and can reduce blending between individual emitters. Moving it farther away usually broadens the distribution while lowering PPFD because the photons are spread over a larger area and more can miss the target footprint.
There is no universal hanging height for a wattage class. Fixture dimensions, optics, bar spacing, driver position, canopy size, and target intensity all matter. Begin with the manufacturer’s tested map, then measure.
Dimming changes output, but not always every part of the map perfectly
Dimming is one of the most useful tools in a properly sized fixture because it lets you buy enough maximum output without forcing the canopy to receive it all the time. It supports acclimation, early-stage use, environmental adjustments, and seasonal changes in room cooling.
Do not assume every dimmer scale is perfectly linear. A knob at 50 percent does not automatically prove that PPF is exactly 50 percent of maximum unless the manufacturer documents that relationship. If precise control matters, measure PPFD after changing the setting.
Electrical power becomes room heat
Higher input power increases the electrical load and eventually contributes heat to the indoor environment. More efficient fixtures create more photons per joule, but electricity that enters the grow space still has to be managed thermally.
A canopy may appear to “need” more light because the fixture map is weak, while the room may be unable to remove the additional heat and moisture created by stronger growth and higher electrical input. Lighting is therefore part of the environmental system, not an isolated purchase.
Do not solve a coverage problem by raising power before checking the map
If the center is already high and only the edges are weak, adding power may increase the center faster than it fixes the perimeter. Fixture height, geometry, overlap, canopy width, or a different layout may be the real solution.
For room planning beyond lighting, use the grow-room setup guide and indoor growing basics rather than expanding this page into a full environmental guide.
Verify Coverage After Installation
A lighting plan is not finished when the fixture turns on. The final step is to test whether the installed canopy receives the distribution you selected on paper.
The simplest useful verification is a repeatable PPFD grid measured at canopy height. Use the same meter, sensor orientation, grid points, fixture setting, room configuration, and approximate warm operating condition each time. Record the values so future changes can be compared against a baseline.
Build a repeatable grid
Mark the canopy corners, edges, center, and intermediate points. Larger canopies need more points because a four-corner-and-center check can miss stripes, overlap zones, or local hotspots. The exact spacing does not need to follow one universal formula. It needs to be dense enough to represent the distribution you are trying to verify.
Measure on a consistent horizontal plane. If the canopy is uneven, record the height difference and consider a second set of spot checks on the tallest tops. Do not move the sensor toward the fixture at some points simply because the leaves happen to be taller there unless your goal is specifically to characterize the real uneven surface.
Compare average, minimum, maximum, and pattern
Average PPFD tells you whether overall intensity is near the intended level. Minimum and maximum show the spread. The spatial pattern tells you where to act.
If all points are low, more output or less distance may help. If only the perimeter is low, stronger dimming alone may not solve the geometry. If one narrow band is high, bar spacing, fixture overlap, or canopy height may be responsible. The correction should match the pattern rather than the symptom label.
Re-measure after every meaningful geometry change
Measure again after changing fixture height, dimmer setting, fixture spacing, overlap, canopy dimensions, or the vertical position of the plant tops. A previous PPFD map is not a permanent property of the room.
This baseline also improves later diagnosis. If top growth begins to show stress, you can compare the current map with the earlier map instead of guessing whether the fixture “feels too strong.” If the canopy stretches, you can check whether the low zones actually became weaker as plants moved or the light was raised.
Important: Leaf symptoms do not replace measurement. Heat stress, root-zone stress, nutrient imbalance, pests, disease, and excessive photon exposure can overlap visually. Use the light map as one part of diagnosis, not the entire diagnosis.
Convert measured PPFD to DLI when the schedule changes
If the light output is stable, measured PPFD can be converted to DLI with the photoperiod formula. This is especially useful when changing schedules because the same instantaneous PPFD produces a different daily dose when the number of light hours changes.
Do not use one instantaneous sunlight measurement the same way outdoors because solar PPFD changes throughout the day. The simple conversion is appropriate for approximately constant electric-light output.
Use fixture PPF as a cross-check, not as a substitute for the map
If a fixture’s published PPF is known, compare it with the approximate photon flux represented by your canopy map. A large mismatch can signal that the mapped footprint captures only part of the emitted output, that the map area is too small, that edge spill is substantial, or that the specification and map need closer scrutiny.
When estimating delivered PPF from a PPFD map, divide the canopy into equal cells, multiply each cell’s PPFD by its area, and add the results. Use enough measurement points to represent edges, corners, and hotspots rather than relying on a single center reading.
Common Coverage and Power Mistakes
Most lighting-sizing errors are not caused by difficult mathematics. They come from using a convenient number as a substitute for the whole system.
Mistake: buying by tent label
A product page says “4 x 4 flower,” so the buyer assumes every point in a 4 x 4 ft tent will receive suitable flowering intensity. Without a map, height, and dimmer setting, that label is incomplete.
Mistake: buying by equivalent wattage
Equivalent wattage does not describe real electrical input or canopy photon delivery. It should not be used to size the fixture, calculate operating cost, or plan circuit load.
Mistake: using only the center PPFD
One strong center reading can hide weak edges. Coverage is a distribution problem. Always evaluate more than one point.
Mistake: assuming more power fixes bad geometry
If the map is already uneven, adding power can preserve the same pattern at a higher intensity. The center becomes more intense while the edges remain proportionally weak.
Mistake: treating one research PPFD as a universal target
Research establishes biological responses under defined conditions. It does not automatically establish the correct operating point for every cultivar, room, photoperiod, CO₂ level, root zone, climate-control system, or electricity budget.
Mistake: ignoring usable vertical height
A fixture may produce a strong map only at a hanging distance the room cannot physically maintain above the mature canopy. Include containers, plant height, fixture thickness, hangers, filters, ducting, and safe service clearance in the vertical plan before buying.
Mistake: using plant count as a lighting formula
Plant count does not describe canopy area. One large trained plant and several smaller plants can occupy the same horizontal surface.
Area, photons, distribution, and verification
Measure the canopy, define the light goal, compare PPF and PPFD maps, check electrical and thermal fit, then verify the installed grid.
Tent size, plant count, or watts alone
Each is useful context, but none independently describes the photon density and uniformity reaching the productive canopy.
Final Canopy-Sizing Checklist
The best light for a canopy is not the fixture with the largest advertised coverage, highest wattage, or highest center PPFD. It is the system that can place the intended photon density across the real productive area while fitting the room, electrical supply, environmental capacity, and adjustment range.
Use this checklist before purchasing or repositioning a fixture.
Canopy Sizing Checklist
Verify the lighting plan from area to installed map
- Measure the productive canopy instead of assuming the full tent floor is active.
- Convert the canopy area to square meters for PPFD and photon-flux calculations.
- Decide which growth stage and photoperiod the lighting zone must support.
- Choose an evidence-based PPFD range for your actual environment rather than one universal target.
- Calculate the approximate photon flux crossing the canopy plane at that average PPFD.
- Compare fixture PPF and PPE without treating either as proof of coverage.
- Inspect a PPFD map for the same or closely comparable footprint and hanging height.
- Check average, minimum, maximum, corners, edges, and any fixture-overlap zones.
- Confirm the fixture physically fits with enough vertical clearance and service access.
- Use actual watts for electrical load, heat, and operating-cost planning.
- Confirm the dimming range gives useful adjustment above and below the initial setting.
- Measure a canopy grid after installation and record the baseline.
- Re-measure after changing height, dimming, overlap, or canopy shape.
- Recalculate DLI whenever photoperiod or measured PPFD changes materially.
If you remember only one rule, make it this: size the light to the measured canopy and verify what arrives there. Tent labels, watts, plant count, and fixture names can help organize the decision, but the canopy map is where coverage becomes real.
Share this article
A quick overview of the topics covered in this article.
- Measure the Usable Canopy Before You Size the Light
- Why Watts Alone Cannot Define Coverage
- Turn Canopy Area Into a Photon Requirement
- How to Read 2 x 2, 2 x 4, 3 x 3, and 4 x 4 Coverage
- How Much Indoor Grow Space Does One Plant Need?
- Match Fixture Geometry and PPFD Maps to the Canopy
- Power, Height, Heat, and Headroom Change the Useful Coverage
- Verify Coverage After Installation
- Common Coverage and Power Mistakes
- Final Canopy-Sizing Checklist
Follow us
Latest articles
September 30, 2026
September 30, 2026