Cannabis Watering Log and Plant Water-Use Tracking by Weight: Gravimetric Monitoring, Logging Protocols, and Benchmarking
In commercial controlled-environment cannabis production, the difference between mediocre yields and championship-grade agronomy lies in the precision of empirical data collection. While hobbyist growers rely on guesswork or occasional finger-poking into the surface soil, professional cultivators manage their root zones through rigorous gravimetric monitoring and systematic daily watering logs. In physics, gravimetric moisture determination represents the absolute gold standard against which all other soil moisture sensors are calibrated. Because liquid water possesses a known density of exactly 1.00 gram per milliliter (1.00 g/cm3 at 20 °C), weighing a potted cannabis plant provides a continuous, non-destructive, milliliter-accurate measurement of plant water consumption and substrate depletion. Every gram of mass lost from an enclosed container between irrigation events corresponds directly to one milliliter of water transpired by the canopy or evaporated from the medium surface. Tracking these mass deltas across time enables growers to calculate transpiration velocity (g/hr), evaluate root uptake vigor, detect early root rot before foliar symptoms emerge, and calculate Water-Use Efficiency (WUE) down to the milligram of floral biomass per liter of water consumed.
While our foundational guide on outdoor pot-weight deep moisture checks teaches growers how to utilize qualitative manual container lifting in outdoor soil beds, indoor commercial production requires quantitative digital precision. When managing hundreds of plants across commercial rolling benches, relying on subjective human muscle memory creates unacceptable variability between employees and shifts. Deploying automated digital bench scales, continuous strain-gauge load cells, and structured digital watering logs transforms irrigation into a reproducible, audited manufacturing process. Operators can verify whether plants achieve target 10% to 15% vegetative dry-backs or 20% to 25% generative dry-backs, audit runoff leaching fractions daily, and benchmark cultivar-specific water curves. This comprehensive technical guide details the physical principles of gravimetric moisture tracking, load cell telemetry engineering, log book data schemas, and mathematical performance benchmarks required to master cannabis water tracking, connecting directly with our core guides on cannabis dry-back and VWC targets, moisture sensors and automated irrigation, and irrigation and root-zone EC dynamics.
Gravimetric Physics: Mass Conservation and Converting Weight to VWC
To implement gravimetric tracking, cultivators must understand the physical mass balances governing a potted cannabis container across dynamic wetting and drying cycles:
- Total Container Mass Balance: At any point in time, total measured weight (Mtotal) is the sum of five components: Mtotal = Mpot + Mdry_sub + Mwater + Mplant + Mtrellis. Mpot (container tare weight), Mdry_sub (dry mass of substrate), and Mtrellis remain constant over weekly intervals. Mwater fluctuates dynamically between irrigation pulses and dry-backs. Mplant (fresh vegetative biomass) accumulates gradually over the 8-to-10-week lifecycle, creating a slow upward baseline drift that must be mathematically accounted for. By establishing a weekly tare schedule, growers eliminate biomass distortion from true moisture curves.
- Gravimetric Water Content (θg): Gravimetric water content is defined as the mass of liquid water divided by the dry mass of the substrate: θg = (Mwet – Mdry) / Mdry × 100. Because coarse coconut coir and horticultural rockwool hold up to 8 to 10 times their own dry weight in water, θg in soilless media often exceeds 800% at container capacity. In mineral soils, gravimetric moisture rarely exceeds 35% to 45% due to higher particle density.
- Converting Container Weight to Volumetric Water Content (VWC %): Volumetric water content represents the ratio of water volume to total substrate bulk volume. To convert mass loss to VWC percentage, growers utilize substrate dry bulk density (ρb): VWC % = θg × (ρb / ρw), where ρw is the density of water (1.0 g/cm3). In a standard 3-gallon (11.35-liter) pot, every 113.5 grams of water lost equals an exact 1.0% drop in Volumetric Water Content. This physical equivalence allows growers to audit digital FDR/TDR soil sensors against calibrated platform scales with absolute laboratory precision, resolving discrepancies between probe telemetry and true container mass.
The Agronomic Physics: The One-to-One Equivalence of Grams and Milliliters
In container agronomy, the metric system provides an invaluable physical advantage: 1 gram of mass = 1 milliliter of water = 1 cubic centimeter (cm3). If a digital scale under a 2-gallon flowering plant records a mass drop from 4,850 grams down to 3,650 grams over an eight-hour photoperiod, the cultivator knows with 100% mathematical certainty that the plant has transpired exactly 1,200 milliliters of water (150 ml/hr). No other sensing technology provides this level of non-invasive, foolproof transpirational tracking.
Load Cell Hardware: Strain Gauges, Continuous Telemetry, and Scale Selection
Implementing gravimetric monitoring across a commercial facility requires selecting proper weight instrumentation tailored to high-humidity horticultural rooms:
- Continuous Strain-Gauge Load Cells: Commercial research benches install industrial stainless steel single-point load cells directly beneath representative index pots. When the container presses down on the load cell, internal piezoresistive foil strain gauges deform microscopically, altering electrical resistance in a balanced Wheatstone bridge circuit. An analog-to-digital converter converts this millivolt signal into grams, transmitting real-time weight telemetry via RS-485 Modbus or 4-20mA industrial current loops into the facility SCADA environmental dashboard. These continuous sensors reveal micro-transpirational surges tied to room dehumidification and lighting cycles.
- Spot-Check Platform Scales: In smaller facilities where continuous under-pot load cells are cost-prohibitive, operators utilize heavy-duty benchtop digital shipping scales with external displays. Designated index containers (3 to 5 plants per room) are lifted and placed on the scale twice daily: immediately before morning P1 irrigation (recording overnight dry-back floor weight) and 30 minutes post-irrigation after free gravitational drainage has ceased (recording container capacity peak weight). This manual routine establishes reliable dry-back tracking with zero capital expenditure for automated wiring.
- Avoiding Scale Creep and Drift: Inexpensive consumer postal scales suffer from severe zero-drift and electronic creep when subjected to continuous static loads over several days. Furthermore, budget scales enter automatic power-saving sleep modes after 60 seconds, making them useless for continuous telemetry. Commercial installations require temperature-compensated, IP67-rated washdown industrial scales with continuous live display and zero auto-shutoff. Stainless steel load cell platforms resist corrosive fertilizer salts, ensuring years of drift-free data collection.
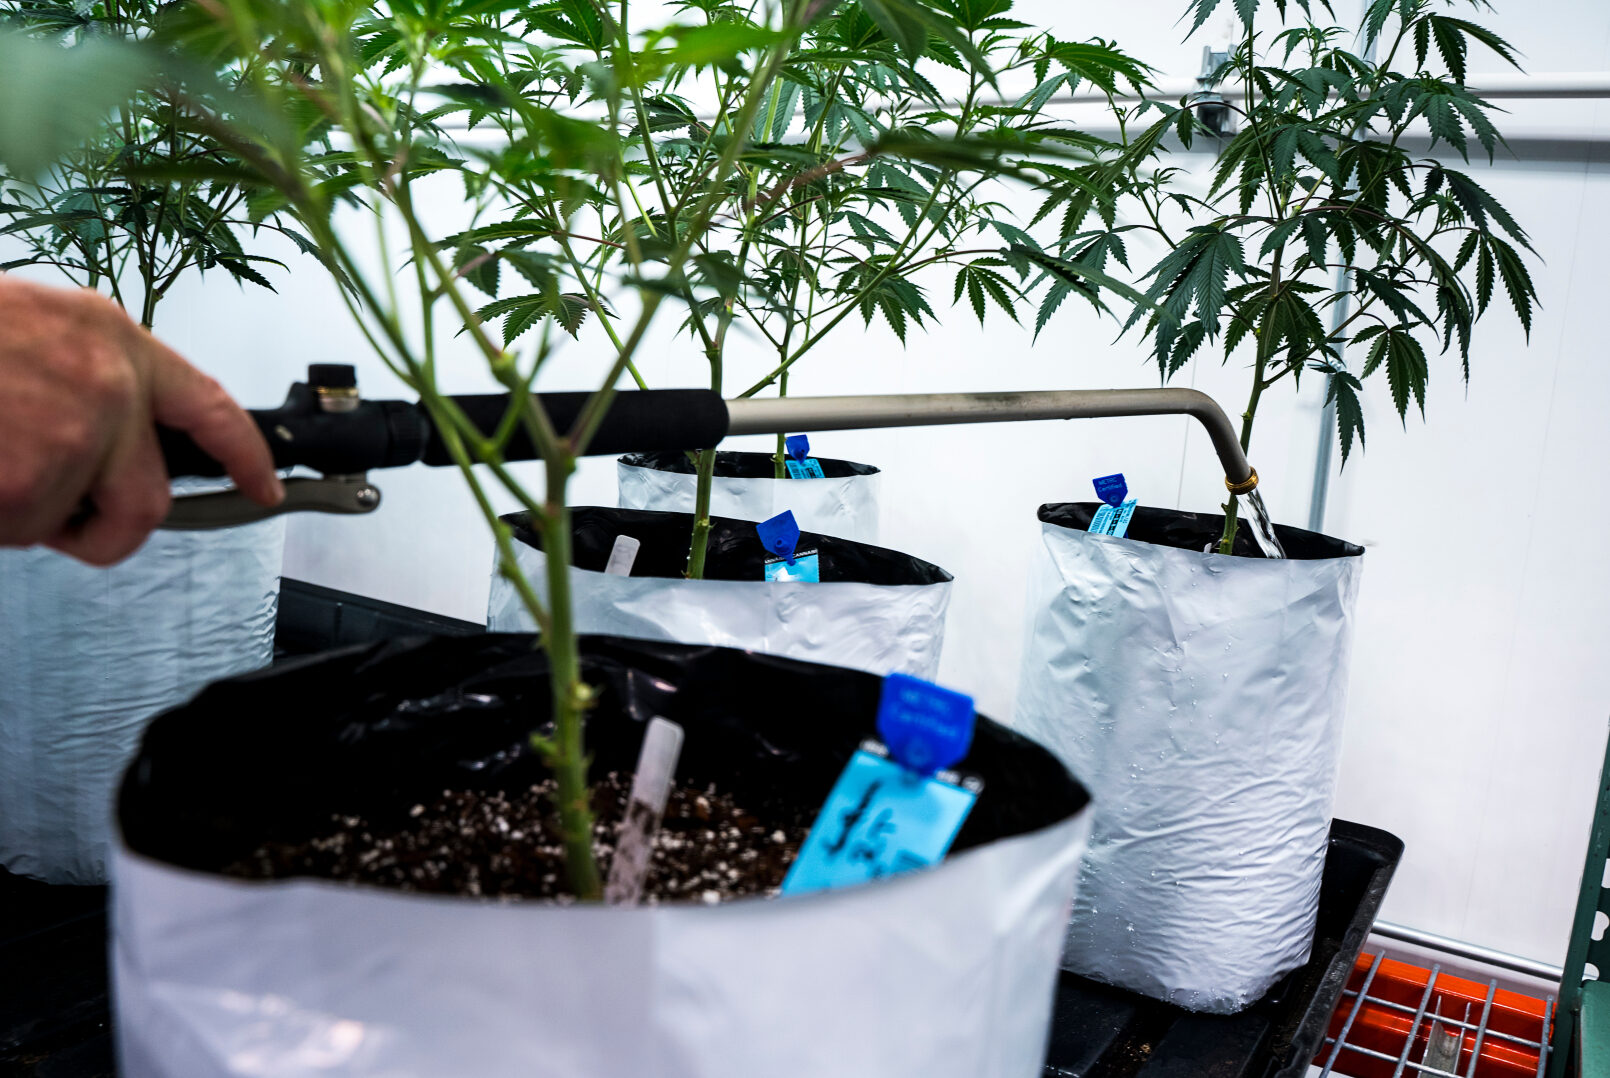
Plastic container grow bag positioned on bench scale to log dry-back velocity and post-irrigation saturation weight.
Water-Use Efficiency (WUE): Calculating Grams of Dry Flower per Liter of Water
Logging daily water consumption allows commercial cultivators to evaluate cultivar performance using agronomic efficiency metrics and diagnostic baselines:
- The Water-Use Efficiency Equation: In agricultural plant physiology, Water-Use Efficiency (WUE) quantifies the economic biomass produced per unit of water consumed: WUE = Dry Floral Biomass (grams) / Cumulative Transpiration Volume (liters). In indoor high-PPFD cannabis production under supplemental carbon dioxide (1,200 ppm CO2), benchmark WUE typically ranges from 1.4 to 2.2 grams of trimmed dry flower per liter of water transpired. Cultivars exhibiting high WUE maximize carbon fixation while minimizing dehumidification operational costs. Facilities calculating WUE can directly compare the economic profitability of different genetic lines under identical lighting grids.
- Detecting Root Pathogen Collapse 48 Hours Early: Transpiration velocity is the most sensitive early bio-indicator of subterranean root health. If a healthy plant transpires 180 ml/hr under constant VPD and light, and suddenly transpires only 60 ml/hr on the following day without any microclimatic change, root hydraulic conductivity has suffered catastrophic failure. Early Pythium or Fusarium root rot destroys fine root hairs and clogs vascular xylem days before leaves show visible chlorosis or wilting. Gravimetric logging alerts growers to root rot 48 to 72 hours before visible symptoms manifest, allowing immediate biological remediation.
- Benchmarking Phenotypic Water Curves: Different genetic cultivars possess vastly divergent hydraulic architectures. Broad-leaf indica cultivars often exhibit conservative transpiration and narrow daily water use, while vigorous sativa-dominant strains consume up to 40% more water per square meter of canopy. Daily gravimetric logging enables facilities to group cultivars with identical transpirational curves onto dedicated irrigation zones, eliminating the overwatering of slow drinkers and under-watering of aggressive feeders.
| Log Field | Data Type & Units | Timing of Measurement | Agronomic Purpose |
|---|---|---|---|
| Date & Photoperiod Hour | YYYY-MM-DD (Hour 0 to 24) | Every observation event | Establishes exact temporal timeline for dry-back curves |
| Pre-Irrigation Weight (Wpre) | Mass in grams (±1 g) | Immediately before P1 morning pulse | Determines overnight dry-back floor and water deficit |
| Delivered Feed Volume (Vin) | Volume in milliliters (ml) | Sum of all daily drip shots | Tracks total gross water input per plant |
| Post-Irrigation Weight (Wpost) | Mass in grams (±1 g) | 30 min after final morning pulse | Confirms container capacity and peak substrate saturation |
| Leachate Runoff Volume (Vdrain) | Volume in milliliters (ml) | End of daily irrigation window | Calculates exact Leaching Fraction: LF = Vdrain / Vin |
| Runoff EC & Runoff pH | EC in dS/m; pH in standard units | Within 15 min of collection | Audits salt accumulation, nutrient uptake, and root acid flux |
| Net Daily Transpiration (Tnet) | Milliliters (g) / 24 hr | Calculated daily at lights-on | Tnet = Wpost(yesterday) – Wpre(today) |
The structured data schema detailed in Table 1 represents the standard operating procedure for commercial cannabis research and facility auditing. By logging these core parameters daily, cultivation teams eliminate subjective guessing, transforming fertigation into a verifiable, audit-ready data stream. However, when growers begin implementing gravimetric logging over multi-week flowering cycles, they quickly encounter physical variables that can distort weight measurements if not properly accounted for. A primary mathematical challenge involves the gradual accumulation of fresh biomass: as the cannabis plant produces dense branches, broad fan leaves, and heavy resin-coated floral colas, the physical tare weight of the living plant increases continuously. Inexperienced growers who fail to correct for this biomass accumulation often miscalculate their true substrate volumetric water content.
How much does growing bud weight distort my container tare weight over an 8-week flower cycle?
Question sent by: Liam Gallagher, via email.
“I weigh my 3-gallon coco pots daily on a digital postal scale to calculate dry-backs. In week 1 of flower, my container capacity saturation weight was 5,200 grams. By week 7 of flower, the container capacity weight reads 6,450 grams! Does this extra 1,250 grams mean the coco is holding more water, or is that the actual plant weight throwing off my dry-back calculations?”
Your coco coir is holding roughly the exact same volume of water as week 1: that additional 1,250 grams is accumulated fresh plant biomass and structural root mass.
Living cannabis tissue consists of approximately 80% to 85% water by weight. Over an 8-week flowering period, a vigorous indoor cannabis plant develops substantial structural mass: main stems, woody lateral branches, hundreds of fan leaves, a massive root ball, and dense floral colas. In a high-yielding 3-gallon container, total above-ground and root fresh biomass routinely expands from approximately 300 grams at flip up to 1,400 to 1,800 grams at harvest.
If you do not update your tare weight baseline, you will introduce severe calculation errors. For example, if you assumed your container capacity was still 5,200 grams, a week-7 dry pot weighing 5,100 grams would appear to be 98% full of water, when in biophysical reality, the substrate is completely bone dry because 1,300 grams of that mass is plant flesh!
The Correction Protocol: Establish a rolling dynamic tare correction. In commercial research, growers add an estimated 15 to 25 grams of fresh biomass per day to the baseline container tare during the vegetative and stretch phase (weeks 1 to 3), tapering down to 8 to 12 grams per day during late flower bulking. Alternatively, verify container capacity saturation weight immediately after a thorough leaching event once every 7 days, resetting your “100% full” baseline weekly.
Liam’s experience highlights why dynamic tare calibration is vital for accurate gravimetric calculations. By adjusting baseline container weights weekly, cultivators prevent biomass accumulation from masking true substrate moisture depletion. In addition to tracking container weight, commercial watering logs require precise auditing of drainage runoff metrics. Measuring the exact volume, electrical conductivity, and pH of leachate runoff provides the empirical feedback needed to balance irrigation delivery with root nutrient uptake. If drainage volume drops while runoff EC climbs, growers can instantly diagnose salt accumulation before root hair plasmolysis occurs. This holistic data logging approach connects physical scale measurements with liquid chemical analytics.
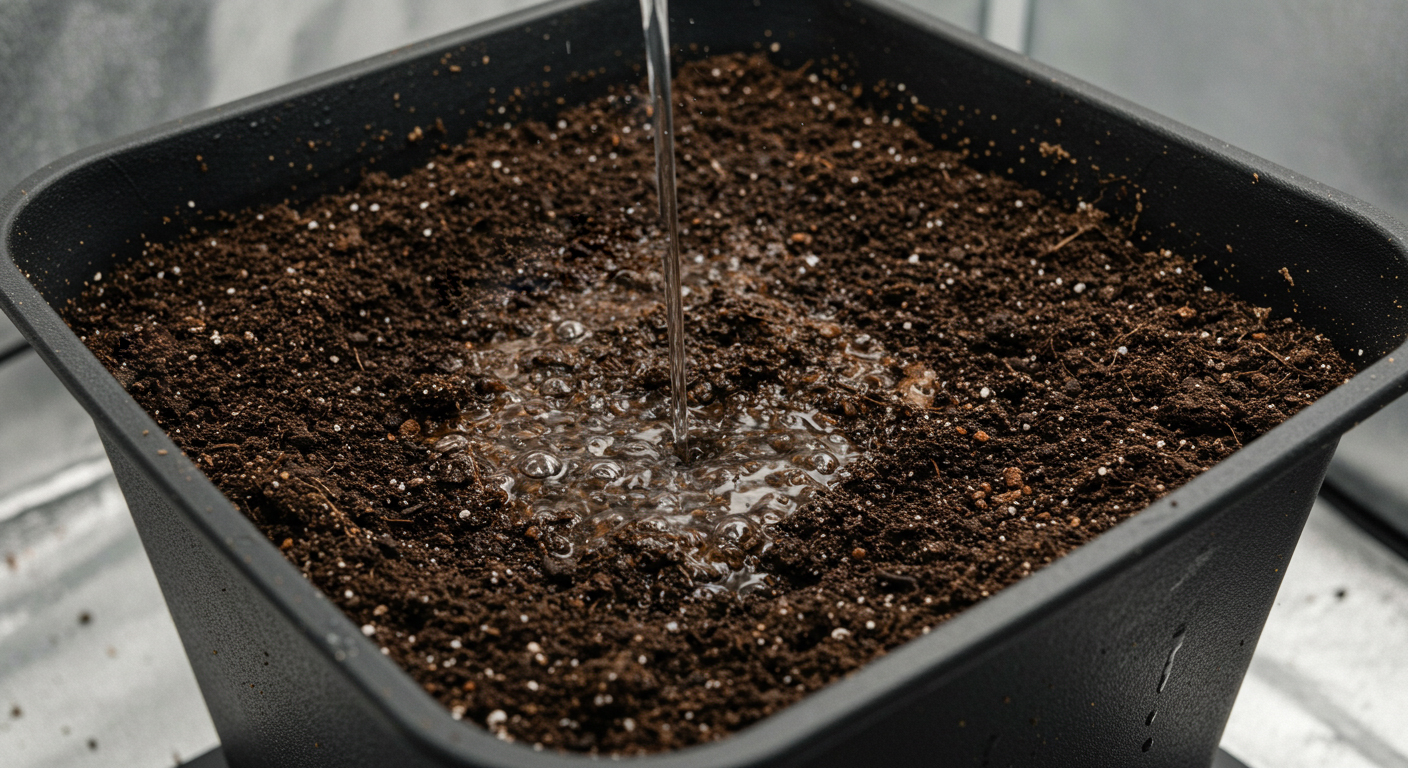
Drainage leachate capture pan used to measure exact runoff volume and electrical conductivity for the daily watering log.
Scale Hardware Pitfalls: Tare Sleep, Drift, and Industrial Load Cell Integration
To gather reliable gravimetric data, cultivators must avoid common hardware traps inherent to consumer weighing devices:
- The Auto-Off Power Trap: The majority of inexpensive consumer digital kitchen and postal scales feature an un-configurable auto-power-off timer that shuts off the display after 60 to 120 seconds of inactivity. If a grower attempts to leave a pot permanently sitting on a consumer scale to monitor real-time transpiration, the unit shuts off, losing its tare calibration. Commercial facilities require scales with AC power adapters and certified continuous-on operation.
- Piezoresistive Strain-Gauge Creep: When an inexpensive mechanical scale supports a heavy static load (such as a 10-kilogram wet soil container) continuously for weeks, the internal metal beam experiences physical deformation known as strain creep. Over 14 days, the scale reading can drift upward or downward by 100 to 300 grams, falsifying dry-back percentages. Industrial agricultural load cells utilize aircraft-grade aluminum or stainless steel with internal temperature compensation circuitry that eliminates creep drift across 0 °C to 50 °C temperature swings.
- Trellis Netting Mechanical Interference: In commercial SCROG (Screen of Green) canopies, horizontal nylon or polypropylene trellis netting supports heavy flowering branches. If branches are physically woven tightly into a stationary wall-mounted trellis, the net partially supports the plant’s weight. As the plant expands, the trellis pushes upward or downward on the container, introducing mechanical weight artifacts of up to 500 grams. When using under-pot load cells, the trellis grid must be mounted directly to the container frame or pot base, ensuring the entire plant and trellis move as a single self-contained suspended mass.
The Mechanical Trap: How Wall-Mounted Trellis Nets Ruin Load Cell Accuracy
The single most common mistake when installing under-pot load cells in flowering rooms is tying the canopy into fixed wall-mounted trellis netting. As flowering colas swell and branches sag, the rigid net catches and suspends the plant stems, lifting weight off the bottom scale. The load cell will falsely report that the pot is drying down at an impossible rate (300+ ml/hr), tricking automation systems into delivering excessive irrigation shots. Always ensure that containers on load cells are mechanically isolated from static walls, or attach supportive bamboo stakes directly within the pot.
Mechanically isolating containers guarantees that digital scale readings reflect pure gravimetric water loss rather than structural tension artifacts. However, once reliable weight telemetry flows from the bench, growers must choose between manual logging and fully automated closed-loop integration. In large commercial cultivation facilities spanning dozens of flowering bays, manually recording scale readings into paper clipboards introduces human recording errors and delays corrective interventions. Modern facility managers increasingly seek ways to interface load cell signals directly into central environmental management computers, enabling automated biofeedback irrigation triggered by physical weight loss.
Can I use cheap digital scales under my pots, or do continuous load cells require specialized transmitters?
Question sent by: Sofia Rossi, via email.
“I want to track continuous hourly transpiration in my grow room. I bought four 50-dollar digital luggage scales and placed them under my index plants. However, the displays freeze after two hours, water splashes corrupted the LCD screens, and the readings drift by 200 grams when the room warms up during lights-on. What hardware do commercial facilities actually use to log continuous plant weight?”
Consumer battery-powered scales are not engineered for the harsh environment of commercial grow rooms: you need sealed IP67 industrial load cells with signal conditioning transmitters.
Commercial cultivation rooms operate under extreme environmental stress: 60% to 75% relative humidity, frequent water splashes, corrosive fertilizer runoff containing mineral salts, and intense thermal cycling (28 °C day to 18 °C night). Consumer scales lack conformal-coated circuit boards, causing moisture to corrode analog traces. Furthermore, un-compensated strain gauges exhibit severe thermal drift: as room temperature rises, thermal expansion of the metal beam changes resistance, producing false weight readings.
The Commercial Hardware Architecture:
- Hermetically Sealed Load Cells: Commercial facilities utilize IP67 or IP68 stainless steel single-point load cells (such as Vishay Celtron or Anyload models) rated for 20 to 50 kg capacity. These units are completely impervious to water immersion and salt corrosion.
- Amplifier and Signal Conditioner: The load cell connects to an industrial signal transmitter (such as a 24VDC HX711 industrial module or dedicated Modbus transmitter). The amplifier filters out mechanical vibration noise, compensates for ambient temperature shifts, and outputs a clean 4-20mA analog current loop or RS-485 digital Modbus RTU signal.
- SCADA / PLC Integration: This digital signal feeds directly into central facility software (Argus, Priva, TrolMaster, or custom Grafana/InfluxDB dashboards). Weight is logged continuously every 30 seconds, generating real-time parabolic transpiration curves and automatically triggering solenoid irrigation valves when weight drops by exact milliliter setpoints.
Sofia’s technical inquiry illustrates the engineering rigor required to establish permanent gravimetric telemetry in high-humidity cultivation rooms. While automated industrial load cells represent the pinnacle of commercial precision, manual spot-checking with a high-quality bench scale provides immense value for standard facilities when paired with a disciplined daily logging protocol. Whether data is captured automatically via RS-485 Modbus or recorded manually into a spreadsheet, comparing daily plant water consumption against established agronomic benchmarks allows growers to evaluate whether crops are transpiring at optimal rates or suffering from physiological stress.
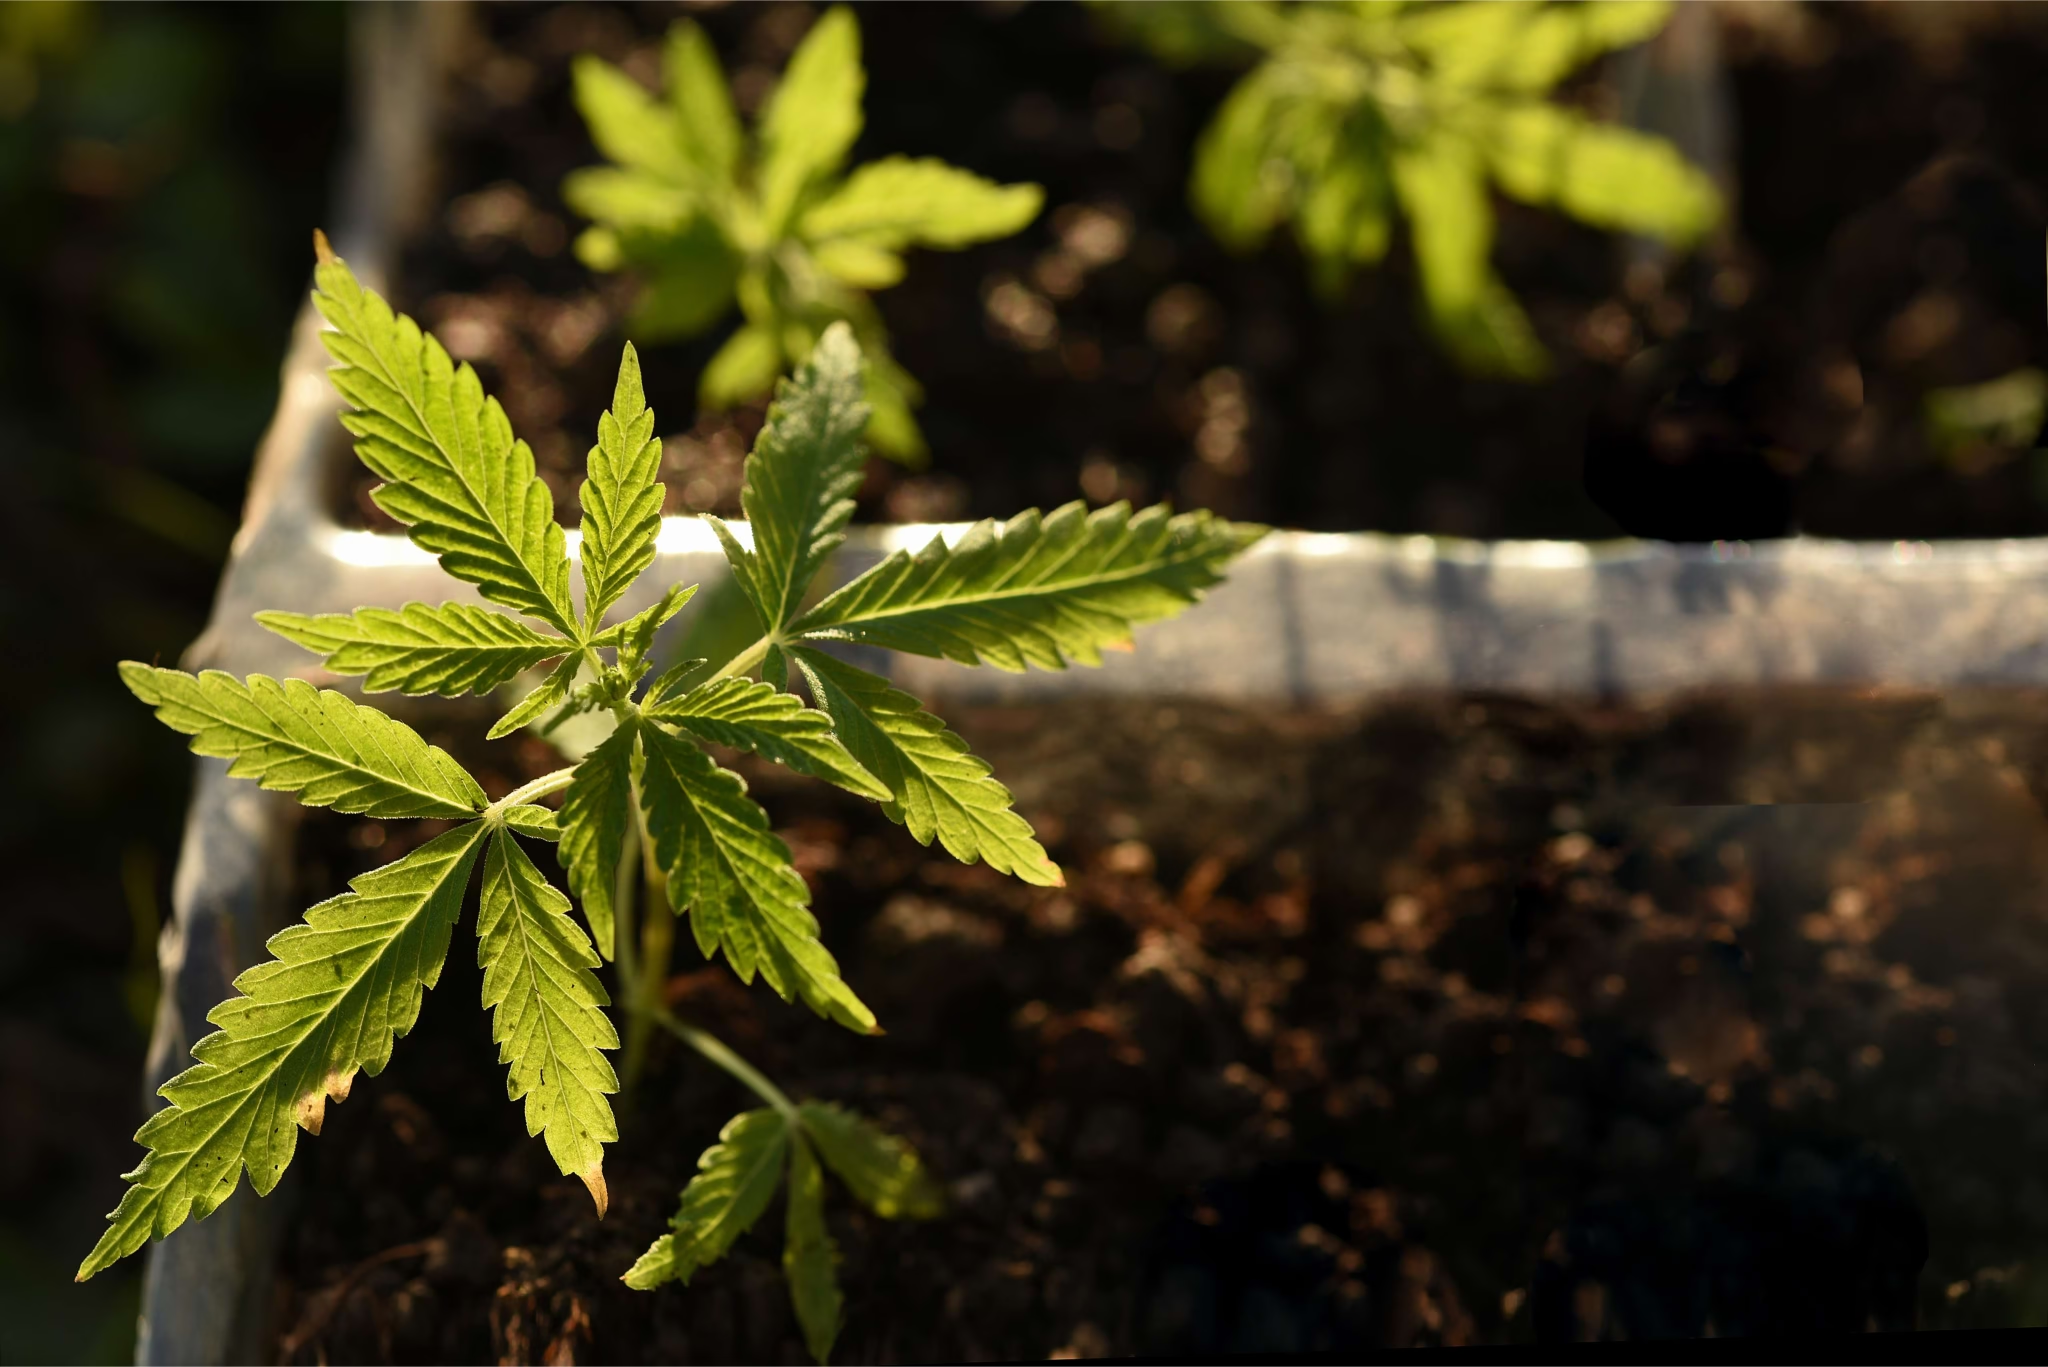
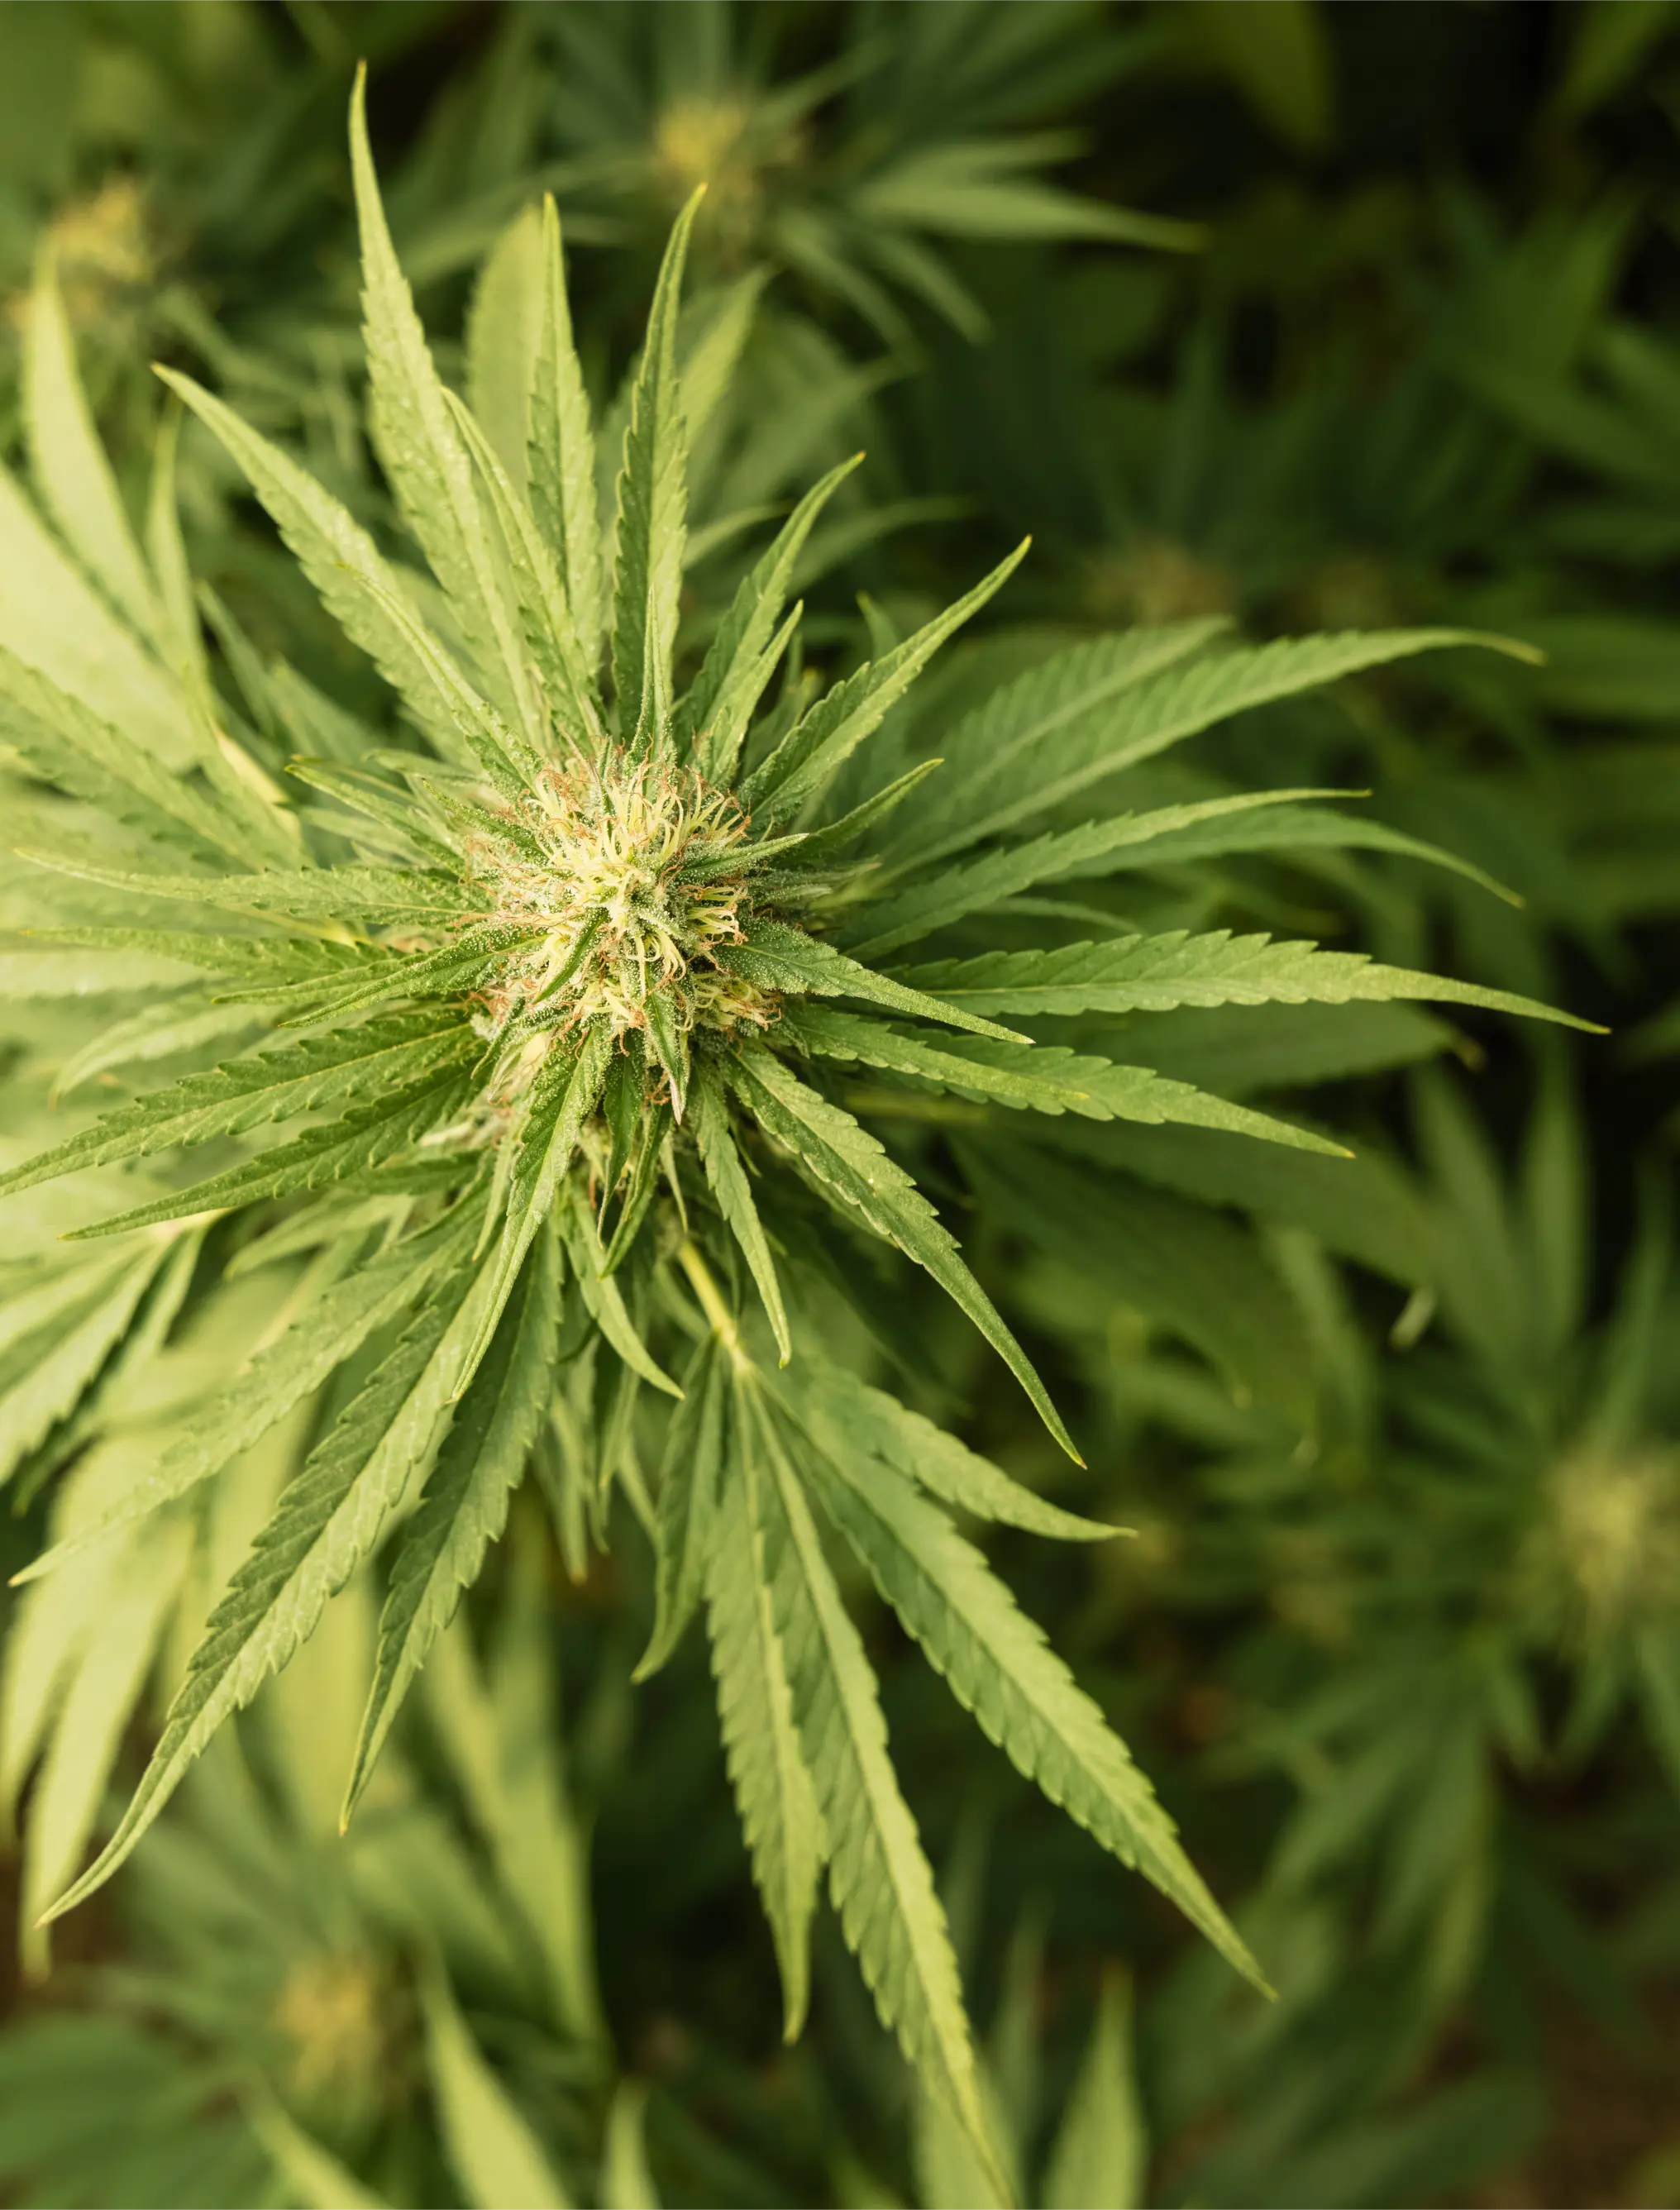
Healthy vegetative cannabis canopy tracked for daily transpiration flux and Water-Use Efficiency (WUE) benchmarking.
Benchmark Water Consumption Across Phenological Growth Stages
Cultivators can compare their logged daily gravimetric data against these verified commercial benchmarks across substrate formats:
- Early Vegetative Stage (1 to 2 Gallon Containers): Plant canopy is small; leaf area index (LAI) is below 1.0. Daily transpiration ranges between 250 and 450 ml per plant per day (15 to 30 ml/hr during photoperiod). Dry-backs should be gradual, requiring irrigation every 2 to 3 days to encourage lateral root exploration throughout the fresh substrate core.
- Late Vegetative / Pre-Flower (2 to 3 Gallon Containers): Rapid leaf expansion; LAI reaches 2.0 to 2.5. Daily water consumption surges to 800 – 1,400 ml per plant per day (65 to 110 ml/hr). Containers require daily irrigation to support rapid cell division, internodal branching, and robust vascular development.
- Peak Flowering Bulking: Weeks 3 to 6 (2 to 5 Gallon Containers): Maximum canopy transpiration under high PPFD (900-1,100 μmol/m2/s) with supplemental CO2. Water uptake peaks at 2,200 to 3,800 ml per plant per day (180 to 300 ml/hr). High-frequency pulse fertigation (3 to 6 shots daily) is required to sustain hydration without waterlogging or triggering premature stomatal closure.
- Late Flower Ripening: Weeks 7 to 9: Transpiration naturally declines as older fan leaves senesce and floral bracts harden. Daily water uptake tapers down to 1,200 – 1,800 ml per plant per day. Implementing controlled deficit irrigation enforces deep overnight dry-backs (20% to 26% mass loss), triggering secondary cannabinoid synthase up-regulation.
| Growth Stage | Typical Container Size | Expected Daily Transpiration (ml/day) | Peak Hourly Transpiration (ml/hr) | Target Overnight Gravimetric Dry-Back % |
|---|---|---|---|---|
| Clones / Seedlings | 0.5 – 1.0 Liter pots | 50 – 120 ml | 5 – 10 ml/hr | 5% – 8% weight drop |
| Early Vegetative | 1 – 2 Gallon pots | 250 – 450 ml | 20 – 35 ml/hr | 8% – 12% weight drop |
| Late Vegetative | 2 – 3 Gallon pots | 800 – 1,400 ml | 65 – 110 ml/hr | 10% – 14% weight drop |
| Weeks 1-3 Flower (Stretch) | 2 – 3 Gallon pots | 1,500 – 2,400 ml | 120 – 190 ml/hr | 12% – 16% weight drop |
| Weeks 4-6 Flower (Bulking) | 2 – 5 Gallon pots | 2,200 – 3,800 ml | 180 – 300 ml/hr | 15% – 20% weight drop |
| Weeks 7-9 Flower (Ripening) | 2 – 5 Gallon pots | 1,200 – 1,800 ml | 100 – 150 ml/hr | 20% – 26% weight drop (Deficit) |
Log Book Management Best Practices: Digital Spreadsheets vs Facility SaaS
To derive commercial value from watering logs, facilities must standardize their record-keeping workflows. Whether utilizing customized cloud spreadsheets (Google Sheets, Microsoft Excel) or commercial cultivation software platforms (Aroya, TrolMaster, Canix, Trym), data entry must be disciplined, consistent, and timestamped. Designating two to three index plants per bench guarantees that logs capture representative canopy behavior without overburdening cultivation technicians with hours of weighing tasks.
Cultivation supervisors should review weekly gravimetric graphs, examining the parabolic slopes of weight depletion. A steepening weight-loss curve indicates expanding root vigor and surging photosynthetic activity, signaling that shot volumes or pulse frequencies should be stepped up. Conversely, a flattening slope warns of physiological stalling: indicating possible root-zone salt accumulation, cold substrate temperatures, or early pathogen infestation. Furthermore, correlating daily water use logs with atmospheric HVAC dehumidifier condensate meters provides facility engineers with a closed-loop mass balance verification, ensuring that room dehumidification capacity precisely matches total canopy transpiration output.
Gravimetric Water Tracking Master Checklist
Audit these critical weighing and logging checkpoints daily:
- Platform scales or strain-gauge load cells are calibrated with certified test weights monthly.
- Index containers are weighed at the exact same photoperiod hours daily (pre-feed floor and post-feed peak).
- Container capacity baseline weight is recalibrated weekly to account for accumulated fresh plant biomass.
- Containers on load cells are mechanically isolated from static walls and rigid wall-mounted trellis netting.
- Daily leachate runoff volume is recorded alongside applied feed volume to calculate exact leaching fractions.
- Leachate runoff EC and pH are tested daily from index pans within 15 minutes of collection.
- Net daily transpiration is calculated in milliliters per plant and compared against phenological benchmarks.
- A sudden 30%+ drop in daily transpiration velocity triggers immediate inspection for root rot or salt buildup.
- Water-Use Efficiency (WUE) is benchmarked across cultivars at harvest (targeting 1.4 to 2.2 g dry flower/L).
- Continuous electronic load cells are IP67-rated with continuous-on displays and thermal drift compensation.
Scientific References
- Hillel, D. (2004). Introduction to Environmental Soil Physics. Academic Press, San Diego, CA.
- Kramer, P. J., & Boyer, J. S. (1995). Water Relations of Plants and Soils. Academic Press, San Diego, CA.
- Taiz, L., Zeiger, E., Møller, I. M., & Murphy, A. (2015). Plant Physiology and Development (6th ed.). Sinauer Associates, Sunderland, MA.
- Zheng, Y. (2021). Handbook of Cannabis Production in Controlled Environments. CRC Press, Boca Raton, FL.
- Nemali, K. S., & van Iersel, M. W. (2006). An automated system for controlling substrate water content and monitoring plant water use. HortScience, 41(1), 282-287.
- Jones, H. G. (2004). Irrigation scheduling: advantages and pitfalls of plant-based methods. Journal of Experimental Botany, 55(407), 2427-2436.
- Allen, R. G., Pereira, L. S., Raes, D., & Smith, M. (1998). Crop evapotranspiration: Guidelines for computing crop water requirements. FAO Irrigation and Drainage Paper 56, Rome.
- Cavins, T. J., Whipker, B. E., Fonteno, W. C., Harden, B., & McCall, I. (2000). PourThru: A guide to monitoring nutritional status in the greenhouse. North Carolina State University Horticultural Information Leaflet, 590.
Share this article
A quick overview of the topics covered in this article.