Can More Light Always Produce More Cannabis?
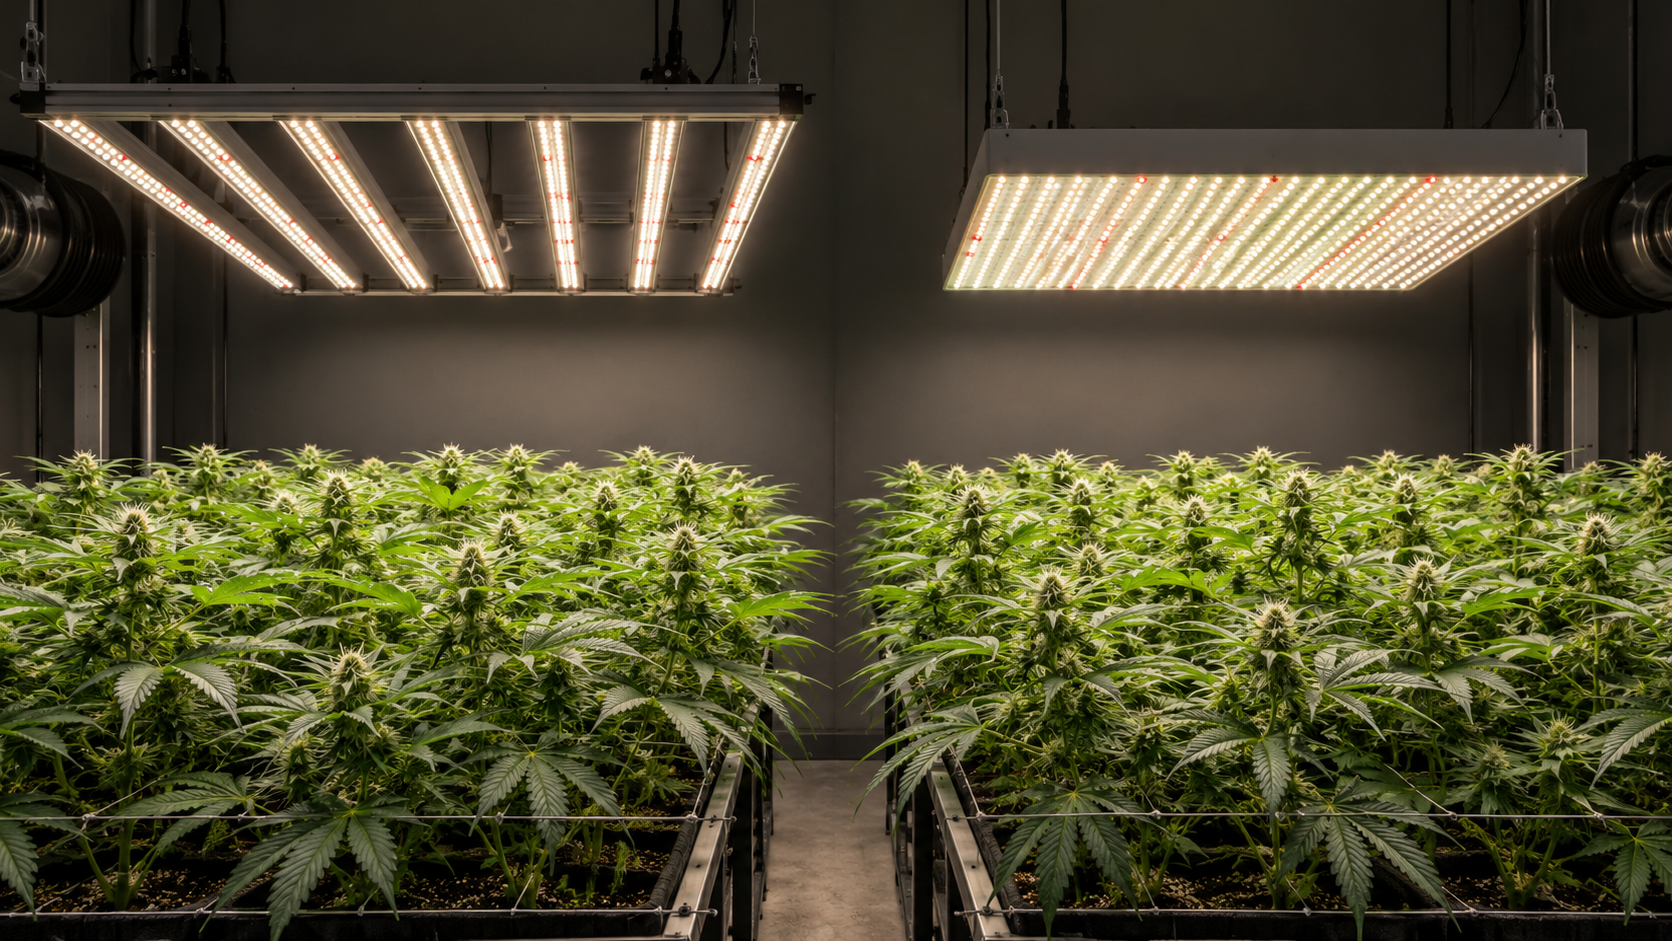
The indoor cannabis industry has long operated under an aggressive cultural assumption: if some light is good, more light must always be better. With the advent of ultra-efficient multi-bar commercial LED arrays capable of delivering photon densities exceeding 1,500 to 2,000 μmol/m²/s, growers possess the hardware capability to blast canopies with unprecedented irradiance. However, plant photobiology is governed by strict physiological saturation plateaus, enzymatic rate limits, and diminishing economic returns. Blasting canopies with excessive light without understanding light saturation curves, photoinhibition, non-photochemical quenching, and atmospheric carbon dynamics wastes thousands of dollars in electrical energy while actively degrading harvest quality.
- Direct Answer: The Diminishing Returns and Biological Ceiling of Light Intensity
- Core Photobiological Mechanisms: Photosystem Saturation, NPQ, and Photoinhibition
- Variables That Shift the Light Ceiling: CO2, Temperature, Root Health, and Genetics
- Step-by-Step PPFD Scaling Framework: Maximizing Grams per Kilowatt-Hour
- Common Cultivation Mistakes: Wattage Vanity, Terpene Loss, and Energy Waste
- How to Verify the Optimal Light Threshold: Chlorophyll Fluorescence and PAR Mapping
- Final Decision Checklist and Companion Weedth Resources
Direct Answer: The Diminishing Returns and Biological Ceiling of Light Intensity
The definitive scientific answer to whether more light always produces more cannabis is an unequivocal no. In plant biology, the relationship between light intensity (measured as Photosynthetic Photon Flux Density, or PPFD) and biomass accumulation is not an infinite straight line; it is a classical non-linear saturation curve known as the Photosynthetic Light Response Curve.
At the base of this curve sits the Light Compensation Point ($LCP$), where photosynthetic carbon fixation balances respiratory carbon loss ($R_d$), occurring between 50 and 100 μmol/m²/s PPFD. As irradiance increases past this threshold, cannabis progresses through three distinct operational phases:
- The Linear Efficiency Phase (100 to 600 μmol/m²/s): Light is the strict rate-limiting factor. Every incremental micromole of photons yields a proportional increase in photosynthetic carbon fixation. Electrical conversion efficiency (grams per kilowatt-hour) is at its peak.
- The Plateau / Diminishing Returns Phase (600 to 1,000 μmol/m²/s in Ambient Air; up to 1,400 μmol/m²/s with CO2): Photosynthetic enzymes (particularly Rubisco) approach maximum catalytic turnover velocity ($V_{cmax}$). In ambient air (~420 PPM CO2), carbon assimilation saturates between 800 and 900 μmol/m²/s PPFD. Additional light past 900 PPFD yields less than 3% to 5% biomass gain for a 30% increase in power. With supplemental CO2 (1,200 to 1,500 PPM) and elevated temperature, the ceiling shifts upward to 1,200 to 1,500 μmol/m²/s.
- The Photoinhibition and Toxicity Phase (> 1,500 μmol/m²/s in Ambient Air; > 1,800 μmol/m²/s with CO2): Incoming photons overwhelm biochemical capacity. Excess energy generates toxic reactive oxygen species (ROS) that destroy chlorophyll pigments, causing photobleaching, necrosis, terpene degradation, and a net decline in floral yield and potency.
Underpinning these three phases is the Farquhar-von Caemmerer-Berry (FvCB) model of C3 photosynthesis, which establishes that net carbon assimilation ($A_{net}$) at any given instant is governed by the minimum of three biochemical rates: Rubisco-limited carboxylation ($W_c$), electron transport-limited RuBP regeneration ($W_j$), and triose phosphate utilization ($W_p$). At low PPFD, electron transport ($W_j$) strictly limits carbon assimilation. As photon flux increases, the system transitions abruptly to a Rubisco carboxylation limit ($W_c$). Under ultra-high light with elevated CO2, triose phosphate utilization ($W_p$) becomes the ultimate ceiling: the plant chloroplasts cannot export fixed triose phosphates into the cytosol to synthesize sucrose quickly enough, resulting in starch accumulation, chloroplastic feedback inhibition, and a complete cessation of light-driven growth gains.
Light Saturation Point ($LSP$) and Grams Per Kilowatt-Hour ($g/kWh$)
The Light Saturation Point ($LSP$) is the photon irradiance level beyond which further increases in PPFD produce no measurable increase in net photosynthetic carbon assimilation ($A_{net}$). Grams Per Kilowatt-Hour ($g/kWh$) measures true energy productivity: total cured dry flower mass harvested divided by total facility electrical power consumed across lighting, HVAC, and dehumidification.
Operating luminaires beyond the light saturation point represents vanity cultivation. While pushing 1,500 PPFD under ambient CO2 might produce a negligible gain in dense top bud mass compared to 900 PPFD, it increases lighting electrical costs by 66%, drives massive HVAC cooling loads, risks bleaching top colas white, and destroys volatile monoterpenes. True master growers optimize for the economic optimum: operating at the peak of the efficiency curve where every kilowatt-hour delivers maximum commercial profit.
Fundamental Economic Law of Lighting: Photobiology obeys the law of diminishing returns. Doubling light intensity from 500 to 1,000 PPFD can increase yield by 60% to 80%; pushing from 1,000 to 1,500 PPFD without supplemental CO2 increases yield by less than 5% while inflating power bills by 50%.
Core Photobiological Mechanisms: Photosystem Saturation, NPQ, and Photoinhibition
To understand why excess light becomes destructive, cultivators must inspect the sub-cellular photochemical processes occurring within the thylakoid membranes of chloroplasts. Photosynthesis begins when photons strike light-harvesting antenna complexes, funneling excitation energy into the specialized chlorophyll pair P680 located within Photosystem II (PSII).
The Plastoquinone Bottleneck and Non-Photochemical Quenching (NPQ)
Under balanced light levels, excited electrons from P680 travel down an electron transport chain via plastoquinone (PQ), cytochrome b6f, and plastocyanin to Photosystem I (PSI), generating the proton motive force required by ATP synthase to produce ATP and NADPH. However, the diffusion of plastoquinone through the lipid thylakoid membrane is a rate-limited physical process (taking approximately 1 to 2 milliseconds per turnover).
When incident photon flux exceeds the processing capacity of the Calvin cycle, the plastoquinone pool becomes completely over-reduced. Electrons back up along the transport chain. To protect itself from catastrophic cellular destruction, the plant engages Non-Photochemical Quenching (NPQ): a photoprotective safety valve mediated by the xanthophyll cycle. The enzyme violaxanthin de-epoxidase converts the carotenoid violaxanthin into antheraxanthin and zeaxanthin. Zeaxanthin directly dissipates excess excitation energy safely as metabolic heat. Under ultra-high PPFD, up to 75% of absorbed photons are dissipated as waste heat via NPQ, rendering the additional light biologically useless for floral growth.
Cyclic Electron Flow and Thylakoid Acidification
When high light saturates the Calvin cycle, the terminal electron acceptor NADP+ becomes depleted. Chloroplasts divert electrons into Cyclic Electron Flow (CEF) around Photosystem I via PGR5/PGRL1 and NDH complexes, bypassing Photosystem II. While cyclic flow generates ATP and drives luminal pH down toward 5.2 to activate protective PsbS proteins, prolonged over-acidification impairs the Oxygen-Evolving Complex (OEC) and dismantles the catalytic manganese cluster ($Mn_4CaO_5$), permanently crippling water-splitting capability.
Photoinhibition and D1 Protein Destruction
When light intensity is pushed beyond the capacity of NPQ thermal dissipation and cyclic electron sinks, excited singlet chlorophyll ($^1Chl^*$) transitions via intersystem crossing into high-energy triplet state chlorophyll ($^3Chl^*$). Triplet chlorophyll reacts directly with ground-state oxygen ($O_2$), generating singlet oxygen ($^1O_2$): an extraordinarily reactive toxic radical.
Singlet oxygen and hydroxyl radicals attack and oxidize the core reaction center protein of Photosystem II, known as the D1 protein (PsbA). While plants possess an internal enzymatic repair cycle to excise damaged D1 proteins and synthesize fresh replacements, the rate of D1 photodamage outpaces the repair cycle under extreme irradiance. This state is known as chronic photoinhibition. Photosystem II centers shut down, electron flow stops, and photobleaching turns green chlorophyll molecules into inert white tissue.
The Enzymatic D1 Repair Cycle and Photodamage Kinetics
The physiological cost of photoinhibition is largely defined by the high metabolic expense of the Photosystem II repair cycle. When the D1 reaction center polypeptide is oxidized by singlet oxygen, the entire PSII core complex must undergo partial disassembly. Damaged PSII supercomplexes migrate from the tightly stacked appressed grana thylakoid membranes to the non-appressed stroma thylakoids. There, membrane-bound ATP-dependent FtsH metalloproteases and lumenal Deg proteases rapidly degrade and clear the damaged D1 fragments.
Simultaneously, chloroplast 70S ribosomes synthesize de novo copies of the PsbA gene product (the precursor D1 protein). The newly synthesized peptide is inserted into the membrane, post-translationally processed, assembled with Photosystem II core proteins (CP43, CP47, and D2), and re-ligated with the manganese cluster ($Mn_4CaO_5$) before migrating back into the grana stacks. This continuous enzymatic repair demands substantial cellular ATP and metabolic carbon. When incident PPFD exceeds 1,400 μmol/m²/s, the rate of D1 degradation exceeds the maximal translation capacity of chloroplast ribosomes. The pool of active Photosystem II reaction centers declines precipitously, locking the canopy into chronic photoinhibition.
Singlet Oxygen and Membrane Lipid Peroxidation
Beyond destroying the D1 protein core, unchecked singlet oxygen triggers lipid peroxidation across the polyunsaturated thylakoid lipid bilayer (specifically alpha-linolenic acid). This produces toxic malondialdehyde (MDA) and causes thylakoid swelling, membrane leakage, and irreversible solar leaf scorch, permanently lowering photosynthetic assimilation in affected upper foliage.
Variables That Shift the Light Ceiling: CO2, Temperature, Root Health, and Genetics
The exact light saturation point of cannabis is not a fixed universal number; it shifts dynamically based on four interconnected environmental and genetic variables, governed by Liebig’s Law of the Minimum.
Carbon Dioxide: The Primary Rate Bottleneck
In standard atmospheric air (~420 PPM CO2), Rubisco enzymes are severely carbon-limited and oxygenase photorespiration squanders roughly 25% of photochemical energy. Ambient light saturation occurs at 800 to 900 μmol/m²/s PPFD. Enriching the atmosphere to 1,200 to 1,500 PPM CO2 suppresses photorespiration and elevates the saturation ceiling to 1,300 to 1,500 μmol/m²/s PPFD.
Temperature Kinetics and Enzymatic Velocity
Photosynthesis pairs light-dependent photochemical reactions with temperature-dependent Calvin cycle enzymatic reactions. Running high PPFD in cold rooms (72°F to 74°F) leaves enzymes sluggish, causing electron backup and photoinhibition. Supporting 1,100+ PPFD requires elevating daytime temperatures to 82°F to 85°F (27.8°C to 29.4°C) to match enzymatic velocity with photon arrival.
Root Zone Hydraulic Conductance and Mineral Mass Flow
Under 1,200 PPFD, a mature canopy transpires 1.2 to 2.0 gallons of water per square meter daily. This water must be drawn rapidly through root aquaporin channels. If roots are cold (< 65°F), waterlogged, or diseased with Pythium, hydraulic conductance collapses. Stomata close to prevent leaf desiccation, internal CO2 drops to zero, and incoming photons instantly cause photobleaching. High-PPFD growing demands warm, highly aerated root zones with tuned irrigation shots.
Vapor Pressure Deficit (VPD) and Boundary Layer Conductance
Because commercial LED luminaires emit negligible infrared radiation compared to legacy HPS fixtures, leaf surface temperatures under LEDs frequently run 2°F to 4°F cooler than the surrounding room air. This altered radiant heat balance fundamentally shifts canopy Vapor Pressure Deficit (VPD). At a constant room air temperature of 78°F and 60% relative humidity, an HPS leaf warmed by infrared radiation might sit at 81°F (experiencing a leaf VPD of 1.4 kPa), while an LED leaf sits at 75°F (experiencing a leaf VPD of only 0.95 kPa).
At 0.95 kPa, transpirational suction through the xylem is sluggish, restricting the mass flow of essential divalent cations like calcium ($Ca^{2+}$) to rapidly expanding apical meristems. When growers ramp LED intensity to 1,200+ PPFD under low leaf VPD, the rapid expansion of cell walls outpaces calcium supply, causing marginal leaf tip necrosis and weak vascular structure. To sustain high-PPFD LED regimes, cultivators must maintain Leaf VPD between 1.2 and 1.4 kPa by elevating room air temperature to 82°F-85°F and ensuring vigorous horizontal canopy airflow (0.3 to 0.5 m/s) to strip the stagnant boundary layer from leaf surfaces.
Canopy Architecture and Cultivar Phenotype Differences
Broad-leaf indica-dominant cultivars develop wide, overlapping fan leaves that intercept up to 90% of photons in the top 6 inches, saturating top leaves at 850 to 1,000 PPFD. Narrow-leaf sativa-dominant cultivars have slender leaflets with lower extinction coefficients, allowing photons to penetrate deeply into lower tiers. Whole-canopy saturation on narrow-leaf cultivars reaches 1,300 to 1,450 PPFD under CO2 enrichment without photo-damage.
| PPFD Band (μmol/m²/s) | Required CO2 Level (PPM) | Optimal Air Temp (°F / °C) | Relative Grams/Watt Efficiency | Biological Status & Risk Profile |
|---|---|---|---|---|
| 400 – 600 | 400 – 450 (Ambient) | 76°F – 78°F (24.4 – 25.5°C) | Maximum (2.2 – 2.8 g/W) | Linear growth; light is limiting; zero photoinhibition risk |
| 700 – 900 | 450 – 600 | 78°F – 82°F (25.5 – 27.8°C) | High (1.9 – 2.4 g/W) | Approaching ambient saturation; peak economic return for vented rooms |
| 1,000 – 1,300 | 1,100 – 1,400 (Enriched) | 82°F – 85°F (27.8 – 29.4°C) | Moderate (1.7 – 2.1 g/W) | Commercial high-yield band; mandatory CO2 and tuned Leaf VPD |
| 1,400 – 1,700 | 1,400 – 1,600 (Enriched) | 83°F – 86°F (28.3 – 30.0°C) | Diminishing (1.3 – 1.6 g/W) | Absolute biological ceiling; severe risk of bleaching and terpene loss |
| 1,800+ | 1,500+ | 84°F – 86°F (28.9 – 30.0°C) | Negative / Wasteful (< 1.1 g/W) | Severe chronic photoinhibition; D1 damage; foxtailing and tip burn |
Step-by-Step PPFD Scaling Framework: Maximizing Grams per Kilowatt-Hour
To achieve commercial success without crossing into photoinhibition, cultivators must follow a disciplined, stage-by-stage lighting progression governed by Daily Light Integral (DLI).
The Daily Light Integral (DLI) Metric
Plants do not experience light simply as an instantaneous intensity (PPFD); they respond to the cumulative number of photons delivered over the entire 24-hour day, defined as Daily Light Integral (DLI), measured in moles per square meter per day ($mol/m^2/d$): $$\text{DLI} = \text{PPFD} \times \text{Photoperiod Hours} \times 0.0036$$
Under an 18-hour vegetative photoperiod, 600 PPFD delivers an optimal DLI of $38.9\text{ mol/m}^2/d$. Under a 12-hour flowering photoperiod, delivering that same $39\text{ mol/m}^2/d$ requires increasing PPFD to 900 μmol/m²/s. Pushing 1,300 PPFD in a 12-hour flowering room delivers a massive DLI of $56.2\text{ mol/m}^2/d$: approaching the upper biological limit of the species.
Autoflower Light Schedules: Photoperiod vs PPFD Trade-Offs
Autoflowering cannabis cultivars possess genetic day-neutrality inherited from Cannabis ruderalis, allowing them to initiate and complete flowering regardless of daily photoperiod duration. This unique physiology grants cultivators unprecedented flexibility in managing Daily Light Integral (DLI). An autoflower grower aiming for a target flowering DLI of $45\text{ mol/m}^2/d$ can deliver this energy across multiple photoperiod regimes: running 1,040 PPFD under a 12-hour photoperiod, 780 PPFD under an 18-hour photoperiod, 695 PPFD under a 20-hour photoperiod, or 520 PPFD under a continuous 24-hour photoperiod.
From a photobiological perspective, spreading the target photon dose over longer photoperiods (such as 18/6 or 20/4 at 700 to 800 PPFD) operates the plant photosynthetic machinery in its linear, highly efficient photochemical zone. Conversely, attempting to deliver the entire DLI in 12 hours forces the grower to blast 1,050+ PPFD, pushing photosystems near the saturation plateau where quantum efficiency drops and NPQ heat dissipation rises. Operating autoflowers at moderate PPFD over an 18- to 20-hour schedule maximizes grams per kilowatt-hour, reduces equipment thermal stress, and eliminates photoinhibition risks.
Horizontal PPFD Uniformity vs Vertical Hotspots
Modern multi-bar LED fixtures spread photon emission across eight to ten parallel diode strips, achieving uniformity ratios of 1.15:1 to 1.25:1 across the canopy footprint. Delivering a uniform, distributed 950 PPFD across all plant tips produces far greater total dry harvest weight, uniform bud sizing, and higher commercial value than blasting 1,500 PPFD into an isolated center hot-spot while leaving outer plants starved for photons.
Stage-by-Stage Lighting Ramp SOP
- Nursery / Early Veg (Weeks 1 – 2): Deliver 250 to 400 μmol/m²/s PPFD (DLI 16 to 26 mol/m²/d). Supports delicate juvenile root development without transpirational stress.
- Late Veg & Pre-Bloom (Weeks 3 – 5): Ramp to 550 to 750 μmol/m²/s PPFD (DLI 35 to 48 mol/m²/d). Builds thick stems, tight internodes, and robust root mass.
- Early Bloom Transition (Weeks 1 – 3 of 12/12): Increase to 750 to 950 μmol/m²/s PPFD (DLI 32 to 41 mol/m²/d). Prevents excessive stretching while floral primordia establish.
- Peak Floral Bulking (Weeks 4 – 7 of 12/12): Operate luminaires at 1,000 to 1,300 μmol/m²/s PPFD (DLI 43 to 56 mol/m²/d) in sealed rooms with 1,200 to 1,400 PPM CO2, 83°F air temperature, and 1.3 kPa Leaf VPD.
- Late Ripening & Senescence (Final 14 Days): Taper light levels back down to 650 to 800 μmol/m²/s PPFD (DLI 28 to 35 mol/m²/d). Lower temperatures to 72°F-75°F and shut off CO2. Tapering protects delicate volatile terpenes from evaporating and encourages rich autumn coloration.
| Growth Phase | Photoperiod | Optimal PPFD (μmol/m²/s) | Target DLI (mol/m²/d) | Environmental Pairing |
|---|---|---|---|---|
| Clones & Seedlings | 18 – 24 hrs | 150 – 250 | 10 – 16 | Ambient CO2, 75°F, 0.8 kPa VPD |
| Early Vegetative | 18 hrs | 300 – 450 | 19 – 29 | Ambient CO2, 77°F, 1.0 kPa VPD |
| Late Vegetative | 18 hrs | 550 – 700 | 35 – 45 | Ambient or 800 PPM CO2, 80°F, 1.1 kPa VPD |
| Early Bloom (Stretch) | 12 hrs | 750 – 900 | 32 – 39 | 800 – 1,000 PPM CO2, 81°F, 1.2 kPa VPD |
| Peak Bloom (Bulking) | 12 hrs | 1,000 – 1,300 | 43 – 56 | 1,200 – 1,500 PPM CO2, 83°F – 85°F, 1.3 – 1.4 kPa |
| Late Ripening (Flush) | 12 hrs | 650 – 750 | 28 – 32 | Ambient CO2, 70°F – 74°F, 1.1 kPa VPD |
Common Cultivation Mistakes: Wattage Vanity, Terpene Loss, and Energy Waste
Operating luminaires at extreme intensity without biological justification introduces serious operational and economic penalties.
Mistake 1: Wattage Vanity and Electrical Inefficiency
Running 1,500 PPFD in rooms without supplemental CO2 or in unsealed facilities with continuous exhaust ventilation wastes massive quantities of electricity. Fixtures draw maximum power, air conditioners work overtime to extract heat, and the crop sits in chronic light saturation, yielding the exact same dry biomass as a facility running 900 PPFD at half the electrical cost.
Mistake 2: Thermal Volatilization of Monoterpenes
Extreme light intensity directly heats outer floral clusters and glandular trichomes to 85°F or higher. Volatile monoterpenes (beta-myrcene, alpha-pinene, limonene) boil off rapidly into the room air, producing flat, terpene-depleted flower. Tapering light during the final 14 days preserves aromatic potency.
Mistake 3: Misdiagnosing Photo-Oxidation as Nutrient Deficiencies
When intense light bleaches upper sun leaves, novice growers often mistake it for nitrogen or iron deficiency and feed excessive cal-mag or nitrogen. However, mobile nitrogen deficiency starts on lower leaves, and iron deficiency leaves veins green. Light bleaching occurs strictly on the highest foliage under the fixture, turning both veins and blade pale yellow. Adding fertilizer to light-stressed plants causes salt burn and osmotic shock.
Mistake 4: Heat-Induced Second-Flush Foxtailing
Sustaining excessive PPFD into late flowering (Weeks 7 to 9) forces buds to shoot emergency towers of airy calyxes and white pistils out of finished buds. These stress foxtails ruin commercial bag appeal, dilute cannabinoid concentration, and cause uneven drying. Dimming lights late in bloom stops foxtailing completely.
The 1,450 PPFD Trap: How Dialing Down Lights Increased Harvest Value by \$45,000
A licensed commercial facility in Denver, Colorado, retrofitted a 60-light flower room with high-output 800W multi-bar LED fixtures delivering 1,450 μmol/m²/s PPFD across rolling tables. The room was ventilated with outside air exchanges and operated at ambient CO2 (430 PPM). The grower ran fixtures at 100% power throughout the entire 9-week flowering cycle.
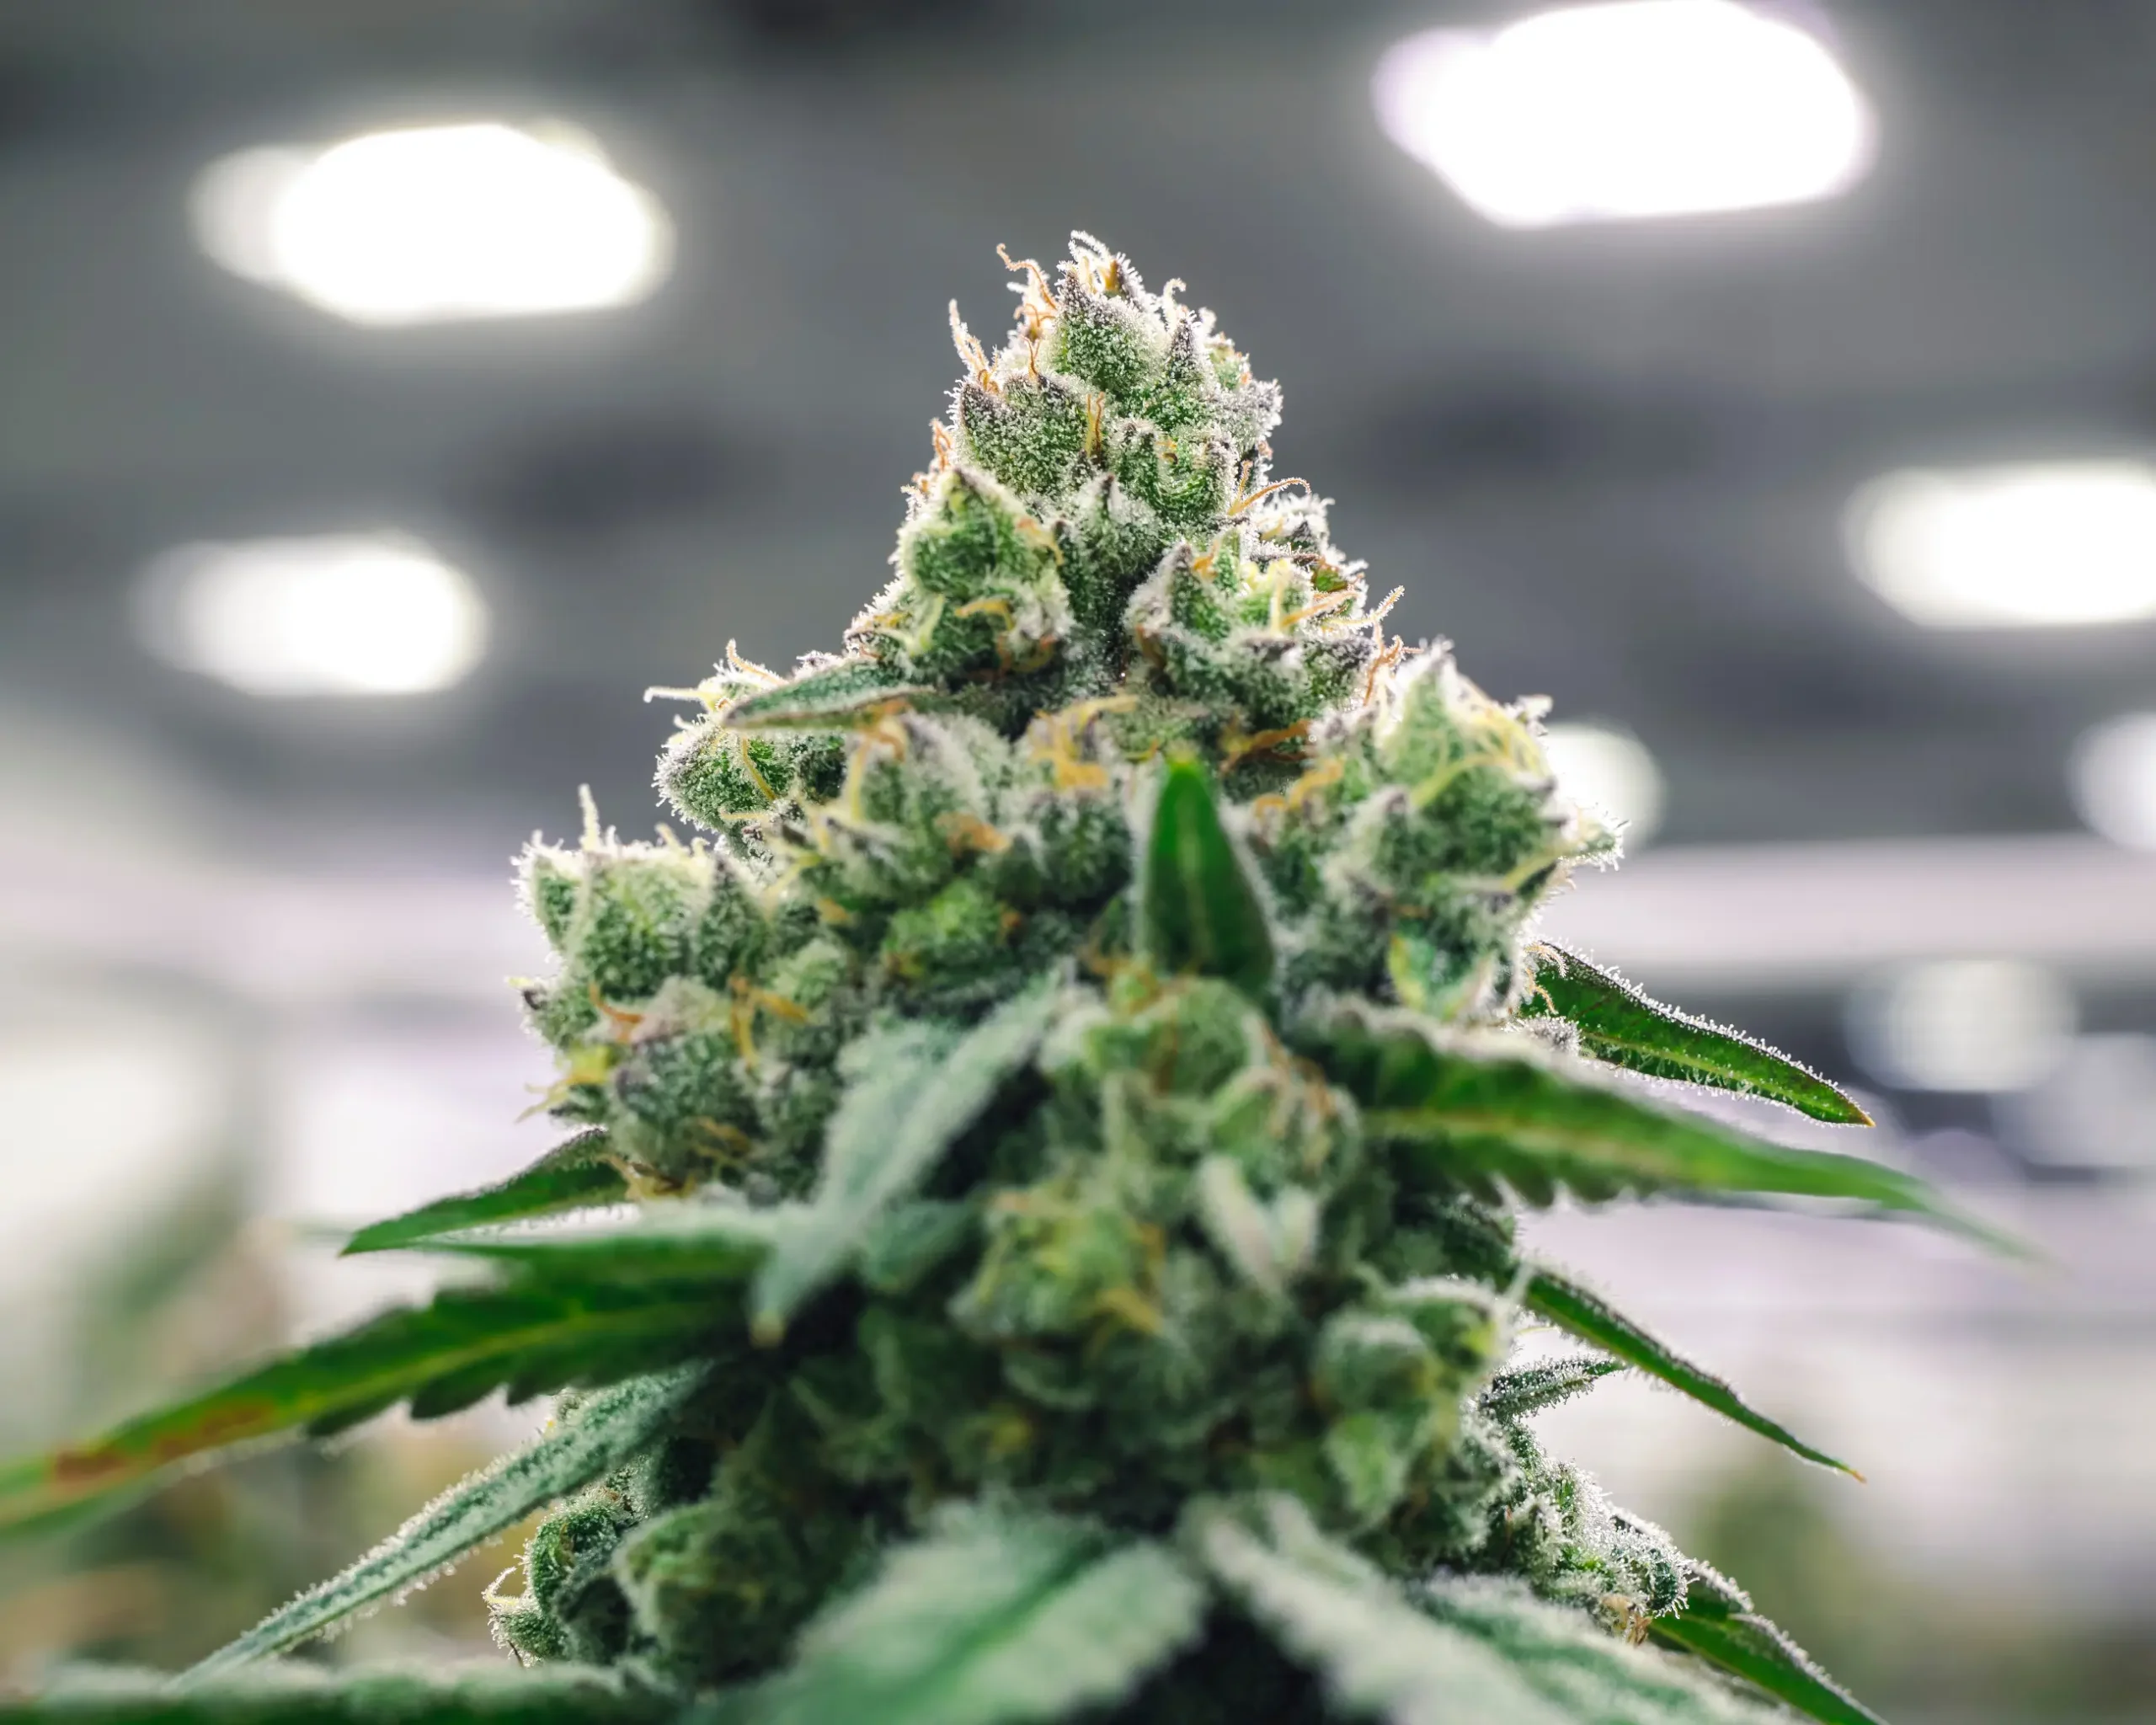
The result: Harvest results were deeply disappointing. The top 6 inches of every main cola were bleached ghostly white (lacking all chlorophyll), buds exhibited stringy foxtailing towers, total terpene content tested at a dismal 1.1%, and electrical efficiency plummeted to 1.15 grams per watt. The bleached tops had to be heavily trimmed off and downgraded to discount extraction trim.
The turnaround: In the subsequent cycle, we installed digital fixture controllers to implement our precision ramp framework. Maximum peak bloom PPFD was capped at 950 μmol/m²/s (dimming fixtures to roughly 65% power), and lights were tapered to 700 PPFD during the final 12 days. The results were dramatic: bleached crowns vanished completely, floral density tightened, total cured yield increased by 14%, terpene content surged to 2.45% (more than doubling aroma), and facility electrical efficiency jumped to 1.95 grams per watt, saving thousands in monthly electricity while increasing wholesale flower revenue by \$45,000.
When evaluating commercial cultivation economics, facility managers must calculate the Marginal Return on Lighting Energy ($MRLE$). Profit is maximized where marginal revenue from an additional gram of flower equals the marginal cost of the kilowatt-hours needed to produce it. Above 900 PPFD in ambient CO2, the electrical cost per incremental pound of flower exceeds \$350, wiping out operating profit.
Furthermore, uniform photon distribution across all canopy tiers beats extreme overhead hot-spots. Multi-bar LEDs mounted closer to trellises or supplemented with inter-canopy lighting deliver 700 to 900 PPFD across all flower tiers, activating secondary bud sites and increasing marketable “A-grade” yield without burning top crowns.
Do
Cap Irradiance at 950 PPFD in Ambient CO2 Rooms
Operate at the peak of the photosynthetic efficiency curve in ventilated rooms to capture maximum grams per watt without photoinhibition.
Avoid
Blast 1,400+ PPFD into Cold, Low-CO2 Rooms
Never run extreme light without matching 1,200+ PPM CO2, 83°F air temperatures, and robust root health; excess photons cause severe photobleaching.
How to Verify the Optimal Light Threshold: Chlorophyll Fluorescence and PAR Mapping
To empirically determine the exact light saturation threshold of your cultivars without causing permanent crop damage, commercial agronomists employ precision diagnostic testing.
Chlorophyll a Fluorescence ($F_v/F_m$ Testing)
The definitive scientific tool for diagnosing photoinhibition before visual symptoms emerge is Pulse-Amplitude-Modulated (PAM) chlorophyll fluorometry. A PAM fluorometer attaches a dark-adaptation clip to an upper sun leaf for 20 minutes, then pulses a saturating actinic light flash to measure minimum fluorescence ($F_0$) and maximum fluorescence ($F_m$).
The ratio of variable fluorescence to maximum fluorescence ($F_v/F_m = [F_m – F_0] / F_m$) represents the maximum photochemical quantum efficiency of Photosystem II:
- $F_v/F_m = 0.80\text{ to } 0.83$: Pristine photosynthetic health; light reactions operate at peak photochemical turnover without photoinhibition.
- $F_v/F_m = 0.75\text{ to } 0.79$: Mild reversible photoinhibition; non-photochemical quenching actively dissipates excess photons.
- $F_v/F_m < 0.72$: Severe chronic photoinhibition; D1 proteins are actively dismantling; light exceeds crop capacity.
Thermal Imaging and Leaf-to-Air Temperature Differential
Radiometric infrared cameras and spot thermometers reveal transpirational cooling status. In balanced rooms with open stomata, leaf surface temperature ($T_{leaf}$) is slightly cooler than air ($T_{air}$), giving a negative differential: $$\Delta T = T_{leaf} – T_{air} = -1.5^\circ\text{F to } -3.5^\circ\text{F } (-0.8^\circ\text{C to } -1.9^\circ\text{C})$$
If upper leaves show positive $\Delta T$ ($T_{leaf} > T_{air}$ by +2.0°F or more), stomata have closed under radiation overload. Dim fixtures immediately to prevent cellular scorch.
Grid-Based Quantum PAR Mapping
Map canopy photon distribution using an apogee quantum sensor on a 12-inch grid. Calculate the uniformity ratio; if the center reads 1,350 PPFD while edges receive 600 PPFD, lower fixture dimmers to 950 PPFD center and optimize hanging height to elevate edges. A uniform canopy consistently outperforms a peaked canopy.
Is there any benefit to running 2,000 PPFD if I have unlimited CO2 and freezing AC?
Question sent by: Tyler Vance, via email.
No. Even with 1,800 PPM CO2 and industrial cooling, cannabis photosynthetic carbon fixation saturates completely around 1,500 to 1,600 μmol/m²/s PPFD. Pushing 2,000 PPFD provides zero additional biomass gain because biochemical electron transport (RuBP regeneration) becomes physically rate-limiting. Furthermore, 2,000 PPFD generates extreme localized radiative heating on trichome resin heads, degrading delicate monoterpenes and converting THC into CBN, degrading the commercial value of the finished harvest.
Final Decision Checklist and Companion Weedth Resources
Before increasing fixture dimmers or upgrading your facility lighting arrays, verify your crop parameters against this operational checklist:
High-PPFD Photobiology Optimization Checklist
- Cap canopy PPFD between 800 and 950 μmol/m²/s in ventilated facilities operating at ambient 420 PPM CO2.
- Enrich atmosphere to 1,200-1,400 PPM CO2 before attempting to push light levels beyond 1,000 μmol/m²/s.
- Elevate daytime room air temperature to 82°F-85°F (28°C-29.5°C) under LEDs to support Calvin cycle enzyme kinetics.
- Maintain Leaf VPD strictly between 1.2 and 1.4 kPa to drive transpirational cooling under high photon flux.
- Track Daily Light Integral (DLI); target 35-45 mol/m²/d in veg and 42-52 mol/m²/d during peak floral bulking.
- Taper light intensity back to 650-800 PPFD during the final 14 days of flowering to preserve volatile monoterpenes.
- Monitor upper canopy sun leaves for early photobleaching (yellowing between veins with green lower leaves).
- Audit facility electrical productivity; optimize for maximum grams per kilowatt-hour rather than raw wattage vanity.
Answering whether more light always produces more cannabis transforms indoor cultivation from reckless energy consumption into sophisticated biological engineering. By synchronizing photon delivery with photosynthetic saturation limits and environmental demand, commercial cultivators achieve record-breaking yields, elite terpene purity, and maximum facility profitability.
Final Verdict: Photons are fuel, but the engine has a redline. Tune the entire vehicle: carbon, temperature, water, and root health: and operate at the biological sweet spot to harvest championship quality with industrial efficiency.
To expand your technical cultivation foundation with our companion foundational guides, continue exploring Weedth resources below.
Share this article
A quick overview of the topics covered in this article.
Follow us
Latest articles
October 29, 2026

October 29, 2026