Light Intensity, Yield, and Cannabinoid Concentration
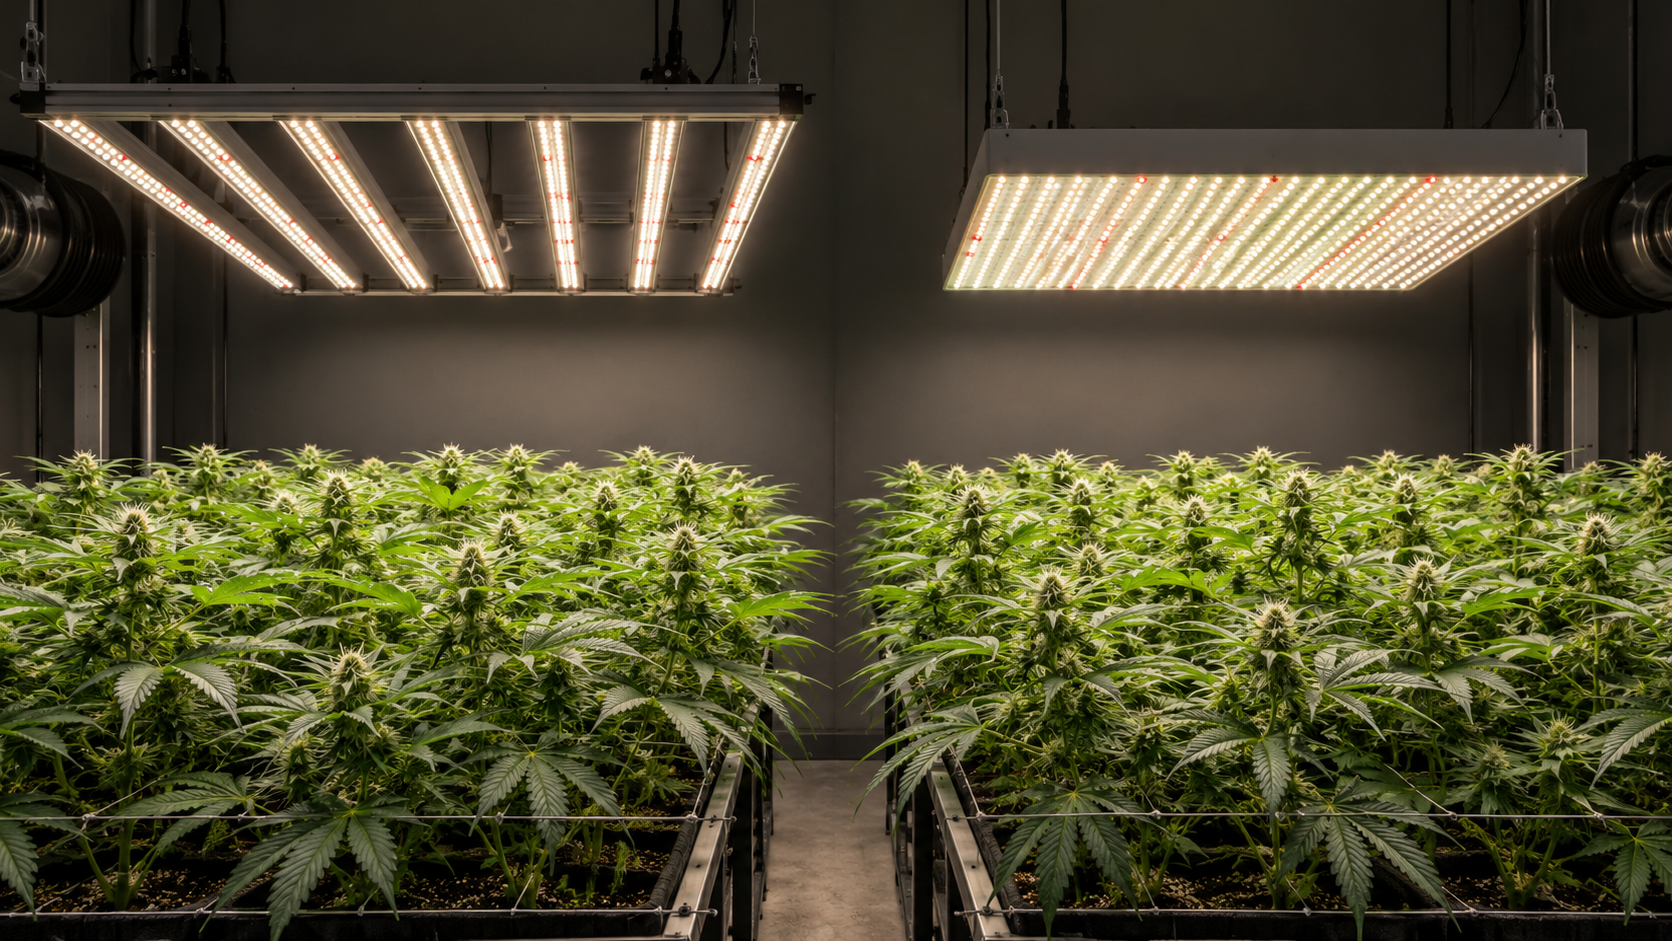
One of the most fiercely debated questions in modern commercial cannabis agronomy centers on the direct relationship between light intensity and finished flower potency. Cultivators often operate under the assumption that blasting crops with maximum Photosynthetic Photon Flux Density (PPFD) will automatically elevate both dry harvest weight and cannabinoid concentration in lockstep. However, plant photobiology and secondary metabolic chemistry operate under distinct physiological regulatory mechanisms. While floral biomass accumulation responds directly to daily photosynthetic carbon fixation, cannabinoid biosynthesis and glandular trichome development follow specialized biochemical pathways governed by genetic limits, enzymatic ceilings, and environmental stress dynamics. Navigating the delicate divergence between yield volume and percentage potency is essential for optimizing commercial canopy profitability.
- Direct Answer: The Divergence Between Biomass Yield and Cannabinoid Concentration
- Cannabinoid Biosynthesis: How Light Drives Glandular Trichome Development
- Environmental Interactions: Balancing Photons, Heat, and Terpene Volatilization
- Step-by-Step PPFD Optimization: Staging Light for Maximum Potency and Yield
- Cultivation Pitfalls: Photo-Degradation, Premature Ambering, and Trichome Rupture
- Verification Protocols: High-Performance Liquid Chromatography (HPLC) and Microscopy
- Final Decision Checklist and Companion Weedth Resources
Direct Answer: The Divergence Between Biomass Yield and Cannabinoid Concentration
The relationship between light intensity, dry flower yield, and cannabinoid concentration is characterized by a fundamental biological divergence: increasing PPFD substantially expands total dry floral biomass ($g/m^2$), but has a significantly more modest, plateauing impact on percentage cannabinoid concentration (% dry weight).
To evaluate commercial harvest results accurately, agronomists separate crop productivity into three distinct metrics:
- Floral Biomass Yield ($g/m^2$ or lbs/light): The total dry weight of trimmed, marketable flower tissue harvested per unit canopy area. Biomass scales almost linearly with photon delivery up to 600-800 μmol/m²/s in ambient air, and up to 1,200-1,400 μmol/m²/s under carbon dioxide enrichment.
- Cannabinoid Concentration (% THCA, % CBDA, % CBGA): The proportion of secondary active compounds relative to total dry flower mass. Cannabinoid concentration rises modestly as PPFD increases from 300 to 700 μmol/m²/s, but typically plateaus between 750 and 900 μmol/m²/s PPFD. Pushing light past 1,000 μmol/m²/s rarely increases percentage potency; in fact, under excessive heat or photon stress, cannabinoid percentages can slightly decline due to floral biomass “dilution” or thermal degradation.
- Total Cannabinoid Yield ($g/m^2$ of active cannabinoids): The mathematical product of floral biomass multiplied by cannabinoid percentage: $$\text{Total Active Yield} = \text{Biomass } (g/m^2) \times \text{Potency } (\%)$$ Because biomass continues to increase even after percentage potency plateaus, total active cannabinoid production per square meter peaks at higher irradiance levels (1,100 to 1,300 μmol/m²/s with CO2 enrichment).
This divergence is driven by what plant physiologists define as the Biomass Dilution Effect. Under intense photon bombardment (1,200+ PPFD) combined with CO2 enrichment, Calvin cycle carbon fixation operates at maximum velocity. The plant produces vast quantities of structural carbohydrates, hemicellulose, and lignin, driving rapid expansion of calyx cell walls and supporting bract tissue. However, because the rate of glandular trichome initiation and the catalytic turnover velocity of secondary enzymes ($V_{max}$) are genetically bounded, the rapid expansion of vegetative calyx mass outpaces resin volume. Consequently, dried flower samples show a higher dry mass denominator relative to total cannabinoid numerator, leading to flat or slightly diluted potency percentages despite exceptional bud density.
Cannabinoid Concentration vs Total Cannabinoid Yield
Cannabinoid Concentration represents the relative potency percentage of target active compounds (such as tetrahydrocannabinolic acid, THCA) within dried floral tissue. Total Cannabinoid Yield represents the absolute mass of pure cannabinoids produced per square meter of cultivation space ($g/m^2$). While percentage concentration saturates at moderate PPFD, total active mass continues to increase as long as net floral biomass expands.
For retail flower producers selling dried buds on dispensary shelves, percentage concentration and terpene profile dictate wholesale grading and pricing tier. For commercial oil extractors, processors, and pharmaceutical manufacturers, total active cannabinoid yield per square meter is the ultimate performance benchmark. Understanding this distinction determines whether a commercial facility should tune fixtures for maximum resin percentage or maximum total biomass extraction.
Rigorous peer-reviewed horticultural research demonstrates that cannabis plants illuminated with 300 PPFD may produce flowers testing at 18% THCA, while increasing PPFD to 800 PPFD elevates potency to 24% THCA: a substantial 33% relative gain in active concentration. However, pushing irradiance from 800 PPFD to 1,400 PPFD typically shifts potency only from 24% to 24.8% (or can cause it to dip to 23.5% if thermal stress occurs), even though total floral biomass increases by 25% to 35%. Growers must align lighting intensity with commercial product destination.
Agronomical Potency Rule: Photons build the structural factory (floral calyxes and biomass), while specialized genetic enzymes synthesize the chemical resin. Once the enzymatic machinery reaches its maximum velocity, additional photons increase factory size rather than the chemical concentration per ounce of tissue.
Cannabinoid Biosynthesis: How Light Drives Glandular Trichome Development
To understand why cannabinoid concentration plateaus earlier than vegetative or floral biomass, cultivators must examine the subcellular biochemical pathways occurring inside glandular trichomes.
The Anatomy of the Capitate-Stalked Trichome
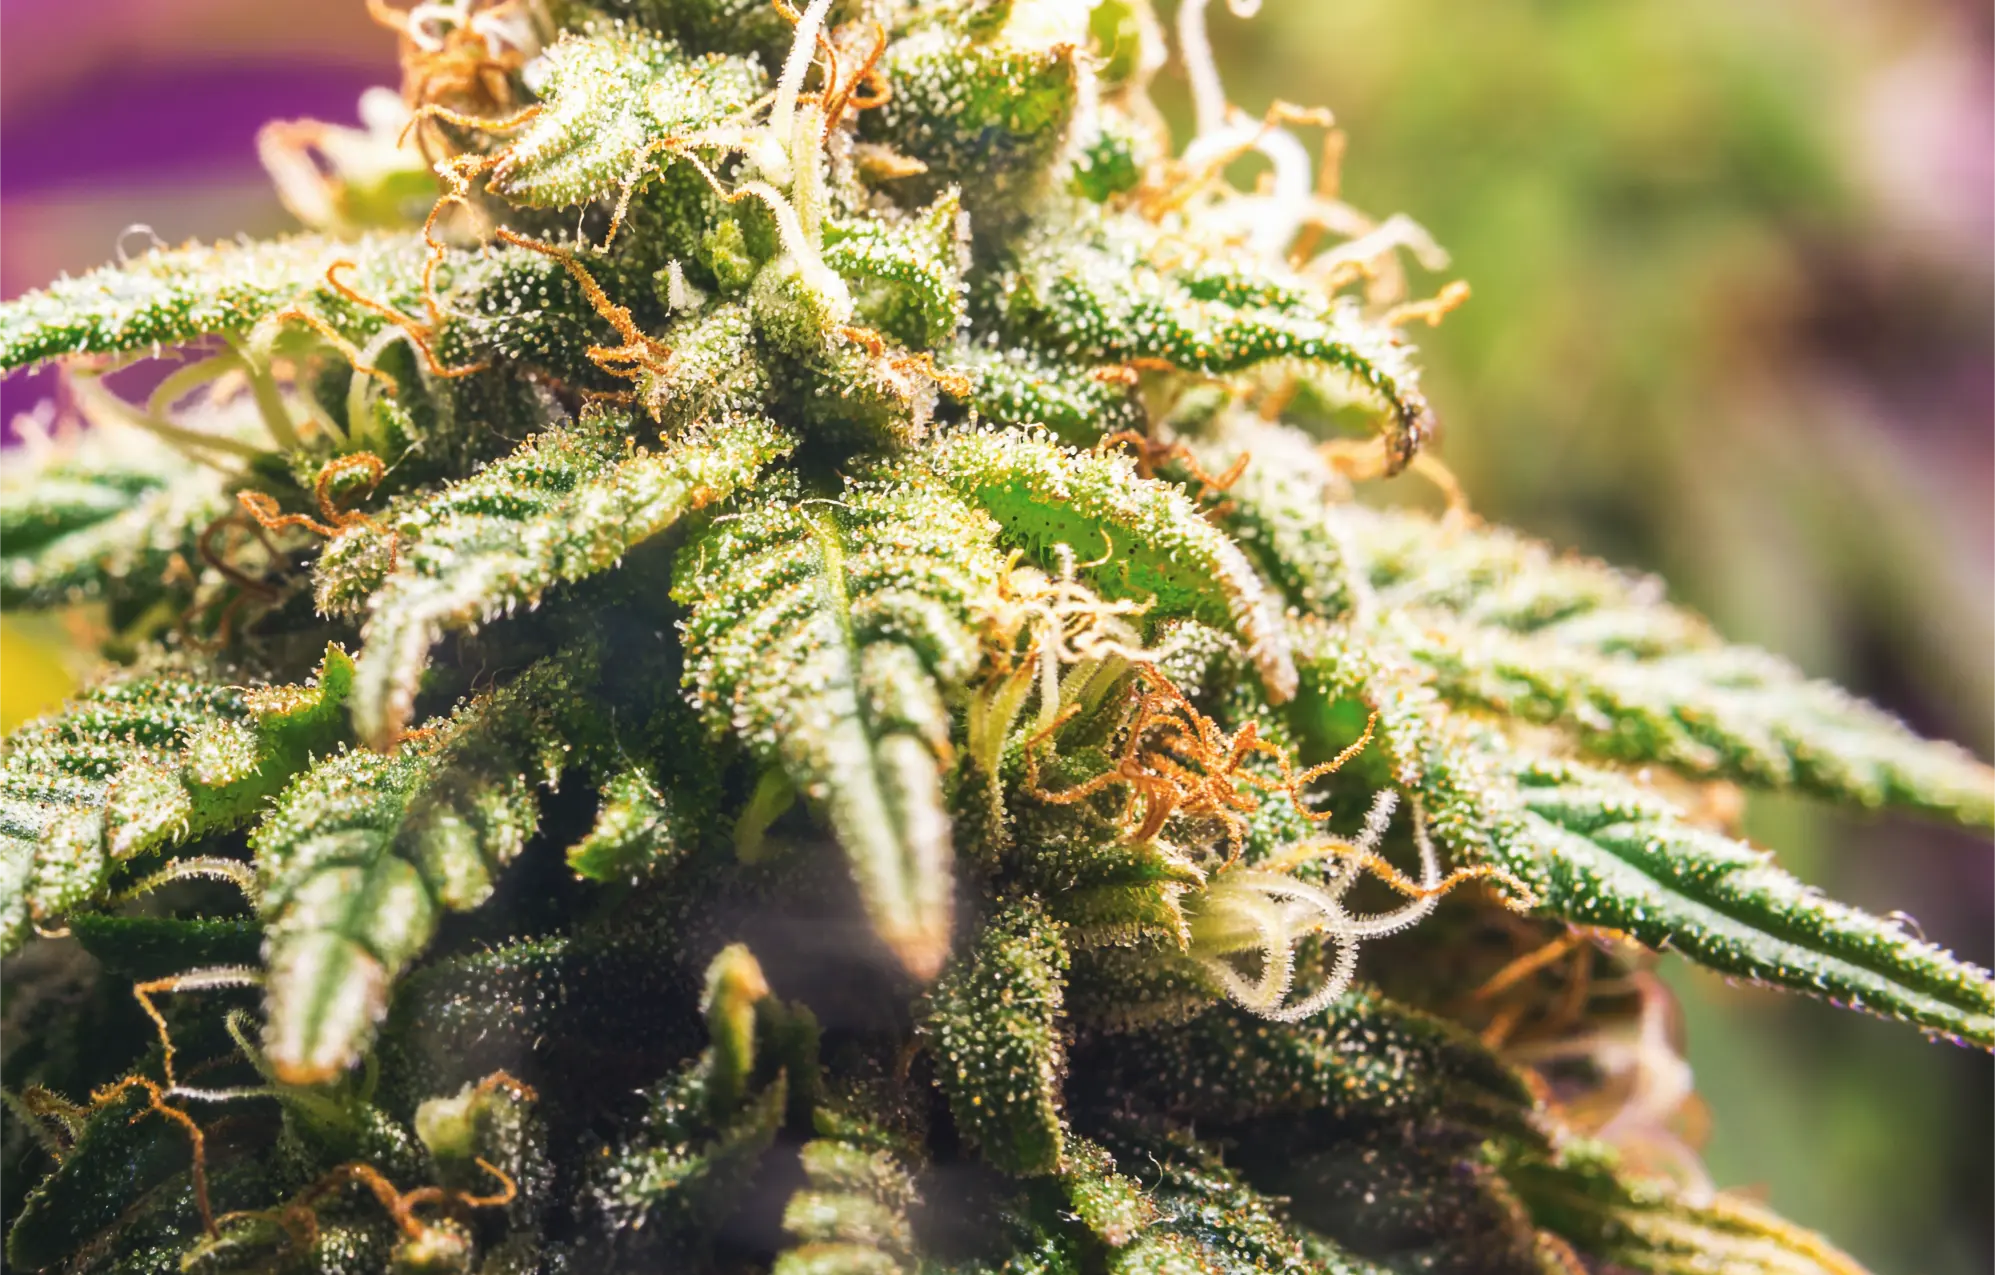
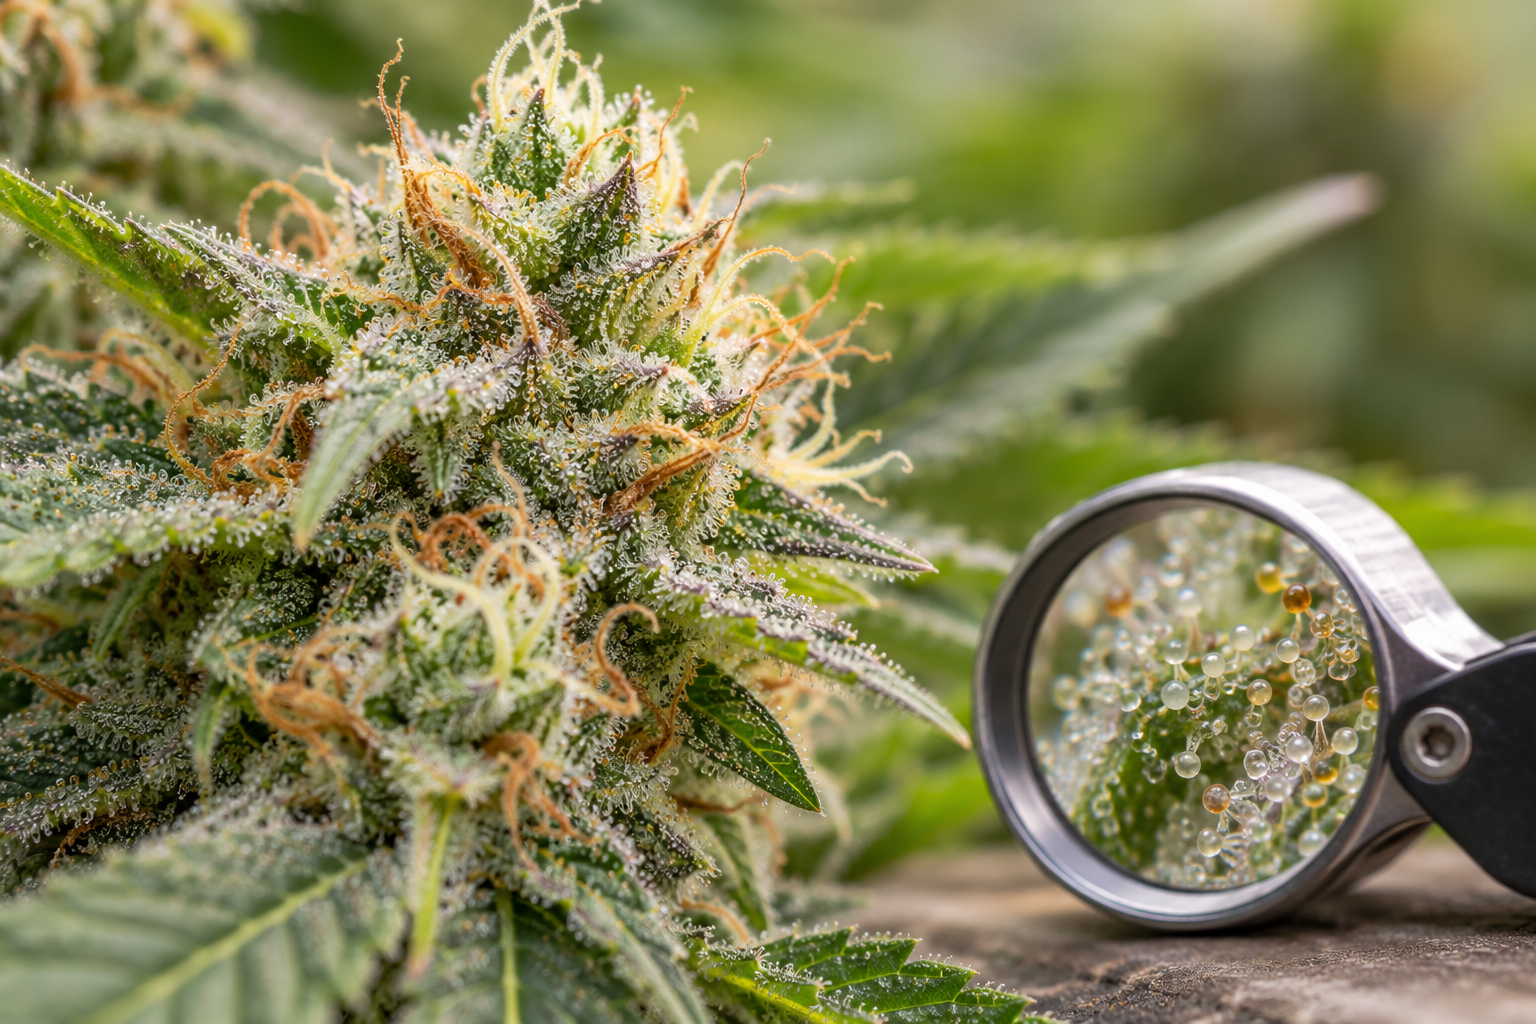
Cannabinoids and terpenes are synthesized and sequestered almost exclusively within specialized epidermal structures called capitate-stalked glandular trichomes. These microscopic structures consist of a multi-cellular stalk supporting a globular secretory head. The secretory head contains a basal disc of 12 to 16 specialized secretory cells positioned beneath an expansive sub-cuticular storage cavity.
Cannabis develops three distinct types of glandular trichomes: bulbous trichomes (the smallest, with 1 to 4 cells), capitate-sessile trichomes (which sit flat against the epidermal surface without an elongated stalk), and capitate-stalked trichomes (the large, elevated resin glands that dominate reproductive floral bracts). High PPFD acts as an environmental developmental signal, up-regulating homeobox transcription factors that stimulate epidermal protodermal cells to divide and elongate into mature capitate-stalked glands. The secretory cells act as intense metabolic engines, consuming high quantities of sucrose and adenosine triphosphate (ATP) generated by primary photosynthesis to feed secondary biosynthetic cascades.
The MEP and Polyketide Pathways: Synthesizing CBGA
Cannabinoid production represents the convergence of two distinct secondary metabolic cascades:
- The Plastidial MEP Pathway: Within the chloroplasts of secretory cells, the 2-C-methyl-D-erythritol 4-phosphate (MEP) pathway utilizes primary photosynthetic intermediates (pyruvate and glyceraldehyde 3-phosphate) to synthesize geranyl pyrophosphate (GPP), a 10-carbon monoterpene precursor.
- The Cytosolic Polyketide Pathway: In the cytoplasm, fatty acid degradation produces hexanoic acid, which is converted into hexanoyl-CoA and subsequently condensed by polyketide synthase enzymes into olivetolic acid (OLA).
- The Prenyltransferase Condensation: A specialized membrane-bound prenyltransferase enzyme, geranylpyrophosphate:olivetolate geranyltransferase (GOT / CsPT4), couples GPP and olivetolic acid to form cannabigerolic acid (CBGA): the critical branching point and “mother cannabinoid” of the cannabis plant.
Enzymatic Conversion to THCA, CBDA, and CBCA
Once CBGA is produced, it is transported across the plasma membrane into the aqueous sub-cuticular storage cavity. In this extracellular space, specific oxidocyclase enzymes catalyze the final conversion:
- THCA Synthase (THCAS): Cyclizes CBGA into tetrahydrocannabinolic acid ($THCA$).
- CBDA Synthase (CBDAS): Converts CBGA into cannabidiolic acid ($CBDA$).
- CBCA Synthase (CBCAS): Converts CBGA into cannabichromenic acid ($CBCA$).
These cyclization enzymes are genetically fixed in their expression levels and follow classical Michaelis-Menten enzyme kinetics. At moderate PPFD (600 to 800 μmol/m²/s), photosynthetic carbon supply matches or exceeds the maximal velocity ($V_{max}$) of THCA synthase. Delivering higher light intensity beyond this point provides an abundance of carbon building blocks, but because the enzymatic processing machinery is already running at peak velocity, the excess carbon is redirected into cell wall polysaccharides, structural carbohydrates, and vegetative calyx biomass rather than higher percentage cannabinoid concentration.
Environmental Interactions: Balancing Photons, Heat, and Terpene Volatilization
Light intensity cannot be managed in isolation; it interacts intimately with canopy leaf temperature, absolute vapor pressure, and atmospheric gas concentrations.
The Photoprotective Role of Trichomes
In evolutionary biology, cannabis developed dense layers of resinous glandular trichomes as a natural defense mechanism against abiotic environmental stressors, including ultraviolet radiation ($UVB$ and $UVA$), high solar photon flux, and excessive ambient vapor pressure deficit. The resin head acts as an optical filter. High cannabinoid and flavonoid concentrations in the resin matrix absorb ultraviolet wavelengths (280 to 400 nm), shielding the delicate photosynthetic machinery inside underlying green bract tissues.
When cannabis is grown under modern horticultural LEDs lacking ultraviolet and far-red spectra, trichome density per square millimeter can be slightly reduced unless light intensity is sufficiently high to trigger photoprotective signaling cascades. Increasing PPFD from 400 to 800 μmol/m²/s stimulates the transcription of genes involved in phenylpropanoid and cannabinoid biosynthesis, promoting dense trichome stalking across floral bracts.
Thermal Volatilization of Monoterpenes
While light stimulates secondary metabolic synthesis, excessive photon delivery elevates floral surface temperatures through radiant heating. Under 1,200+ PPFD, the surface of dense floral clusters can easily run 5°F to 8°F hotter than surrounding room air.
Monoterpenes: such as myrcene, alpha-pinene, limonene, and beta-ocimene: possess exceptionally low boiling points and high vapor pressures. When calyx surface temperatures exceed 80°F to 82°F (26.7°C to 27.8°C) during late bloom, these volatile compounds continuously evaporate from the sub-cuticular secretory cavities directly into the grow room air. The result is a harvest that may possess high dry biomass, but exhibits flat aroma, poor bag appeal, and harsh smoke quality.
Vapor Pressure Deficit and Cuticle Hardening Dynamics
The microclimate surrounding individual floral clusters directly influences the elasticity of the sub-cuticular trichome membrane. If cultivators drive high PPFD (1,100+ μmol/m²/s) while allowing Leaf VPD to surge above 1.6 to 1.8 kPa during late flowering, the severe drying potential of the room air desiccates the waxy outer cuticle. The outer membrane hardens prematurely, losing its structural elasticity.
As volatile terpenes expand within the enclosed secretory cavity during peak photoperiod hours, the brittle, unyielding cuticle cracks. This micro-fissuring exposes raw cannabinoid resins directly to atmospheric oxygen and ozone, accelerating oxidative conversion into dark polyphenols and CBN. Maintaining Leaf VPD tightly between 1.1 and 1.3 kPa during late flowering maintains flexible cuticular membranes, preserving intact resin heads through harvest and mechanical processing.
Carbon Dioxide Enrichment and Potency Preservation
Supplemental carbon dioxide plays a dual role in high-light cultivation. While CO2 allows plants to utilize 1,200 to 1,500 PPFD without suffering photosynthetic photoinhibition, it also influences resin development. Carbon dioxide enrichment stimulates rapid cell division and expansion in floral bracts. In some cultivars, excessive CO2 combined with high light can produce rapid calyx bulking that slightly dilutes secondary cannabinoid concentration on a percentage basis, even while increasing total active grams harvested per square meter.
| PPFD Range (μmol/m²/s) | Dry Floral Yield ($g/m^2$) | Average THCA Potency (%) | Total Active THC ($g/m^2$) | Aroma & Terpene Profile |
|---|---|---|---|---|
| 300 – 450 | 280 – 350 | 16.5% – 19.0% | 50 – 65 | Low resin density; underdeveloped aromatic fractions |
| 550 – 750 | 450 – 580 | 21.0% – 24.5% | 105 – 135 | Robust trichome coverage; rich, balanced terpene spectrum |
| 800 – 1,000 | 600 – 720 | 23.5% – 26.0% | 145 – 180 | Peak percentage potency band; pristine trichome head integrity |
| 1,100 – 1,350 (CO2) | 750 – 920 | 23.0% – 25.5% | 180 – 225 | Maximum total active mass; requires cooling to preserve monoterpenes |
| 1,400+ (Extreme) | 780 – 950 | 20.5% – 23.0% | 170 – 210 | Thermal volatilization; foxtailing; bleaching; degraded aroma |
Step-by-Step PPFD Optimization: Staging Light for Maximum Potency and Yield
To simultaneously achieve peak dry flower yield and elite cannabinoid potency, commercial cultivators employ dynamic light ramping strategies that adapt PPFD to the specific physiological requirements of each flowering phase.
Phase 1: Stretch and Floral Induction (Weeks 1 to 3 of 12/12)
During early flowering, the canopy experiences rapid cell elongation and stem expansion. Deliver 650 to 800 μmol/m²/s PPFD (DLI 28 to 35 mol/m²/d). This irradiance level suppresses excessive internodal stretching while supporting initial floral bud site formation without stressing juvenile root systems.
Phase 2: Peak Calyx Multiplication and Bulking (Weeks 4 to 6 of 12/12)
During mid-bloom, the canopy transitions into intense biomass production. In sealed facilities with 1,200 to 1,400 PPM CO2, ramp irradiance to 1,000 to 1,250 μmol/m²/s PPFD (DLI 43 to 54 mol/m²/d). This maximizes dry calyx weight and triggers primary cannabinoid precursor synthesis.
Phase 3: Trichome Maturation and Resin Loading (Weeks 7 to 8 of 12/12)
As calyx expansion slows, the plant focuses on glandular trichome filling. Maintain irradiance between 850 and 950 μmol/m²/s PPFD. Elevating PPFD beyond 1,000 during this window yields zero additional floral mass while dramatically increasing the risk of trichome head degradation.
Phase 4: Late Ripening and Potency Preservation (Final 10 to 14 Days)
During late senescence, taper light intensity back to 600 to 750 μmol/m²/s PPFD. Simultaneously, lower day room air temperatures to 68°F-72°F (20.0°C-22.2°C) and shut off supplemental CO2. This cool, reduced-photon finish protects delicate monoterpenes from volatilization, halts oxidative THCA degradation, and allows cannabinoids to reach peak biological maturity.
Commercial Production Economics: Extraction vs Retail Flower
Calculating facility energy return on investment requires evaluating the electrical cost per gram of active compound produced. When operating at 900 PPFD in a flower-focused facility, the fixtures consume approximately 650 watts per 4×4 tray, producing 650 grams of dried flower testing at 25% THCA: generating 162.5 grams of pure THCA ($0.25\text{ g THCA per watt}$). When ramping to 1,300 PPFD with CO2, fixture draw increases to 1,000 watts per tray, producing 850 grams of flower testing at 24.5% THCA: generating 208.25 grams of pure THCA ($0.21\text{ g THCA per watt}$). While total active yield climbs by 28%, electrical efficiency declines by 16%. Operators producing premium retail packaged buds capture maximum profit at 850 to 950 PPFD, whereas extraction facilities processing raw biomass into isolate or crude oil maximize revenue at 1,200 PPFD.
| Compound | Biosynthetic Location | Limiting Enzyme / Factor | Optimal Light Level | Thermal Degradation Threshold |
|---|---|---|---|---|
| CBGA | Plastids & Cytosol | CsPT4 Prenyltransferase | 800 – 1,000 PPFD | 86°F (30.0°C) |
| THCA | Secretory Cavity | THCA Synthase ($V_{max}$) | 850 – 950 PPFD | 82°F (27.8°C) |
| CBDA | Secretory Cavity | CBDA Synthase ($V_{max}$) | 800 – 900 PPFD | 84°F (28.9°C) |
| Monoterpenes | Plastidial Secretory Cells | Terpene Synthases (TPS) | 650 – 800 PPFD (Late) | 78°F (25.5°C) |
| Sesquiterpenes | Cytosol (MEV Pathway) | Sesquiterpene Synthases | 750 – 900 PPFD | 88°F (31.1°C) |
Cultivation Pitfalls: Photo-Degradation, Premature Ambering, and Trichome Rupture
Blasting canopies with uncalibrated light levels during the delicate flowering phase triggers serious biochemical failure modes that permanently ruin harvest quality.
Pitfall 1: Photo-Oxidative Conversion of THCA to CBN
Cannabinoids are chemically sensitive to both heat and high-energy photons. When excessive PPFD (1,400+ μmol/m²/s) strikes exposed floral bracts under elevated room temperatures, $THCA$ undergoes spontaneous non-enzymatic degradation. High photon flux accelerates the dehydrogenation of $THCA$ into cannabinolic acid ($CBNA$), which subsequently decarboxylates into cannabinol ($CBN$).
While minor traces of CBN (0.2% to 0.5%) are normal in fully mature harvests, flower batches exhibiting 1.5% to 3.0% CBN indicate severe light or heat degradation. CBN produces heavy sedative effects, diminishes the energetic euphoric qualities of the cultivar, and lowers wholesale market pricing.
Pitfall 2: False Ambering vs Natural Senescence
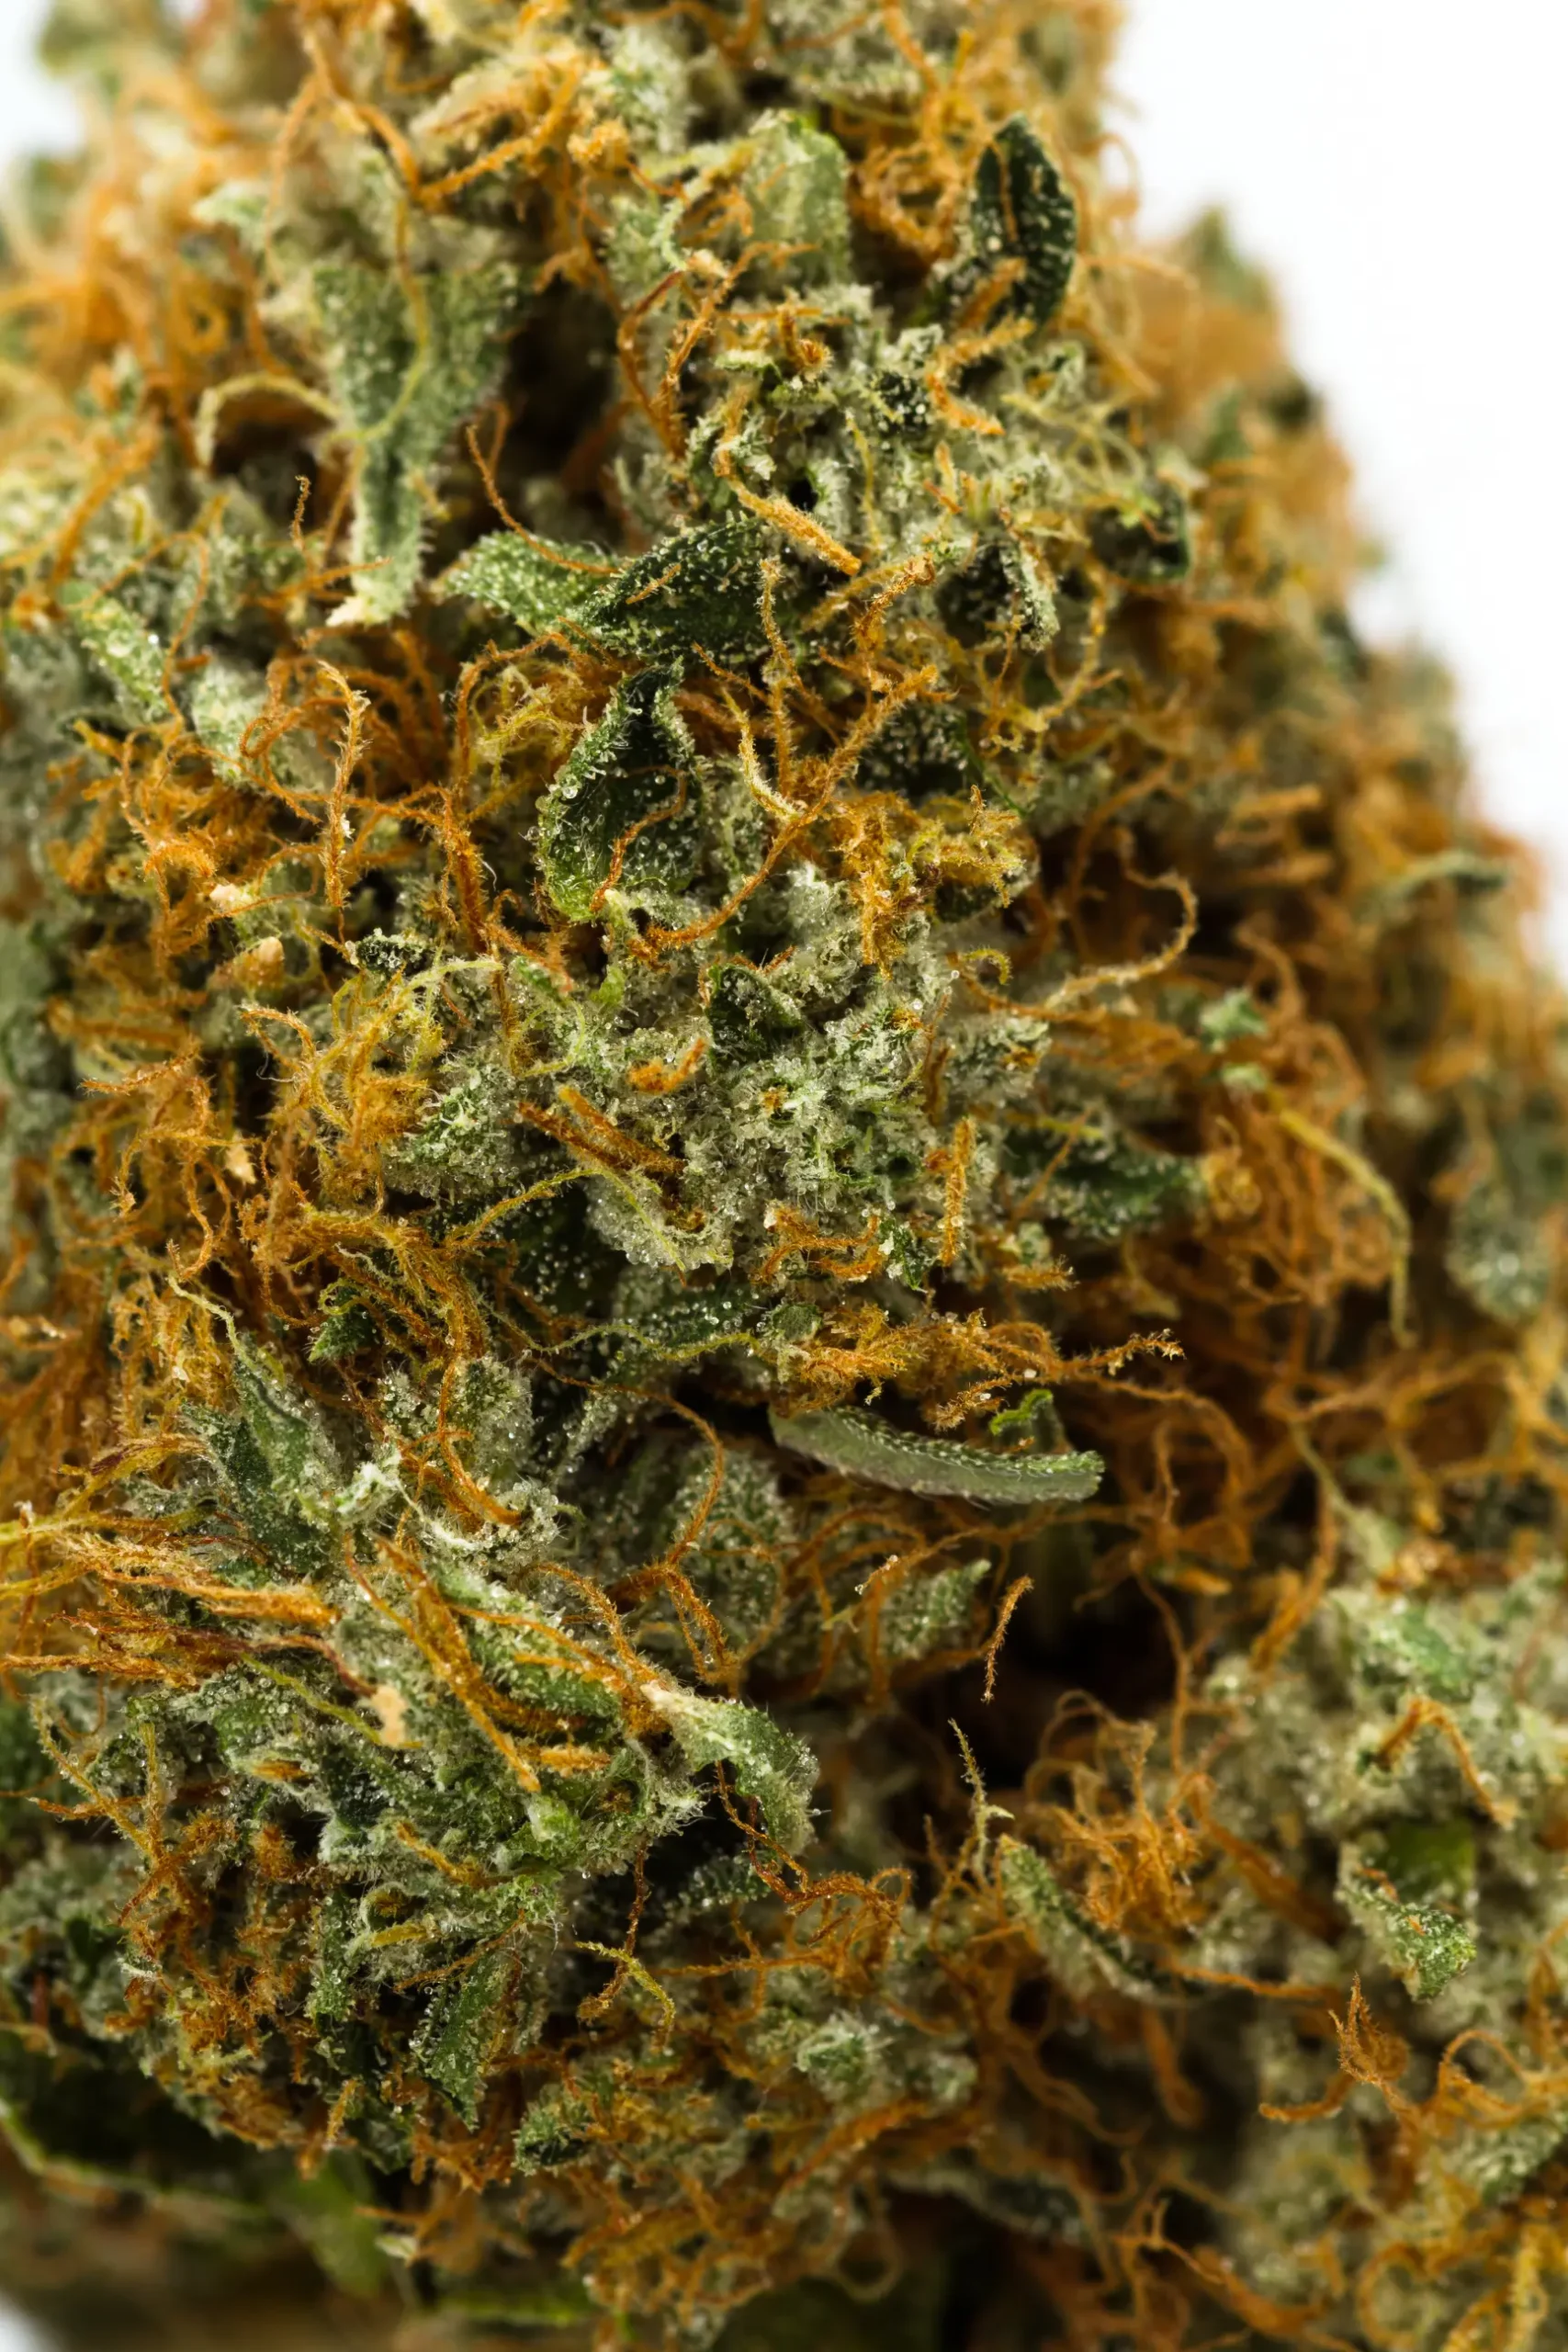
Growers frequently rely on microscope observation of trichome heads turning from milky-white to amber as the primary signal for harvest timing. However, extreme photon irradiance can induce false ambering: physical photo-oxidation of resin heads caused by solar radiation rather than true biological maturity.
Under 1,400+ PPFD, trichome heads on the top exposed surfaces of main colas turn amber while the interior resin heads and understory calyxes remain completely clear and immature. Harvesting based on scorched top trichomes results in under-developed, low-potency flower. True maturity requires uniform milky-to-amber transitions across the entire floral cluster.
Pitfall 3: Sub-Cuticular Trichome Membrane Rupture
The sub-cuticular storage cavity of a glandular trichome is enclosed by a delicate outer membrane composed of pectin, cellulose, and a thin waxy cuticle layer. High photon irradiance combined with low relative humidity (excessive Leaf VPD above 1.7 kPa) can cause the volatile terpenes within the resin cavity to expand rapidly, rupturing the outer cuticle.
Once ruptured, the essential oil leaks across the bract surface, oxidizing instantly upon contact with air. Under macro lens inspection, ruptured trichomes appear as deflated, shriveled stalks lacking clear spherical heads. This rupture leads to catastrophic loss of active terpenes and lowered extractability for solventless hash makers.
How Lowering Light Intensity Elevated Potency from 21.2% to 26.8% THCA
A craft commercial indoor facility in Oregon running a high-profile phenotype of GMO Cookies encountered persistent quality bottlenecks. The lead grower operated high-output LED fixtures at 1,350 μmol/m²/s PPFD right through to the final day of harvest, believing maximum light would maximize THC production. Despite dense bud structure, laboratory lab tests continually came back at an underwhelming 21.2% THCA with terpene content stagnant at 1.4%.
The problem: Microscopic analysis of top colas revealed that over 40% of the capitate-stalked trichome heads directly beneath the LED diodes had ruptured, leaked resin, or turned into dark, oxidized amber heads with elevated CBN levels (1.8% CBN). The intense photon flux was actively frying the trichomes during the final two weeks.
The correction: On the following run, we implemented our late-bloom taper protocol: keeping irradiance at 1,150 PPFD during bulking (Weeks 4 to 6), lowering to 850 PPFD during Week 7, and tapering down to 650 PPFD during the final 12 days while cooling room temperatures to 70°F. The harvest results were startling: lab testing revealed THCA jumped from 21.2% to 26.8% THCA, terpene levels surged from 1.4% to 3.2% total terpenes, and CBN fell to a negligible 0.2%. By stopping the photo-destruction of resin heads, the facility captured the true genetic ceiling of the plant.
When analyzing commercial extraction economics, processor margins are determined by extraction efficiency: the total grams of refined distillate, live rosin, or hydrocarbon extract recovered per pound of input biomass. While pushing extreme PPFD (1,400+ μmol/m²/s) might yield 5% more raw floral biomass, the resulting flower yields significantly less solventless extract because ruptured trichome heads and brittle, oxidized resin cannot be cleanly separated on ice-water wash screens. Operating at 850 to 950 PPFD during late bloom yields pristine, intact trichome heads that separate cleanly, yielding record-breaking solventless returns.
Furthermore, genetic variation dictates how specific cultivars handle high photon density during resin loading. Broad-spectrum landrace sativas and narrow-leaf equatorial genetics typically tolerate higher PPFD regimes without resin degradation, as their evolutionary morphology includes thick cuticular waxes and high flavonoid concentrations designed to withstand intense tropical solar radiation. In contrast, heavy indica-dominant Afghanica cultivars with short, stocky statures evolved in mountainous microclimates with shorter photoperiods; their glandular trichomes are far more susceptible to solar scorching and heat-induced membrane rupture when blasted with 1,200+ PPFD.
In addition, the ratio of primary macronutrients during high-light resin synthesis requires strict adjustment. Nitrogen must be significantly reduced during the final 3 weeks of bloom. If high nitrogen availability is combined with high light intensity, the plant prioritizes vegetative calyx tissue expansion over secondary metabolite synthesis, accelerating biomass accumulation while diluting cannabinoid percentage. Shifting the nutrient feed toward elevated phosphorus, potassium, and bioavailable sulfur supports the enzymatic synthesis of cysteine and methionine, essential amino acids required for prenyltransferase and terpene synthase production.
Do
Taper Light to 650-750 PPFD During Final 14 Days
Lower photon intensity and drop room air temperatures during late bloom to protect delicate monoterpenes and prevent thermal THCA-to-CBN degradation.
Avoid
Blast 1,400+ PPFD on Unsealed, Overheated Canopies
Never run extreme light into hot, unsealed rooms; radiant heating ruptures trichome heads, boils off terpenes, and causes severe photo-oxidation.
Verification Protocols: High-Performance Liquid Chromatography (HPLC) and Microscopy
To accurately evaluate how lighting regimes affect potency and yield in your facility, agronomists utilize rigorous analytical testing methodologies rather than subjective visual estimates.
High-Performance Liquid Chromatography (HPLC)
The undisputed international gold standard for cannabinoid quantification is Reversed-Phase High-Performance Liquid Chromatography (RP-HPLC) paired with a Photodiode Array (PDA) or UV detector. Unlike gas chromatography (GC), which applies intense heat that artificially decarboxylates acidic cannabinoids during injection, HPLC analyzes compounds in their native, unheated acidic forms ($THCA$, $CBDA$, $CBGA$).
HPLC testing provides precise baseline data to calculate Total Potential THC using the stoichiometric decarboxylation formula: $$\text{Total THC} = \Delta^9\text{-THC} + (0.877 \times \text{THCA})$$ By testing composite flower samples harvested from varying canopy tiers (upper crown, middle tier, lower understory) under different PPFD levels, facility managers can map the exact photon saturation threshold for cannabinoid synthesis.
Optical Trichome Density and Integrity Inspection
In the grow room, cultivators verify trichome development using a 60x to 100x illuminated jeweler loupe or digital handheld USB microscope. Inspecting 10 random floral clusters across the canopy allows growers to track three critical diagnostic criteria:
- Trichome Stalk Density: Count the number of capitate-stalked trichomes per square millimeter of calyx surface. Optimal PPFD (800 to 950 μmol/m²/s) creates dense, crowded carpets of upright stalks.
- Head Gland Spherical Integrity: Verify that trichome resin heads are fully swollen, spherical, and firmly attached to their stalks without shriveling, deflating, or rupture.
- Coloration Progression: Track the shift from juvenile clear (low cannabinoid content) to opaque milky-white (peak cannabinoid concentration) to amber (cannabinoid oxidation). Target harvesting when 85% to 90% of heads are milky and 10% to 15% are amber.
Does adding far-red or UVB light increase cannabinoid concentration more than increasing total PPFD?
Question sent by: Marcus Sterling, via email.
Yes, targeted supplemental spectrum can influence percentage concentration more efficiently than simply increasing white PPFD. While blasting additional white light beyond 900 PPFD yields diminishing potency returns, targeted supplemental UVB radiation (280 to 315 nm) triggers specific photoprotective stress responses that stimulate THCA synthase transcription, elevating cannabinoid percentage without increasing fixture wattage or room heat. Similarly, supplemental far-red (730 nm) promotes biomass expansion via the Emerson enhancement effect. Spectral precision consistently outperforms brute-force white wattage.
Final Decision Checklist and Companion Weedth Resources
Before deciding your facility lighting targets for flowering crops, verify your parameters against this operational checklist:
Cannabinoid Potency and Yield Optimization Checklist
- Identify primary product target: optimize for percentage potency (retail flower) or total active mass (oil extraction).
- Operate peak bloom PPFD between 800 and 950 μmol/m²/s in ventilated facilities to capture maximum potency without heat stress.
- Enrich with 1,200 to 1,400 PPM CO2 if pushing PPFD between 1,000 and 1,300 μmol/m²/s during floral bulking.
- Implement late-bloom light tapering; drop PPFD to 650-750 μmol/m²/s during the final 10 to 14 days of flowering.
- Lower day temperatures to 68°F-72°F during late ripening to preserve volatile monoterpenes like myrcene and pinene.
- Monitor upper canopy colas for signs of false ambering, CBN conversion, or ruptured trichome heads.
- Audit harvest outcomes using HPLC testing across upper, middle, and lower canopy tiers to calculate true active extraction yield.
- Maintain horizontal airflow (0.3 to 0.5 m/s) to strip hot boundary layers from dense, resinous flower clusters.
Mastering the relationship between light intensity, floral yield, and cannabinoid concentration elevates cannabis cultivation from guesswork into high-precision horticultural science. By recognizing where biomass expansion and chemical potency diverge, commercial operators achieve elite dispensary-grade potency, rich terpene profiles, and unmatched facility profitability.
Final Verdict: Light builds the yield, but cool precision preserves the potency. Scale photon intensity during floral bulking, taper down during late ripening, and protect trichome head integrity to unlock the true genetic potential of your harvest.
To continue your technical cultivation mastery with our companion foundational guides, explore Weedth resources below.
Share this article
A quick overview of the topics covered in this article.
Follow us
Latest articles
October 29, 2026

October 29, 2026