Color Temperature and CCT in Grow Lights
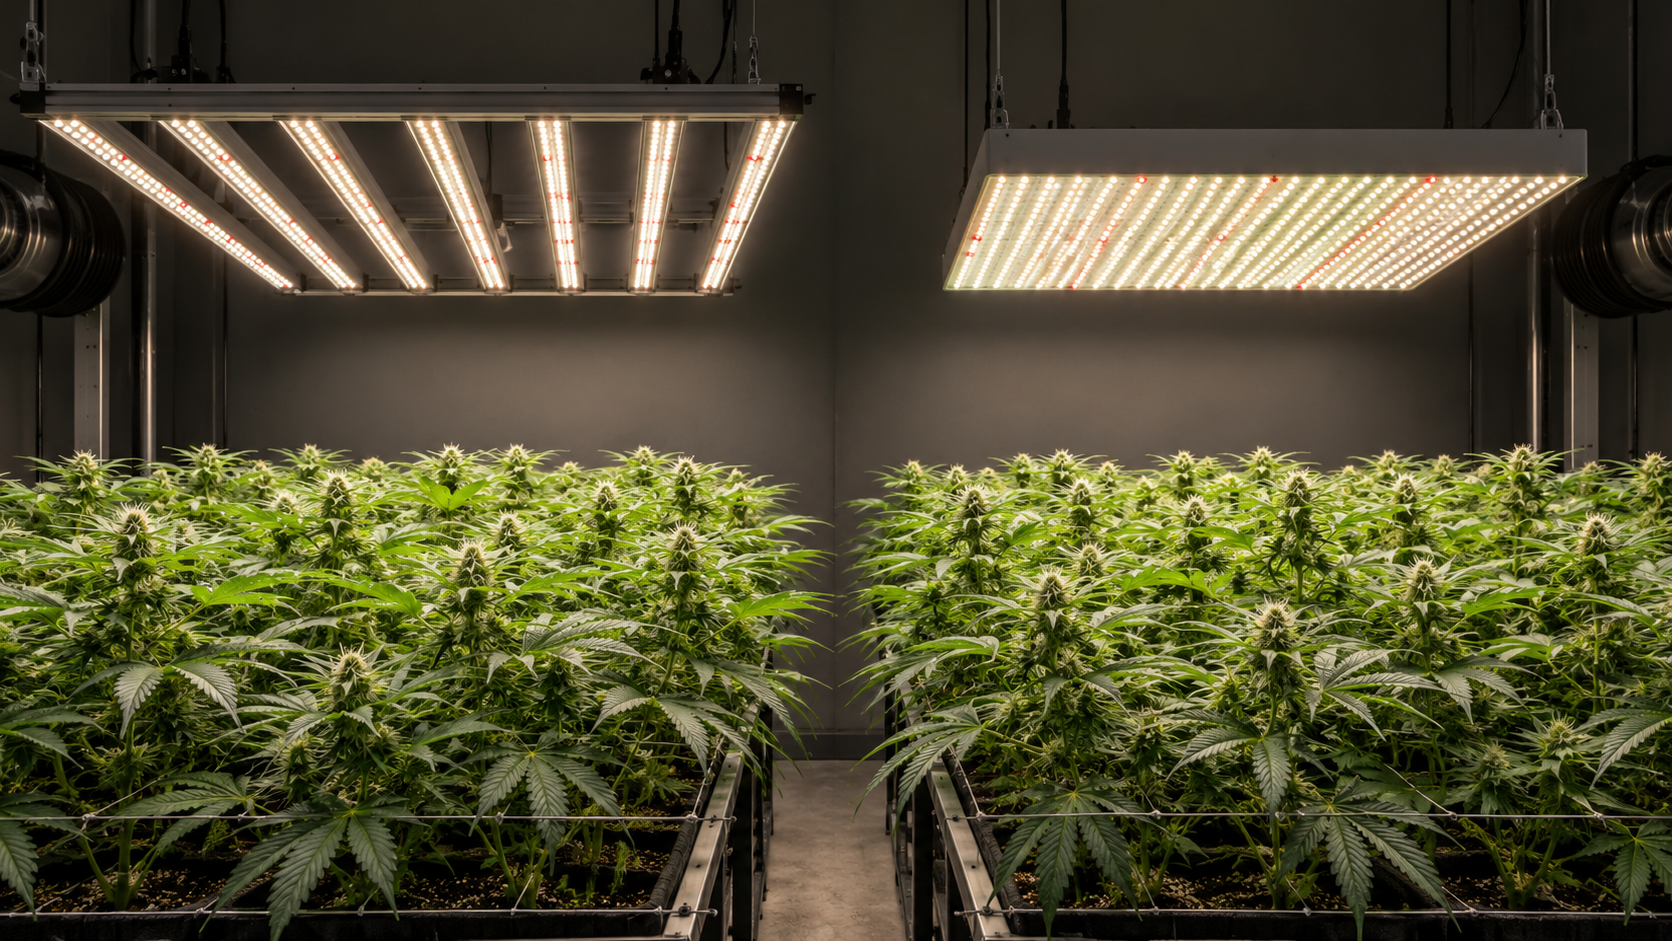
When indoor cannabis cultivators evaluate modern solid-state luminaires, one of the most prominent specifications printed on retail packaging and technical data sheets is Correlated Color Temperature, abbreviated as CCT and expressed in degrees Kelvin (K). Manufacturers market fixtures as warm 3000K bloom lights, balanced 4000K full-cycle workhorses, or crisp 5000K vegetative luminaires. For growers transitioning from high-pressure sodium (HPS) and metal halide (MH) systems, color temperature is frequently treated as an intuitive shorthand for plant suitability: lower Kelvin numbers mean red flowering light, while higher Kelvin numbers mean blue vegetative light.
However, from the standpoint of plant photobiology and quantum physics, relying on color temperature to judge a horticultural luminaire carries significant risks. Correlated Color Temperature is not a measurement of photosynthetic capacity. It was engineered specifically for human architectural lighting, quantifying how the human eye and brain perceive the chromatic warmth or coolness of an illuminated room based on the photopic spectral sensitivity of retinal cone cells. Plants, by contrast, possess an entirely different optical physiology: they do not perceive illumination in lumens, lux, or Kelvin. They process individual photons through specialized photoreceptors across distinct nanometer wavebands to power the light-dependent reactions of photosynthesis.
Two grow lights sharing an identical 4000K CCT rating can produce drastically different plant responses, varying wildly in their blue-to-red ratios, canopy penetration depths, and electrical photosynthetic photon efficacy (PPE in μmol/J). Understanding the underlying mechanics of CCT: including blackbody radiation physics, chromaticity coordinates, phosphor down-conversion chemistry, and spectral power distributions, is essential for any cultivator seeking to optimize canopy biomass, control stem elongation, and avoid deceptive equipment marketing.
This comprehensive guide deconstructs Correlated Color Temperature for indoor cannabis production. We analyze the physical origins of Kelvin ratings on the Planckian locus, examine the exact photon distributions of commercial 3000K, 4000K, 5000K, and 6500K diodes, explore the direct trade-off between CCT and electrical photon efficiency, evaluate single-spectrum versus multi-spectrum facility strategies, explain why high Color Rendering Index (CRI) can secretly lower fixture efficacy, and establish a verifiable procurement and testing protocol for your garden.
Direct Answer: What CCT Measures and Why Plants Do Not Process Kelvin
The central fact every indoor cultivator must understand is that plants do not have photoreceptors for Kelvin. Correlated Color Temperature describes the chromatic appearance of light emitted by a source by comparing it to the visual color of a theoretical blackbody radiator heated to an equivalent thermodynamic temperature. A candle flame burns at roughly 1800K, an incandescent tungsten filament glows at 2700K, direct horizontal morning sunlight registers at 4000K, and an overcast midday sky measures 6500K or higher.
Correlated Color Temperature (CCT)
A metric used in lighting engineering to quantify the apparent color tint of white light, measured in degrees Kelvin (K). CCT applies strictly to light sources that produce light close to the blackbody radiator locus on the CIE 1931 chromaticity diagram. CCT measures perceived visual warmth or coolness for human retinal vision and provides no direct measurement of photosynthetic photon flux density (PPFD) or quantum photosynthetic efficacy.
While CCT provides an approximate indication of whether a fixture spectrum is heavily weighted toward the blue or red ends of the visible spectrum, it tells you nothing about the discrete nanometer peaks driving your crop. A luminaire with an advertised 3500K rating could achieve that color temperature by blending equal parts blue and red monochromatic light, or by utilizing an Indium Gallium Nitride (InGaN) blue diode pump combined with a broad yellow-green phosphor coating. To the human eye, both fixtures appear visually identical in hue. To a cannabis canopy, their biological impacts on Photosystem II excitation, leaf expansion, and secondary metabolite synthesis are radically different.
Remember: Color temperature is a human eye metric, whereas photosynthesis is a quantum photochemical reaction. Cannabis leaves count individual photons within specific nanometer wavebands (400 to 750 nm) regardless of how white, warm, or cool the room looks to a human observer.
Consequently, master cultivators treat CCT not as an absolute performance specification, but as a broad classification tool. When purchasing or auditing lighting hardware, you must demand the laboratory Spectral Power Distribution (SPD) chart and integrating sphere photon efficacy data rather than basing purchasing decisions solely on a Kelvin number printed on a box.
The Physics of CCT: Blackbody Radiators and the Planckian Locus
To understand the limitations of color temperature in horticulture, one must understand how CCT is calculated in optical physics. The concept traces back to the late nineteenth century and the work of biophysicist Max Planck regarding blackbody radiation.
The Planckian Blackbody Locus
A theoretical blackbody is an idealized physical object that absorbs all incident electromagnetic radiation. When heated, it emits light in a continuous thermal spectrum governed strictly by its temperature in Kelvin. At 1000K, the blackbody glows dull red. As temperature rises to 3000K, it transitions to warm yellowish-white. At 5000K, it appears crisp white, and above 7000K, it emits an intense bluish-white brilliance.
When plotted on the standard CIE 1931 (x, y) chromaticity diagram, the coordinates of light emitted by a blackbody at various temperatures trace a curved path known as the Planckian locus. For a light source like an incandescent bulb, the emitted light falls directly on this curve. However, solid-state LED fixtures do not produce thermal blackbody radiation; they generate light via semiconductor electroluminescence and down-converting phosphors.
Correlated vs Exact Color Temperature: The Duv Metric
Because LED spectra do not match blackbody emitters perfectly, lighting engineers use the term Correlated Color Temperature. An algorithm projects the measured chromaticity coordinates of the LED onto the closest point on the Planckian locus. The distance from the actual coordinates to the blackbody curve is designated as Duv:
- Positive Duv (+Duv): The light coordinates sit above the Planckian locus, imparting a slight yellowish or greenish tint to the white light.
- Negative Duv (-Duv): The light coordinates sit below the Planckian locus, giving the white light a subtle pinkish or violet cast.
Two grow lights can both measure exactly 3500K CCT, but if one fixture has a positive Duv (+0.004) and the other has a negative Duv (-0.004), the first fixture will deliver significantly more green photons (beneficial for deep canopy penetration), while the second will deliver more blue and red photons (beneficial for upper leaf absorption). Relying solely on CCT completely obscures these crucial spectral variations.
Pro Tip: Horticultural LEDs with a slightly negative Duv often appear visually richer and cleaner to growers, but fixtures with neutral or slightly positive Duv often deliver higher concentrations of penetrating 520 to 560 nm green photons that illuminate interior canopy foliage under dense trellising.
Spectral Power Breakdown of Common CCTs: 3000K, 4000K, 5000K, and 6500K
While CCT does not define individual nanometer peaks, commercial phosphor-converted white LED packages follow predictable spectral distributions across standard color temperature tiers. Examining the photon percentages across blue (400-500 nm), green/yellow (500-600 nm), and red (600-700 nm) reveals how each Kelvin rating influences cannabis physiology.
3000K Warm White: The Flowering Foundation
A standard 3000K white diode features a modest blue pump peak at 450 nm and an extensive, red-shifted phosphor emission curve that peaks between 600 and 620 nm. Roughly 12% to 14% of emitted photons fall within the blue waveband, 40% in green/yellow, and 42% to 45% in red. The high red-to-blue ratio makes 3000K an exceptional base spectrum for flowering rooms: red photons drive photosynthetic carbon assimilation with high quantum efficiency, while the reduced blue fraction minimizes stomatal conductance resistance.
4000K Neutral White: The Balanced Single-Source Workhorse
In a 4000K diode, the blue pump peak is noticeably taller, representing approximately 18% to 22% of total photon flux. The green continuum accounts for roughly 44%, while red comprises 34% to 38%. This balanced photon diet mirrors natural midday sunlight through a clear atmosphere. It provides enough blue to activate cryptochromes and suppress unwanted stem elongation, sufficient green to illuminate lower leaves, and ample red to drive vigorous biomass accumulation. 4000K serves as the premier single-source spectrum for facilities operating seed-to-harvest in one space.
5000K to 6500K Cool White: The Vegetative Specialist
Cool white diodes feature an intense blue peak representing 25% to 35% of total photon output. The red waveband is proportionally depressed, making up only 18% to 24% of the spectrum. High blue fractions trigger robust cryptochrome signaling, suppressing gibberellin synthesis and preventing cellular expansion in stem internodes. Plants grown under 5000K-6500K develop short, stout main stems, thick lateral branches, and compact internodal spacing, making this spectrum ideal for mother plants, seedling nurseries, and early vegetative canopies.
The comparative reference table below breaks down the typical photon percentages across commercial CCT ratings:
| Diode CCT Rating | Blue Flux (400-500nm) | Green/Yellow Flux (500-600nm) | Red Flux (600-700nm) | Red-to-Blue Ratio | Optimal Cultivation Stage |
|---|---|---|---|---|---|
| 3000K Warm White | 12% – 15% | 40% – 44% | 42% – 46% | 3.0 – 3.8 | Dedicated flowering rooms; promotes floral swelling |
| 3500K Warm-Neutral | 15% – 18% | 42% – 45% | 38% – 42% | 2.2 – 2.8 | Hybrid spectrum; excellent bloom with moderate stretch control |
| 4000K Neutral White | 18% – 22% | 43% – 46% | 33% – 37% | 1.6 – 2.0 | Full-cycle seed-to-harvest; balanced morphology and yield |
| 5000K Cool White | 25% – 30% | 44% – 47% | 23% – 28% | 0.8 – 1.1 | Late vegetative stage; suppresses stretch on vigorous cultivars |
| 6500K Daylight | 30% – 38% | 42% – 45% | 18% – 24% | 0.5 – 0.7 | Mother plants, tissue culture, clone propagation |
CCT vs Photosynthetic Photon Efficacy (PPE): The Phosphor Efficiency Trade-Off
One of the least understood aspects of LED grow light engineering is the direct thermodynamic relationship between Correlated Color Temperature and electrical Photosynthetic Photon Efficacy (measured in micromoles of photons per joule of energy, μmol/J).
Stokes Shift Loss in Low-CCT Phosphors
White LEDs do not generate red, yellow, or green light directly from their primary semiconductor die. An InGaN blue die emits 450 nm photons, which strike ceramic phosphor particles. The phosphor absorbs the high-energy blue photon and re-emits a lower-energy photon at a longer wavelength. The energy difference between the absorbed blue photon and the re-emitted longer photon is lost as microscopic heat, a physical penalty known as Stokes shift loss.
To produce a warm 3000K spectrum, manufacturers must apply heavier coatings of red-shifted phosphors (nitride or oxynitride compounds) that shift more energy into the deep red waveband. Because the energy drop from 450 nm blue to 620-650 nm red is substantial, Stokes shift losses are maximized. Conversely, producing a cool 5000K or 6500K spectrum requires far less phosphor down-conversion: a larger percentage of 450 nm blue photons escape directly through the thin phosphor layer unconverted.
Field Advice: Because high-energy blue photons experience less phosphor down-conversion loss, a bare 5000K white LED diode inherently operates at higher electrical photon efficacy (roughly 5% to 8% more photons per joule) than an otherwise identical 3000K white diode from the exact same semiconductor bin.
Why Horticultural Fixtures Add Monochromatic 660 nm Diodes
This phosphor efficiency penalty explains why elite horticultural luminaire manufacturers do not build flowering fixtures using exclusively 3000K white diodes. Instead, they utilize high-efficiency 4000K or 5000K white diodes (which operate at high base electrical efficiency) and blend them with dedicated monochromatic 660 nm Deep Red chips (such as Osram Oslon Square or Samsung LH351H).
Monochromatic 660 nm diodes do not use phosphors; their Gallium Arsenide Phosphide (GaAsP) or Indium Gallium Aluminum Phosphide (InGaAlP) semiconductor dies emit deep red photons natively at staggering electrical efficacies reaching 3.8 to 4.2 μmol/J. Blending broad 4000K white with direct 660 nm red bypasses Stokes shift losses entirely, delivering a warm flowering spectrum while pushing overall fixture PPE beyond 2.8 to 3.1 μmol/J.
If 5000K diodes are more electrically efficient, why not flower cannabis under 5000K?
Question sent by: Ethan Brooks, via email.
Because electrical efficiency is only half the equation; biological quantum yield is the other. While 5000K diodes produce more total photons per watt, too many of those photons are blue. During flowering, excessive blue light (above 20% to 25% of total flux) reduces whole-canopy carbon assimilation because blue light saturates upper leaf surfaces and triggers stomatal limitations. Red photons (660 nm) drive photosynthetic biomass accumulation with higher quantum efficiency per absorbed photon. Flowering under pure 5000K yields smaller, denser buds with lower total dry harvest weight compared to a red-enriched 3000K-3500K or broad-spectrum fixture with supplemental 660 nm diodes.
Single-Source Cultivation vs Stage-Specific CCT Switching
Commercial cultivators face an important operational dilemma: should a facility install dedicated cool-spectrum fixtures (5000K) in vegetative rooms and dedicated warm-spectrum fixtures (3000K + 660nm) in flowering rooms, or should the entire facility standardize on a single balanced CCT spectrum?
The Dual-Spectrum Strategy: Traditional Commercial Protocol
In a multi-room commercial layout with dedicated vegetative mother rooms and independent flowering bays, operating stage-specific color temperatures offers biological advantages:
- Vegetative Room (5000K to 6500K): Promotes short internodes, heavy lateral branching, and thick stem caliper, maximizing the number of healthy cutting sites per square foot of mother stock.
- Flowering Room (3000K + 660nm + 730nm): Delivers maximum red photon flux to drive Photosystem II, accelerate calyx expansion, and support high Daily Light Integral (DLI) without excessive vegetative foliage crowding.
The Single-Source Strategy: Modern Facility Standardization
In single-tier sea-of-green (SOG) facilities, modular container farms, or home grow tents where plants remain in the same physical space from transplant to harvest, standardizing on a 3500K or 4000K broad-spectrum fixture eliminates equipment redundancy. Modern broad-spectrum white fixtures contain adequate blue (18%) to prevent runaway internodal stretch during veg while delivering sufficient red (38%) to achieve commercial flower yields exceeding 2.0 grams per watt.

Because color temperature interacts with other critical lighting parameters, facility managers must evaluate spectral selection alongside fixture efficiency, operating costs, and companion waveband technologies. Reviewing our companion lighting resources provides essential architectural context:
When integrated within an evidence-based cultivation framework, selecting the proper CCT streamlines nursery logistics, reduces backup fixture inventory, and ensures predictable canopy architecture across every production cycle.
Color Rendering Index (CRI) and TM-30: Human Scouting vs Plant Photobiology
Closely linked to Correlated Color Temperature on lighting specification sheets is the Color Rendering Index (CRI, Ra), a scale from 0 to 100 that measures how faithfully an artificial light source reveals the natural colors of physical objects compared to sunlight or incandescent illumination.
The Scouting Advantage of High CRI (>80 to >90)
In commercial cannabis facilities, human labor represents a major operating expenditure. Cultivation technicians must scout hundreds of square meters of canopy daily for early warning signs of crop failure: two-spotted spider mites, thrips, powdery mildew mycelium, Botrytis bud rot, and micronutrient deficiencies (such as interveinal iron or magnesium chlorosis).
Under low-CRI light sources (such as high-pressure sodium bulbs with CRI 22, or legacy pink/purple blurple LEDs with negative CRI), colors are severely distorted. A chlorotic yellow leaf appears identical to a healthy green leaf, and early gray fungal lesions blend invisibly into floral calyxes. Operating white LED arrays with a CRI of 80 or 90 provides true-to-life color rendering, allowing staff to spot and eradicate pests and pathogens days before they develop into room-wide outbreaks.
The High-CRI Efficiency Penalty: Why CRI 95 Can Hurt Yield
However, growers must recognize that CRI was designed for museum curating and retail clothing displays, not horticulture. The standard CRI calculation is based on eight pastel color samples (R1 through R8) with a strong emphasis on human photopic sensitivity in the yellow-green waveband.
To push an LED chip from CRI 80 to CRI 95, chip manufacturers must add dense red-shifted phosphors that fill in the cyan-green and deep red valleys of the spectrum. These phosphors introduce additional Stokes shift losses, dropping overall diode electrical efficacy by 10% to 15%. A fixture operating at CRI 80 that delivers 2.9 μmol/J will produce significantly more total dry flower biomass than a CRI 95 fixture that delivers only 2.4 μmol/J, assuming equal electrical wattage.
Do
Target CRI 70 to 80 for Commercial Flowering Canopies
Select fixtures engineered with CRI 70 to 80 white diodes paired with 660 nm deep red chips, maximizing electrical photon efficiency while maintaining adequate human visibility.
Avoid
Pay Premiums for CRI 95+ Horticultural Lighting
Do not sacrifice 10% to 15% electrical photon efficacy just to achieve television-studio color fidelity, unless your facility primary objective is marketing videography.
What is the difference between CRI and the newer TM-30 standard?
Question sent by: Julia Schneider, via contact form.
CRI (Color Rendering Index) is an outdated standard established in 1965 that evaluates only eight unsaturated color swatches, allowing lighting designers to game the score by spiking narrow wavebands. TM-30-18 is a modern comprehensive standard developed by the Illuminating Engineering Society (IES) that utilizes 99 real-world color evaluation samples and provides two distinct metrics: Color Fidelity ($R_f$, scoring color accuracy from 0 to 100) and Color Gamut ($R_g$, measuring color saturation from 60 to 140). While TM-30 is far more accurate for evaluating architectural light, horticultural performance is still determined by photosynthetic photon flux (PPF) and spectral distribution rather than either color metric.
Common Mistakes: The High-CCT Vegetative Trap and Spec Sheet Deceptions
Because CCT is widely misunderstood, cultivators frequently fall into expensive operational traps when specifying fixtures for their cultivation spaces.
Mistake 1: The High-CCT Vegetative Trap (Exceeding 6500K)
A pervasive myth inherited from the fluorescent T5 era suggests that the higher the Kelvin rating, the better the vegetative growth. Cultivators seek out 6500K or 7000K daylight panels, believing they will produce the fastest vegetative growth rates. In reality, while high blue fractions suppress stem elongation, they also reduce leaf surface area expansion. Broad, thin leaves intercept more total photons across horizontal trellises than tiny, dark green, leathery leaves. Moving from 6500K to 4000K or 4500K often increases vegetative biomass accumulation by 15% to 25% due to improved leaf expansion and deeper green light penetration.
Mistake 2: Assuming Identical CCT Means Identical Spectrum
Two fixtures labeled 3000K can have radically different photobiological impacts. Fixture A may use cheap high-CRI packaging with substantial amber phosphor emission and zero deep red beyond 630 nm. Fixture B may use high-efficacy white diodes paired with 15% monochromatic 660 nm deep red chips. Both register at 3000K on an integrating sphere report, but Fixture B will dramatically outperform Fixture A in floral dry weight and cannabinoid accumulation.
Mistake 3: Evaluating CCT with Smartphone Apps or Lux Meters
Smartphone camera sensors and inexpensive lux meters cannot accurately measure CCT under narrow-band or phosphor-converted LED arrays. Smartphone cameras rely on automated white-balance algorithms that get confused by high-red horticultural spectra. Determining true CCT, Duv, and spectral power distribution requires a calibrated field spectroradiometer (such as an Asensetek, Sekonic, or Apogee spectral sensor).
Evaluating 3000K vs 4000K Across Identical Clones in a Multi-Tier Grow
In a commercial two-tier vertical facility, we conducted a split-bench trial on an elite OG Kush cut known for aggressive vertical stretch. Rack 1 was illuminated with 3000K commercial bars; Rack 2 was equipped with identical-wattage 4000K bars from the same manufacturer, with both racks calibrated to exactly 850 μmol/m²/s PPFD at canopy level.
The takeaway: Under the 3000K fixtures, the OG Kush canopy stretched 29 inches during the first three weeks of 12/12, forcing us to dim the lights by 20% to prevent upper leaf bleaching against the rack. Under the 4000K fixtures, the additional blue photons suppressed elongation, keeping stretch to a manageable 19 inches with tight 1.1-inch internodal spacing. At harvest, the 4000K rack produced 11.2% more premium A-grade bud by weight because the canopy remained within the fixture optimal focal distance without requiring dimming. For vigorous, stretchy poly-hybrids, a 4000K neutral spectrum often outperforms 3000K warm white by keeping internodes tight and preventing canopy burn.
Master Advice: Match your CCT selection to your cultivar growth habit. If you grow stocky, broad-leaf Afghanica cultivars that naturally stay short, 3000K will maximize floral swelling without causing unmanageable stretch. If you cultivate stretchy sativa-dominant hybrids, 3500K to 4000K provides the blue photonic brake needed to maintain an even, manageable canopy.
The comparative diagnosis table below highlights common CCT misapplications and their practical corrective actions:
| Observed Crop Symptom | Suspected CCT Issue | Environmental Look-Alike | Corrective Cultivation Action |
|---|---|---|---|
| Excessive Internodal Stretch (Bloom W1-3) | CCT too warm (< 3000K) with inadequate blue fraction (< 12%) | Excessive nitrogen fertilization or high positive DIF (hot days, cool nights) | Shift baseline spectrum to 3500K-4000K or apply negative DIF during early bloom |
| Stunted Veg Growth, Tiny Dark Leaves | CCT too cool (> 6500K) with excessive blue inhibiting leaf expansion | Root-zone overwatering or excessive electrical conductivity (EC) | Switch vegetative fixtures to 4000K-5000K to stimulate horizontal leaf lamina growth |
| Low Dry Weight Yield Despite High PPFD | High-CRI fixture (> 95) with reduced electrical efficacy and low 660nm red | Carbon dioxide starvation (< 400 ppm) or micronutrient deficiencies | Verify fixture PPE with integrating sphere reports; supplement with dedicated 660nm red bars |
| Severe Lower-Canopy Larf and Shaded Foliage | Dual-band red/blue fixture lacking continuous green phosphor continuum | Excessive planting density or failure to perform lower-canopy defoliation | Replace narrow-band fixtures with broad-spectrum white LEDs delivering 40%+ green light |
The CCT Selection and Verification Framework: Step-by-Step Grower Protocol
To make confident, evidence-based lighting investments and select the ideal color temperature for your facility, execute this repeatable four-step evaluation sequence:
Step 1: Define Facility Workflow (Single-Room vs Dual-Room)
Determine whether your cultivation architecture separates vegetative and flowering canopies into dedicated spaces. If operating a perpetual harvest cycle with separate rooms, specify 5000K for mother/veg rooms and 3000K (with supplemental 660nm red) for bloom rooms. If operating a single-room seed-to-harvest cycle, specify a versatile 3500K to 4000K broad-spectrum fixture.
Step 2: Request the Laboratory SPD Chart and Diode Bill of Materials
Never purchase a commercial luminaire without reviewing an accredited laboratory test report (such as an LM-79 report). Verify the following criteria:
- Blue Flux Fraction (400-500nm): Ensure the blue waveband represents 15% to 20% for full-cycle fixtures, or 25%+ for dedicated vegetative arrays.
- Deep Red Peak (660nm): Confirm the presence of dedicated monochromatic 660 nm diodes to ensure high Photosystem II quantum yield.
- Photosynthetic Photon Efficacy (PPE): Ensure overall fixture efficacy meets or exceeds 2.6 μmol/J (with top-tier fixtures exceeding 2.8 to 3.1 μmol/J).
Step 3: Audit Color Rendering for Facility Scouting
Confirm that white diode packages provide a Color Rendering Index between 70 and 80. This provides clean, comfortable illumination that allows technicians to identify early signs of spider mites, powdery mildew, and nutrient chlorosis without suffering the severe efficacy penalties associated with CRI 95+ museum lighting.
Step 4: Field Verification with a Spectroradiometer
Once fixtures are installed, perform a multi-point canopy scan using a portable spectroradiometer. Verify that the delivered photon flux at canopy height matches your targeted DLI and that spectral distribution remains uniform across both the center and perimeter of the trellised footprint.
Grow Light CCT and Spectral Evaluation Checklist
- Identify room purpose: nursery/veg (5000K), single-source (3500K-4000K), or dedicated bloom (3000K + 660nm).
- Demand third-party NVLAP-accredited integrating sphere test reports (LM-79) from the manufacturer.
- Verify photosynthetic photon efficacy meets or exceeds 2.6 μmol/J across the full 400 to 700 nm waveband.
- Check the Spectral Power Distribution (SPD) graph to confirm a pronounced 660 nm deep red peak.
- Ensure white diodes maintain CRI between 70 and 80 to balance human scouting accuracy with high electrical efficacy.
- Confirm fixture is qualified on the DesignLights Consortium (DLC) Horticultural Qualified Products List.
- Audit cultivar stretch history to match Kelvin ratings to specific genetic elongation tendencies.
- Perform post-installation canopy irradiance mapping to confirm uniform PPFD and spectral delivery across trellises.
Applying this rigorous procurement protocol prevents commercial operators from succumbing to marketing slogans. By evaluating luminaires through the dual lenses of semiconductor physics and canopy photobiology, head growers maximize their grams-per-watt efficiency while ensuring plants develop compact, manageable branch structures that support heavy floral clusters.
Furthermore, standardizing spectral specifications across multi-room cultivation facilities simplifies ongoing facility maintenance, streamlines replacement parts inventory, and establishes repeatable operational baselines across successive cultivation cycles.
Weedth Verdict: Correlated Color Temperature is a useful human classification tool, but it is not a metric of plant photosynthetic performance. Cannabis does not grow on Kelvin ratings: it thrives on balanced photon ratios across discrete nanometer wavebands. For single-source facilities, a 3500K to 4000K broad-spectrum white fixture supplemented with 660 nm deep red provides the ultimate balance of vegetative stretch control, deep canopy green penetration, and massive floral biomass accumulation.
Developing deep mastery of horticultural lighting requires understanding that every photon delivered to your crop represents an ongoing electrical expenditure. When you invest in luminaires engineered around plant action spectra rather than human visual brightness, your cultivation facility achieves superior harvest quality, higher cannabinoid potency, and lower operating costs.
To continue building your cultivation mastery with our companion foundational guides on indoor grow mediums, cannabis plant morphology, and environmental setup, explore our educational resources below:
Share this article
A quick overview of the topics covered in this article.
Follow us
Latest articles
October 29, 2026
October 29, 2026
October 29, 2026