
Cannabis Leaf Tissue Testing Guide: Petiole Sap Analysis, Dry-Matter Benchmarks, and Laboratory Interpretation
Key Cultivation Principle
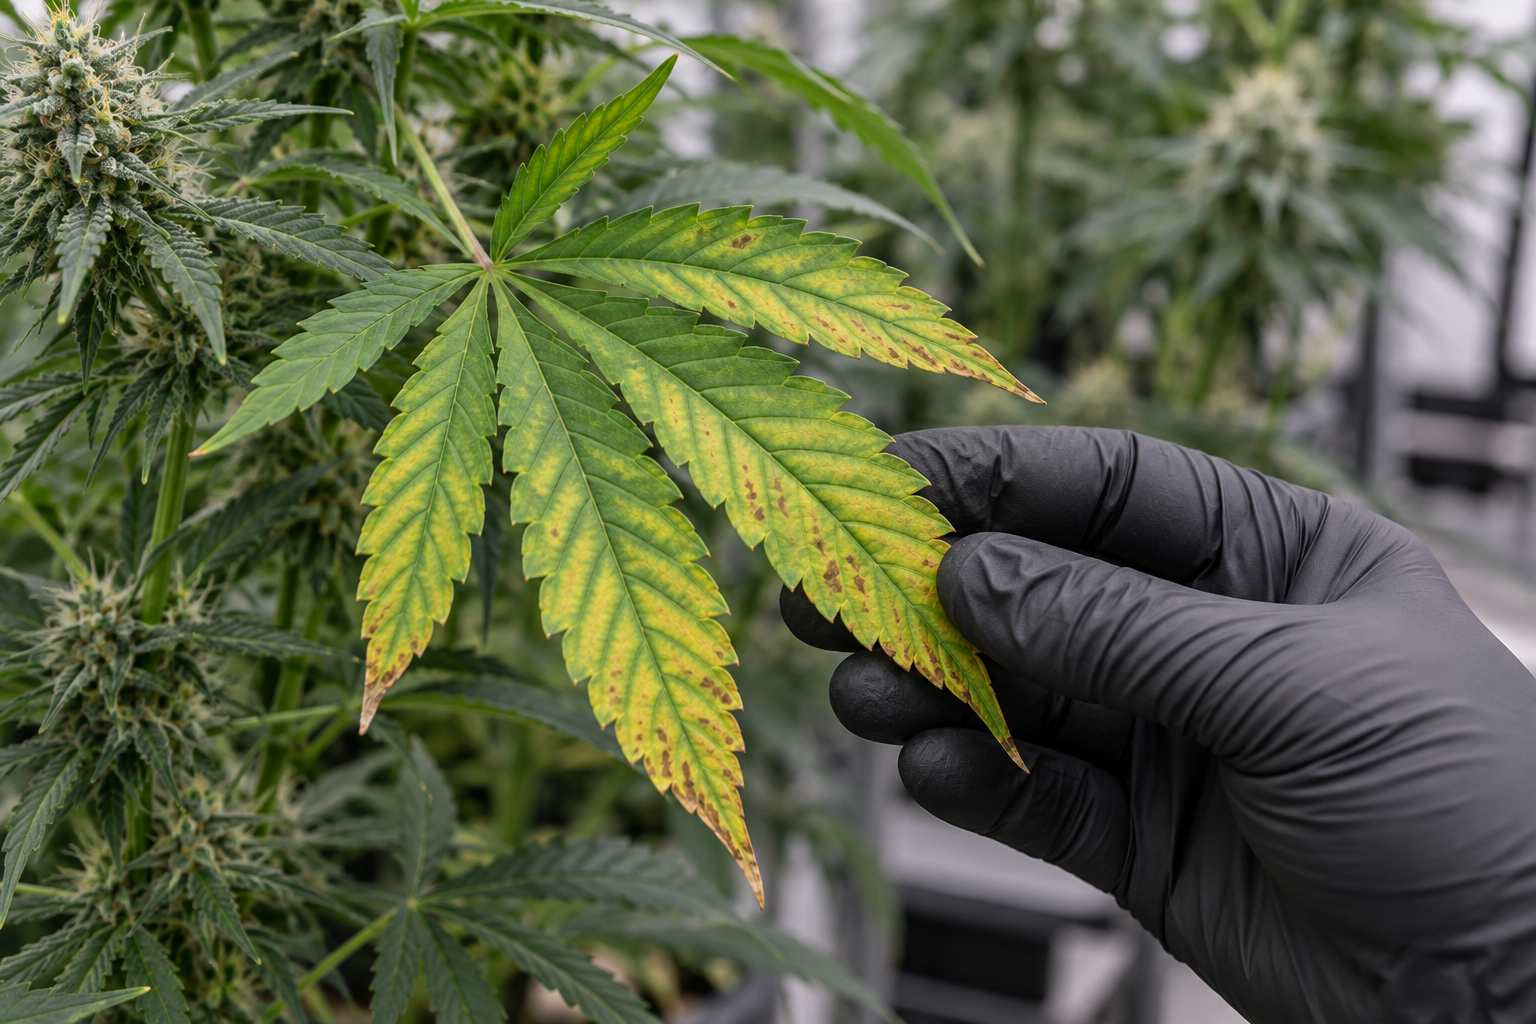
Visual crop scouting and leachate electrical conductivity (EC) testing only provide indirect indicators of plant nutritional health. By the time foliar symptoms such as interveinal chlorosis, marginal necrotic spotting, or purple petioles manifest on cannabis foliage, metabolic stress has already compromised cellular division, thylakoid membrane efficiency, and potential floral biomass. Cannabis leaf tissue testing represents the gold standard diagnostic methodology for commercial cultivation, measuring the actual accumulated concentration of essential elements within plant cellular structures. Utilizing Inductively Coupled Plasma Optical Emission Spectrometry (ICP-OES) for mineral cations and combustion analysis for total nitrogen and sulfur, laboratory tissue testing establishes internal nutritional benchmarks across every phenological stage. Additionally, on-site petiole sap analysis with ion-selective electrode (ISE) meters enables real-time, same-day verification of nitrate and potassium translocation velocity. This technical manual details standardized field sampling protocols, defines stage-specific dry-weight sufficiency ranges (CSR), breaks down ion interaction mechanics, and establishes a clinical workflow to translate laboratory tissue reports into precision fertilizer adjustments.
Direct Scope: Why Tissue Testing Supersedes Visual Diagnosis
In Commercial Cannabis Production Facilities Relying
In commercial cannabis production facilities, relying on visual inspection to identify nutritional imbalances is a reactive, yield-limiting practice. Visual symptoms represent the absolute end-stage failure of plant homeostatic buffering. When a fan leaf develops visible interveinal chlorosis from magnesium deficiency, the plant has already spent 7 to 14 days cannibalizing chlorophyll molecules in lower foliage to mobilize magnesium ions toward expanding shoot meristems. By the time human eyes detect the yellowing, photosynthetic carbon fixation rates across the canopy have already degraded by 15% to 25%.
Furthermore, visual leaf symptoms are notorious for mimicking multiple unrelated physiological stressors. Marginal leaf necrosis can be caused by excessive root-zone potassium salinity, acute calcium deficiency, root hypoxia from waterlogged substrate, or atmospheric drought driven by high vapor pressure deficit (VPD). Attempting to fix these ambiguous foliar cues with guesswork or commercial bloom boosters frequently compounds the underlying imbalance, transforming a minor cation drift into a catastrophic multi-element lockout.
“When working on in commercial cannabis production facilities relying in my home grow, how do I know if my current setup is drifting out of range before visible plant stress appears?”
Question sent by: Beau Caldwell, via reader Q&A form.
Start by taking a direct baseline measurement rather than guessing from foliar symptoms alone. In practice, When a fan leaf develops visible interveinal chlorosis from magnesium deficiency, the plant has already spent 7 to 14 days cannibalizing chlorophyll molecules in lower foliage to mobilize magnesium ions toward expanding shoot meristems.
Once you have confirmed the baseline reading, adjust only one variable at a time and log the response over the next 24 to 48 hours. By integrating bi-weekly tissue testing into cultivation SOPs, commercial growers can proactively tune fertilizer formulations, track cultivar-specific assimilation traits, and verify the biological efficacy of root-zone inputs.
From an Agronomic Economics Perspective Sub-clinical Nutrient
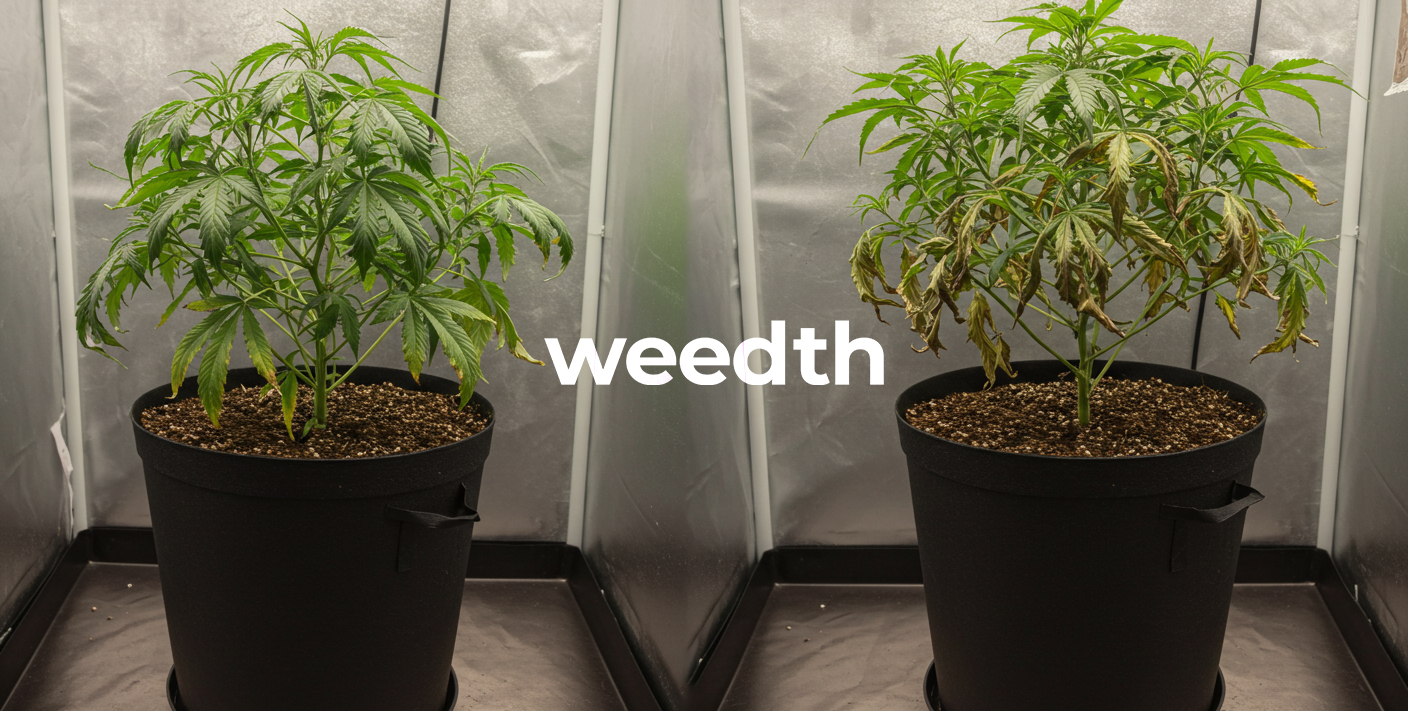
From an agronomic economics perspective, sub-clinical nutrient deficiency – often termed hidden hunger – quietly robs facilities of substantial revenue. During hidden hunger, plants display vibrant green foliage and exhibit no obvious visual chlorosis or curling, yet lack the critical elemental concentrations required to maximize RuBisCO carboxylation efficiency and secondary metabolite synthesis. Peer-reviewed trials in controlled environment horticulture demonstrate that hidden hunger can reduce final flower dry weight by 8% to 14% and lower total cannabinoid accumulation by 1.5 to 2.5 percentage points. In a commercial facility producing 500 kilograms annually, this represents tens of thousands of dollars in unharvested biomass value.
Leaf tissue testing eliminates ambiguity by providing exact, quantitative measurements of elemental concentrations within dry plant matter. It maps the crop precisely along the classic agronomic yield curve (Macy, 1936), delineating the boundary between the Deficiency Zone, the Sufficiency Zone, the Luxury Consumption Zone, and the Toxicity Zone. By integrating bi-weekly tissue testing into cultivation SOPs, commercial growers can proactively tune fertilizer formulations, track cultivar-specific assimilation traits, and verify the biological efficacy of root-zone inputs.
Analytical Chemistry: ICP-OES, Dumas Combustion, and Petiole Sap ISE
To accurately interpret laboratory foliar analysis, cultivators must understand the analytical chemistry instruments and methodologies employed by certified agricultural testing laboratories.
1. Inductively Coupled Plasma Optical Emission Spectrometry (ICP-OES)
ICP-OES is the premier analytical standard for quantifying elemental minerals in dried plant tissue. Upon arrival at the laboratory, leaf samples are oven-dried at 60 °C to 65 °C for 24 to 48 hours to remove all moisture, and then pulverized into a fine, homogeneous powder. A weighed aliquot (typically 0.25 to 0.50 grams) undergoes high-temperature microwave acid digestion using concentrated nitric acid (HNO3) and hydrogen peroxide (H2O2) to completely dissolve organic carbon matrices into an aqueous mineral solution.
“I am trying to dial in 1. inductively coupled plasma optical emission spectrometry (icp-oes) for my indoor tent, what is the most reliable measurement to check first so I do not overcorrect?”
Question sent by: GrandePrairieGrow, via grow journal submission.
Start by taking a direct baseline measurement rather than guessing from foliar symptoms alone. In practice, Upon arrival at the laboratory, leaf samples are oven-dried at 60 °C to 65 °C for 24 to 48 hours to remove all moisture, and then pulverized into a fine, homogeneous powder.
Once you have confirmed the baseline reading, adjust only one variable at a time and log the response over the next 24 to 48 hours. Nitrogen cannot be measured accurately via standard acid digestion because volatile nitrogen gases escape during thermal breakdown.
This digested liquid is nebulized into an aerosol and injected into an argon plasma torch operating at extreme temperatures (6,000 to 10,000 Kelvin). At these temperatures, mineral atoms and ions are thermally excited and emit light at wavelengths unique to each chemical element (such as 766.49 nm for potassium, 393.37 nm for calcium, and 285.21 nm for magnesium). Spectrometric detectors quantify the optical intensity of these emitted wavelengths, providing parts-per-million (mg/kg) accuracy across all macro-cations, phosphorus, and micronutrients (Fe, Mn, Zn, Cu, B, Mo).
2. Dumas High-Temperature Combustion Analysis for Nitrogen and Sulfur
Nitrogen cannot be measured accurately via standard acid digestion because volatile nitrogen gases escape during thermal breakdown. Instead, commercial laboratories utilize the Dumas combustion method (automated carbon-nitrogen-sulfur analyzers). A dried, weighed tissue sample is combusted in a pure oxygen chamber at 900 °C to 1,000 °C, converting all organic nitrogen into nitrogen gas (N2) and nitrogen oxides (NOx). After passing through copper reduction columns, the total nitrogen gas is measured via a thermal conductivity detector (TCD), providing total elemental nitrogen expressed as a precise percentage of dry tissue mass (% dry weight).
3. Petiole Sap Ion-Selective Electrode (ISE) Analytics
While laboratory dry-matter analysis provides comprehensive historical mineral accumulation over days and weeks, on-site petiole sap testing provides an instantaneous snapshot of current ionic translocation. By harvesting leaf petioles, crushing them with a mechanical sap press, and applying fresh sap droplets onto portable ion-selective electrode (ISE) meters (such as Horiba LAQUAtwin meters), growers can measure dissolved nitrate (NO3–) and potassium (K+) concentrations in parts-per-million within 90 seconds right inside the greenhouse.
Petiole sap reflects what the plant is transporting in its xylem and phloem pipelines at that exact moment. A low petiole sap reading indicates immediate transpirational or root uptake failure, allowing growers to correct irrigation EC days before dry-matter concentrations drop.

Standardized Sampling SOP: The Most Recently Matured Leaf (MRML)
The single greatest source of error in plant tissue testing is improper sampling technique. Mineral concentrations vary dramatically across plant architecture based on leaf age, canopy position, and mobility within vascular tissues. Mobile elements (such as nitrogen, phosphorus, and potassium) are naturally translocated from older, lower leaves to young upper leaves during stress. Conversely, immobile elements (such as calcium, boron, and iron) remain locked within mature leaf cells, showing acute depletion only in newly expanding meristems.
To obtain repeatable, scientifically valid data that correlates with published sufficiency ranges, cultivators must strictly harvest the Most Recently Matured Leaf (MRML).
“My grow room logs look stable on paper, but I am still unsure about step-by-step mrml sampling workflow. Should I adjust my equipment settings immediately or run a baseline verification test first?”
Question sent by: Beau Sanderson, via email.
Start by taking a direct baseline measurement rather than guessing from foliar symptoms alone. In practice, The single greatest source of error in plant tissue testing is improper sampling technique.
Once you have confirmed the baseline reading, adjust only one variable at a time and log the response over the next 24 to 48 hours. To obtain repeatable, scientifically valid data that correlates with published sufficiency ranges, cultivators must strictly harvest the Most Recently Matured Leaf (MRML) .
Step-by-Step MRML Sampling Workflow
- Identify the Correct Node: Locate the main apical stem or major lateral shoot. Count down from the terminal growing tip. The very newest leaves at nodes 1 and 2 are juvenile and rapidly dividing; they have not completed structural cell wall synthesis. The optimal MRML sample is located at the 4th or 5th node from the top. At this node, the leaf is fully expanded, dark green, and has reached maximum photosynthetic carbon fixation capacity.
- Sanitation and Personal Protective Equipment: Operators must wear powder-free, disposable nitrile gloves. Human skin secretes high concentrations of sodium chloride (NaCl), which can artificially spike sodium and chloride readings on laboratory reports. Rinse harvesting shears with 70% isopropyl alcohol and deionized water between cultivar batches.
- Harvest Lamina and Petiole: Snip the leaf cleanly at the junction where the petiole attaches to the main stem. Both the leaf blade (lamina) and petiole should be included unless the laboratory specifies petiole separation.
- Sample Size and Replication: Never submit a single leaf from one plant. A representative diagnostic sample requires harvesting 15 to 25 leaves collected randomly from identical canopy positions across 10 to 15 plants within the same cultivar lot and fertigation zone.
- Decontamination Rinse: If foliar sprays, beneficial microbial products, or pest control oils have been applied within the preceding 14 days, gently wash the harvested leaves in a bath of 0.1% non-phosphate detergent, followed by two thorough rinses in deionized or reverse osmosis water. Blot dry immediately with lint-free paper towels. Unwashed foliar deposits will register false-positive spikes for iron, zinc, or potassium.
- Packaging and Shipping: Place dry leaves into clean, breathable paper bags. Never seal fresh plant tissue in airtight plastic bags; trapped moisture promotes rapid anaerobic bacterial decay, causing tissue rot and volatile nitrogen loss during transit. Ship via overnight courier to the analytical laboratory.
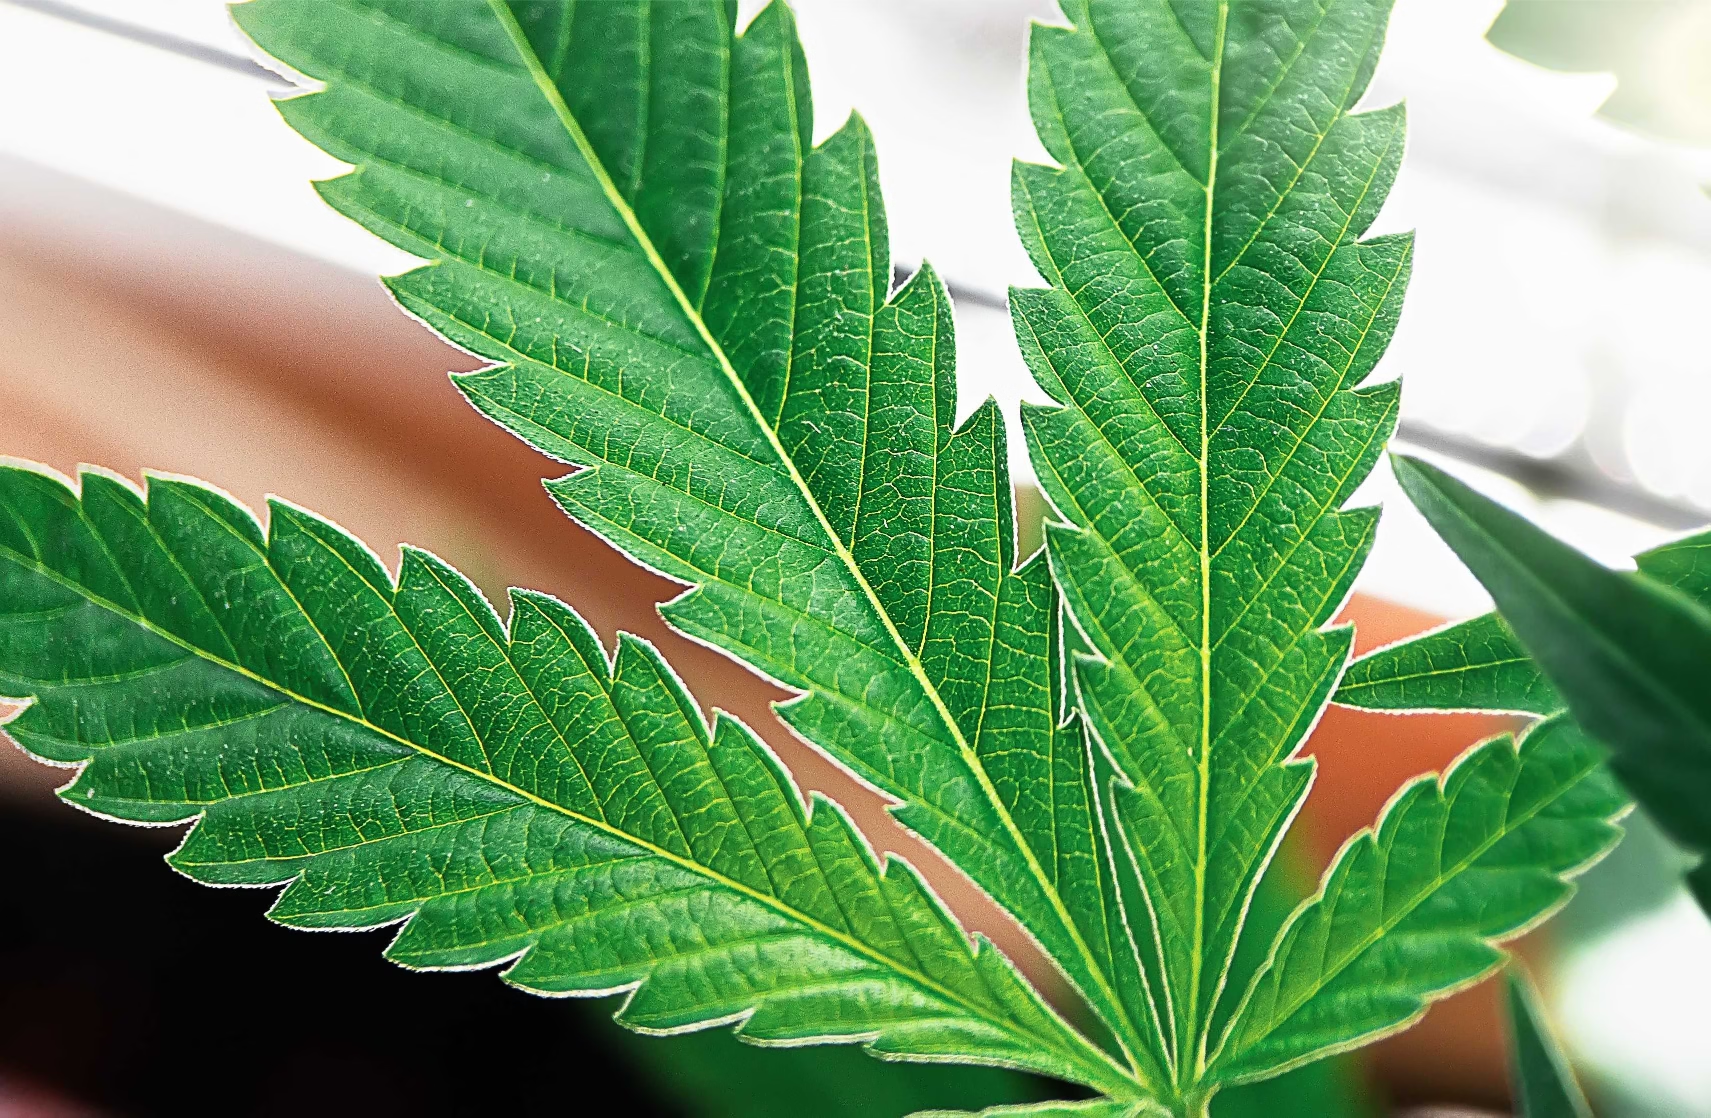
Cannabis Critical Nutrient Sufficiency Ranges (CSR Matrix)
Interpreting a Laboratory Tissue Report
Interpreting a laboratory tissue report requires comparing measured values against verified Critical Nutrient Sufficiency Ranges (CSR). Values falling below the sufficiency range indicate hidden hunger or acute deficiency, while values exceeding the range indicate luxury consumption, potential cation toxicity, or competitive antagonism with other minerals.
The Following Empirical Matrix
The following empirical matrix establishes established dry-weight sufficiency benchmarks across the three primary developmental stages of indoor cannabis cultivated under high-PPFD LED fixtures (800 to 1,100 μmol/m2/s) and enriched carbon dioxide (1,000 to 1,200 ppm CO2):
| Essential Element | Vegetative Stage (Weeks 1-4) | Early/Mid Flower (Weeks 1-5) | Late Flower (Weeks 6-9) | Deficiency Threshold | Toxicity / Excess Threshold |
|---|---|---|---|---|---|
| Total Nitrogen (% N) | 4.2% – 5.4% | 3.5% – 4.5% | 2.2% – 3.2% | < 3.0% (Veg) | > 5.8% (All stages) |
| Phosphorus (% P) | 0.35% – 0.55% | 0.40% – 0.60% | 0.30% – 0.45% | < 0.28% | > 0.80% (Lockout risk) |
| Potassium (% K) | 3.2% – 4.6% | 3.8% – 5.2% | 2.8% – 3.8% | < 2.5% | > 5.6% (Ca/Mg antagonism) |
| Calcium (% Ca) | 1.6% – 2.6% | 1.8% – 2.8% | 2.0% – 3.2% | < 1.2% | > 3.8% |
| Magnesium (% Mg) | 0.50% – 0.80% | 0.55% – 0.85% | 0.40% – 0.65% | < 0.35% | > 1.10% |
| Sulfur (% S) | 0.30% – 0.55% | 0.35% – 0.60% | 0.30% – 0.50% | < 0.22% | > 0.90% |
| Iron (mg/kg Fe) | 90 – 160 ppm | 80 – 150 ppm | 70 – 130 ppm | < 60 ppm | > 300 ppm |
| Manganese (mg/kg Mn) | 45 – 110 ppm | 50 – 120 ppm | 40 – 100 ppm | < 30 ppm | > 250 ppm |
| Zinc (mg/kg Zn) | 35 – 75 ppm | 30 – 70 ppm | 25 – 60 ppm | < 20 ppm | > 180 ppm |
| Boron (mg/kg B) | 30 – 65 ppm | 35 – 70 ppm | 30 – 60 ppm | < 20 ppm | > 110 ppm (Severe toxicity) |
| Copper (mg/kg Cu) | 7 – 18 ppm | 6 – 15 ppm | 5 – 12 ppm | < 4 ppm | > 40 ppm |
| Molybdenum (mg/kg Mo) | 0.5 – 2.0 ppm | 0.5 – 2.0 ppm | 0.3 – 1.5 ppm | < 0.2 ppm | > 8.0 ppm |
Grower Question: Interpreting High Nitrogen Tissue Reports in Mid-Bloom
“How do we correct a 4.9% tissue nitrogen level in Week 5 of flower without crashing our phosphorus and potassium?”
Question sent by: Beau Poirier, via email.
“We just got our laboratory tissue analysis back for our Week 5 flowering room (an elite OG Kush cross in rockwool slabs). The report shows total Nitrogen at 4.9% dry weight, which is flagged as critically high. Our colas look overly dark green with slight downward clawing, but our Potassium is right at 3.9% and Phosphorus is 0.42%. We want to slash nitrogen immediately, but our base fertilizer combines nitrogen with calcium (calcium nitrate). If we cut calcium nitrate, how do we keep our calcium levels from crashing during peak flower?”
Devon, your tissue report confirms a classic commercial dilemma: calcium-nitrogen coupling. In standard two-part fertilizer programs, calcium is almost universally supplied as calcium nitrate [5Ca(NO3)2·NH4NO3]. When cultivators push calcium to satisfy the high transpiration demands of LED lighting, they inadvertently oversupply nitrate nitrogen, driving tissue N up to 4.9% in mid-bloom. This suppresses terpene synthesis, causes nitrogen-induced foliar clawing, and increases susceptibility to bud rot.
To drop your tissue nitrogen cleanly while fiercely protecting your calcium levels, execute these three targeted agronomic adjustments:
Diagnosing Hidden Hunger, Antagonisms, and the Dilution Effect
Analyzing a tissue report requires moving beyond isolated elemental numbers to evaluate stoichiometric ratios and physiological phenomena that alter tissue concentrations independently of root-zone fertility.
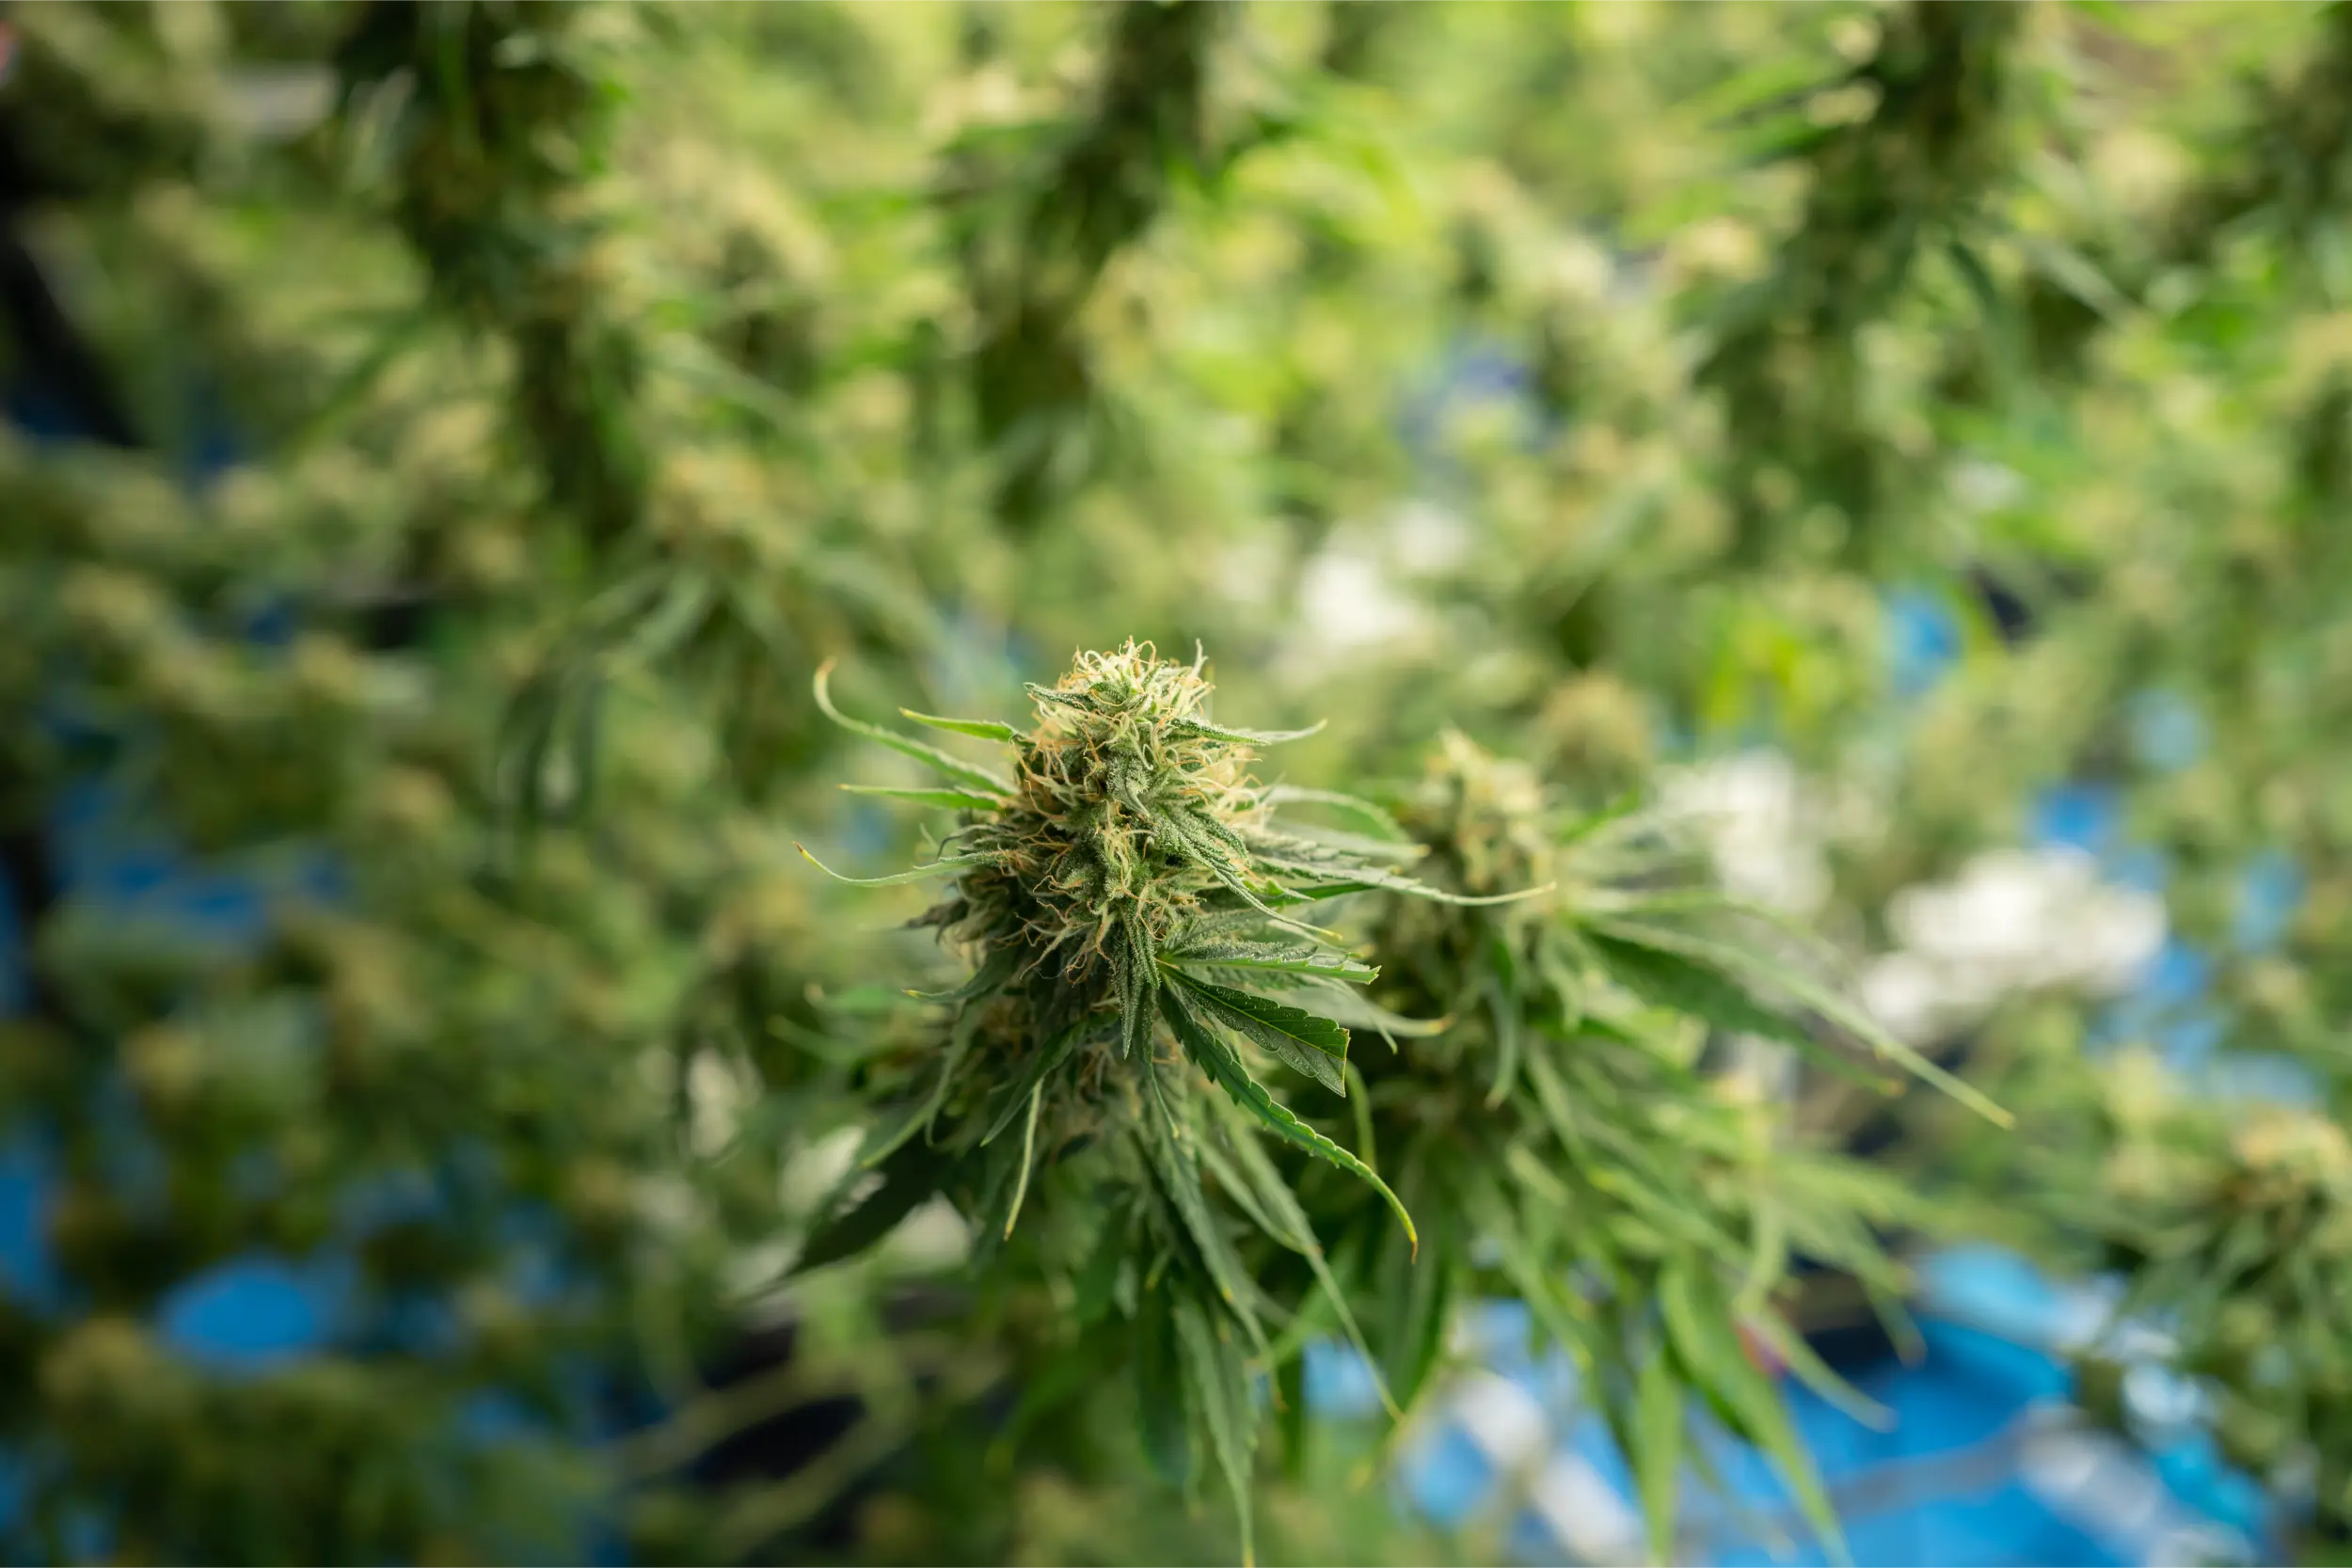
1. The Cation Triad Stoichiometry (K : Ca : Mg)
Because potassium, calcium, and magnesium compete for cell-membrane transport proteins and intracellular storage space, their ratios in dry leaf tissue dictate metabolic balance. On an elemental dry-weight basis, healthy cannabis leaf tissue during early-to-mid bloom exhibits the following stoichiometric equilibrium:
- Potassium-to-Calcium Ratio (K:Ca): Should range strictly between 1.4:1 and 1.8:1. If tissue K:Ca exceeds 2.2:1, excessive potassium accumulation will induce secondary calcium starvation in rapidly expanding floral bracts, causing marginal tip burn. If K:Ca drops below 1.1:1, potassium deficiency will restrict stomatal conductance and sugar transport.
- Calcium-to-Magnesium Ratio (Ca:Mg): Should remain between 2.8:1 and 3.5:1. When tissue Ca:Mg exceeds 4.5:1, elevated calcium competitively displaces magnesium from RuBisCO and chlorophyll binding sites, producing pronounced interveinal chlorosis across middle canopy fan leaves.
2. Critical Micronutrient Interactions and Competitive Translocation
Micronutrients operate as vital cofactors for electron transport, enzymatic activation, and hormone synthesis. However, tissue tests frequently expose complex micronutrient antagonisms:
- Phosphorus-Zinc Antagonism: When tissue phosphorus climbs above 0.70% P due to heavy PK booster usage, orthophosphate ions readily react with divalent zinc within root xylem vessels, precipitating insoluble zinc phosphate [Zn3(PO4)2]. This immobilizes zinc before it reaches the shoot apical meristem. The tissue test reveals low zinc (<20 ppm Zn) alongside very high phosphorus, leading to shortened internodes, resetting leaf rosettes, and interveinal bleaching.
- Iron-Manganese Redox Equilibrium: Iron and manganese share identical divalent transport pathways and participate in photosynthetic electron transport. If tissue iron exceeds 250 ppm Fe while manganese remains at 35 ppm Mn, the excess iron outcompetes manganese for binding sites on oxygen-evolving complex (OEC) proteins in photosystem II, producing induced manganese deficiency. Commercial cannabis foliage maintains optimal photosynthetic kinetics when the Fe:Mn tissue ratio is held between 1.5:1 and 2.5:1.
- Boron-Calcium Structural Synergism: Boron acts as an essential chemical bridge, cross-linking pectic polysaccharides (specifically rhamnogalacturonan-II, RG-II) in plant primary cell walls alongside calcium. If tissue boron drops below 25 ppm B, calcium pectate cross-links fail to stabilize, resulting in brittle stems and distorted, fragile floral bracts even if tissue calcium is ostensibly adequate.
3. The Biomass Dilution Effect (Steenbjerg Phenomenon)
Cultivators must recognize the biomass dilution effect when reviewing tissue reports during explosive vegetative and transition growth. If an environmental upgrade (such as introducing 1,200 ppm CO2 enrichment and boosting PPFD from 500 to 900 μmol/m2/s) causes canopy dry biomass to double within six days, the plant’s total volume of fixed carbohydrates increases exponentially. Even if root mineral absorption proceeds at high speed, the accumulated minerals are diluted across a vastly larger volume of physical cellular matter.
Consequently, a tissue report may indicate that nitrogen dropped from 4.8% down to 3.6% and phosphorus dropped from 0.45% to 0.32%, despite the plant appearing healthy and vigorous. In this scenario, the crop is not experiencing true nutritional starvation; rather, carbon assimilation is simply outpacing mineral delivery. Cultivators should step up fertigation frequency and increase input EC by 0.2 to 0.3 dS/m to realign mineral flux with accelerated photosynthetic velocity.
4. Diagnostic Comparison: Tissue vs Petiole Sap vs Runoff Leachate
To implement a world-class cultivation diagnostics program, growers must deploy each testing modality for its intended biological purpose:
| Diagnostic Method | What It Measures | Lag Time / Turnaround | Primary Operational Value |
|---|---|---|---|
| Substrate Leachate Runoff (EC / pH) | Pore-water salt concentration and chemical solubility in root zone. | Instantaneous (daily during irrigation). | Identifies salt accumulation, dry-back behavior, and root-zone acidification. |
| Petiole Sap Analytics (ISE / Brix) | Unassimilated ionic flux migrating through xylem/phloem. | Real-time (90 seconds on-site with handheld meter). | Detects immediate transpiration bottlenecks and day-to-day feeding swings. |
| Dry-Matter Leaf Tissue (ICP-OES / Dumas) | Total accumulated elemental mass assimilated into cellular structures. | 3 to 5 business days (off-site laboratory). | Definitive gold standard for long-term nutrient auditing, hidden hunger, and recipe formulation. |
On-Site Petiole Sap Refractometry and Ion-Selective Analytics
Commercial facilities cannot wait five days for off-site laboratory ICP-OES results when diagnosing acute, fast-moving crop anomalies. On-site petiole sap testing provides an immediate, reliable operational bridge.
Petiole sap analysis measures the concentration of unassimilated inorganic ions currently migrating through the petiole’s xylem vessels toward the leaf blade. By conducting petiole sap testing twice per week at a standardized time (specifically between 10:00 AM and 11:30 AM, two hours after lights-on, when transpiration is fully stabilized), growers establish a real-time metabolic trendline:
- Petiole Nitrate (NO3-N): In vegetative growth, petiole sap nitrate should measure between 800 and 1,200 mg/L (ppm). During mid-bloom (Weeks 4-5), sap nitrate should taper down to 400 to 600 ppm. In late flower (Weeks 7-9), sap nitrate drops below 150 ppm as the plant shifts toward natural senescence.
- Petiole Potassium (K+): Sap potassium should hold steady at 3,500 to 4,500 mg/L (ppm) throughout vegetative growth, surging up to 4,500 to 5,500 ppm during mid-flowering calyx swelling. If petiole sap potassium drops below 3,000 ppm during Week 5, calyx bulking will stall immediately.
- Sap Brix (Dissolved Carbohydrates): Using a digital optical refractometer on freshly extracted petiole sap measures total dissolved solids (predominantly sucrose, glucose, and organic acids). Healthy vegetative cannabis sap Brix typically ranges from 4.0% to 7.0% Brix, rising to 8.0% to 12.0% Brix during peak floral bulking under elevated CO2. A sudden drop in sap Brix below 3.5% indicates photosynthetic inhibition caused by low light, root hypoxia, or cold substrate temperatures.
2. Petiole Meter Calibration and Operational Quality Control
Ion-selective electrode (ISE) sensors operate based on the Nernst equation, measuring potential differences across a specialized polymer membrane containing selective ionophores. To guarantee clinical analytical precision in greenhouse environments, technicians must observe strict calibration protocols:
- Dual-Point Calibration: Prior to each testing session, calibrate the nitrate and potassium sensors using fresh, certified standard calibration fluids (typically 150 mg/L and 2,000 mg/L reference standards). Calibration must occur at the same ambient temperature as the testing area (ideally 20 °C to 24 °C) to prevent thermal slope drift.
- Preventing Membrane Fouling: Cannabis petiole sap contains high concentrations of complex latex resins, waxes, and pectins that rapidly adhere to the ion-selective sensor surface. Between each sample, flush the electrode well thoroughly with deionized water and gently blot dry with lint-free lens paper. Never rub or scrape the delicate sensor membrane.
- Sample Volume Consistency: Deliver exactly 0.2 to 0.3 mL of filtered, debris-free sap onto the flat sensor pad using a micropipette. Allow exactly 60 seconds for sensor potential equilibration before logging the stabilized digital reading.
Translating Tissue Reports into Root-Zone Recipe Adjustments
When a laboratory tissue report reveals values outside the critical sufficiency range, execute this structured remediation workflow:
Phase 1: Correlate Tissue Data with Leachate Runoff
Cross-reference the tissue report against your daily root-zone leachate logs. If leaf tissue calcium is deficient (<1.4% Ca) but leachate EC is elevated (+1.0 dS/m above input) and runoff potassium is very high, the root zone does not lack calcium. Rather, excessive potassium is blocking calcium uptake at the root membrane. Adding more calcium nitrate would only elevate total salinity and worsen the blockage. The correct intervention is lowering input potassium and increasing the leaching fraction to sweep accumulated potassium salts from the root zone.
Phase 2: Correct Root-Zone pH First
If micronutrients (iron, manganese, zinc, or boron) test deficient, examine your substrate pH before altering fertilizer micronutrient concentrates. In soilless media, if leachate pH has drifted above 6.3, iron and manganese naturally precipitate into insoluble forms. Adjusting input fertigation pH to 5.7 to 5.8 for three consecutive feeding cycles dissolves precipitated mineral complexes and restores micronutrient uptake without risking metal toxicity from over-fertilization.
Phase 3: Stepped Fertilizer Reformulation
When adjusting elemental fertilizer ratios based on tissue tests, implement corrections in measured increments: adjust target elemental concentrations by no more than 15% to 20% per iteration. Allow 5 to 7 days for vascular translocation and cellular integration before re-testing tissue to verify recovery.
Standard Operating Verification Checklist
- Samples are harvested strictly from the Most Recently Matured Leaf (MRML) at node 4 or 5.
- Technicians wear clean, powder-free nitrile gloves to eliminate sodium chloride skin contamination.
- A minimum of 15 to 25 leaves are pooled per cultivar lot to ensure statistical canopy representation.
- Foliar residues are washed using 0.1% non-phosphate detergent followed by double deionized water rinses.
- Samples are packed in breathable paper bags; sealed airtight plastic containers are strictly prohibited.
- Total Nitrogen is verified via Dumas combustion; cations and micronutrients are analyzed via ICP-OES.
- Tissue K:Ca ratio is evaluated to ensure it remains balanced between 1.4:1 and 1.8:1.
- On-site petiole sap testing (ISE) is conducted twice weekly at a fixed morning time to monitor real-time ion flux.
- Tissue data is cross-referenced with daily root-zone leachate EC, pH, and environmental VPD logs.
- Fertilizer recipe adjustments are capped at 15% to 20% shifts per iteration, followed by verification testing in 7 days.
Tissue Testing Standard Operating Inspection Checklist
Enforce these standardized protocols across every tissue sampling cycle:
Scientific References
- Bernstein, N., Gorelick, J., Zerahia, R., & Koch, S. (2019). Impact of environmental conditions and nutrient availability on secondary metabolite production in medical cannabis. Industrial Crops and Products, 138, 111467.
- Bryson, G. M., Barker, A. V., & Mills, H. A. (2014). Plant Analysis Handbook IV: A Guide to Sampling, Preparation, Analysis and Interpretation for Agronomic and Horticultural Crops. Micro-Macro Publishing, Athens, GA.
- Bugbee, B. (2020). Toward an optimal spectral quality and nutritional regime for indoor cannabis cultivation. Frontiers in Plant Science, 11, 570.
- Havlin, J. L., Tisdale, S. L., Nelson, W. L., & Beaton, J. D. (2016). Soil Fertility and Fertilizers: An Introduction to Nutrient Management (8th ed.). Pearson, Boston, MA.
- Marschner, H. (2012). Marschner’s Mineral Nutrition of Higher Plants (3rd ed.). Academic Press, London.
- Saloner, A., & Bernstein, N. (2021). Nitrogen supply affects cannabinoid and terpene profile in medical cannabis. Industrial Crops and Products, 167, 113516.
- Zheng, Y. (2021). Handbook of Cannabis Production in Controlled Environments. CRC Press, Boca Raton, FL.
Share this article
A quick overview of the topics covered in this article.
Follow us
Latest articles
November 17, 2026
November 17, 2026
November 17, 2026

November 17, 2026