
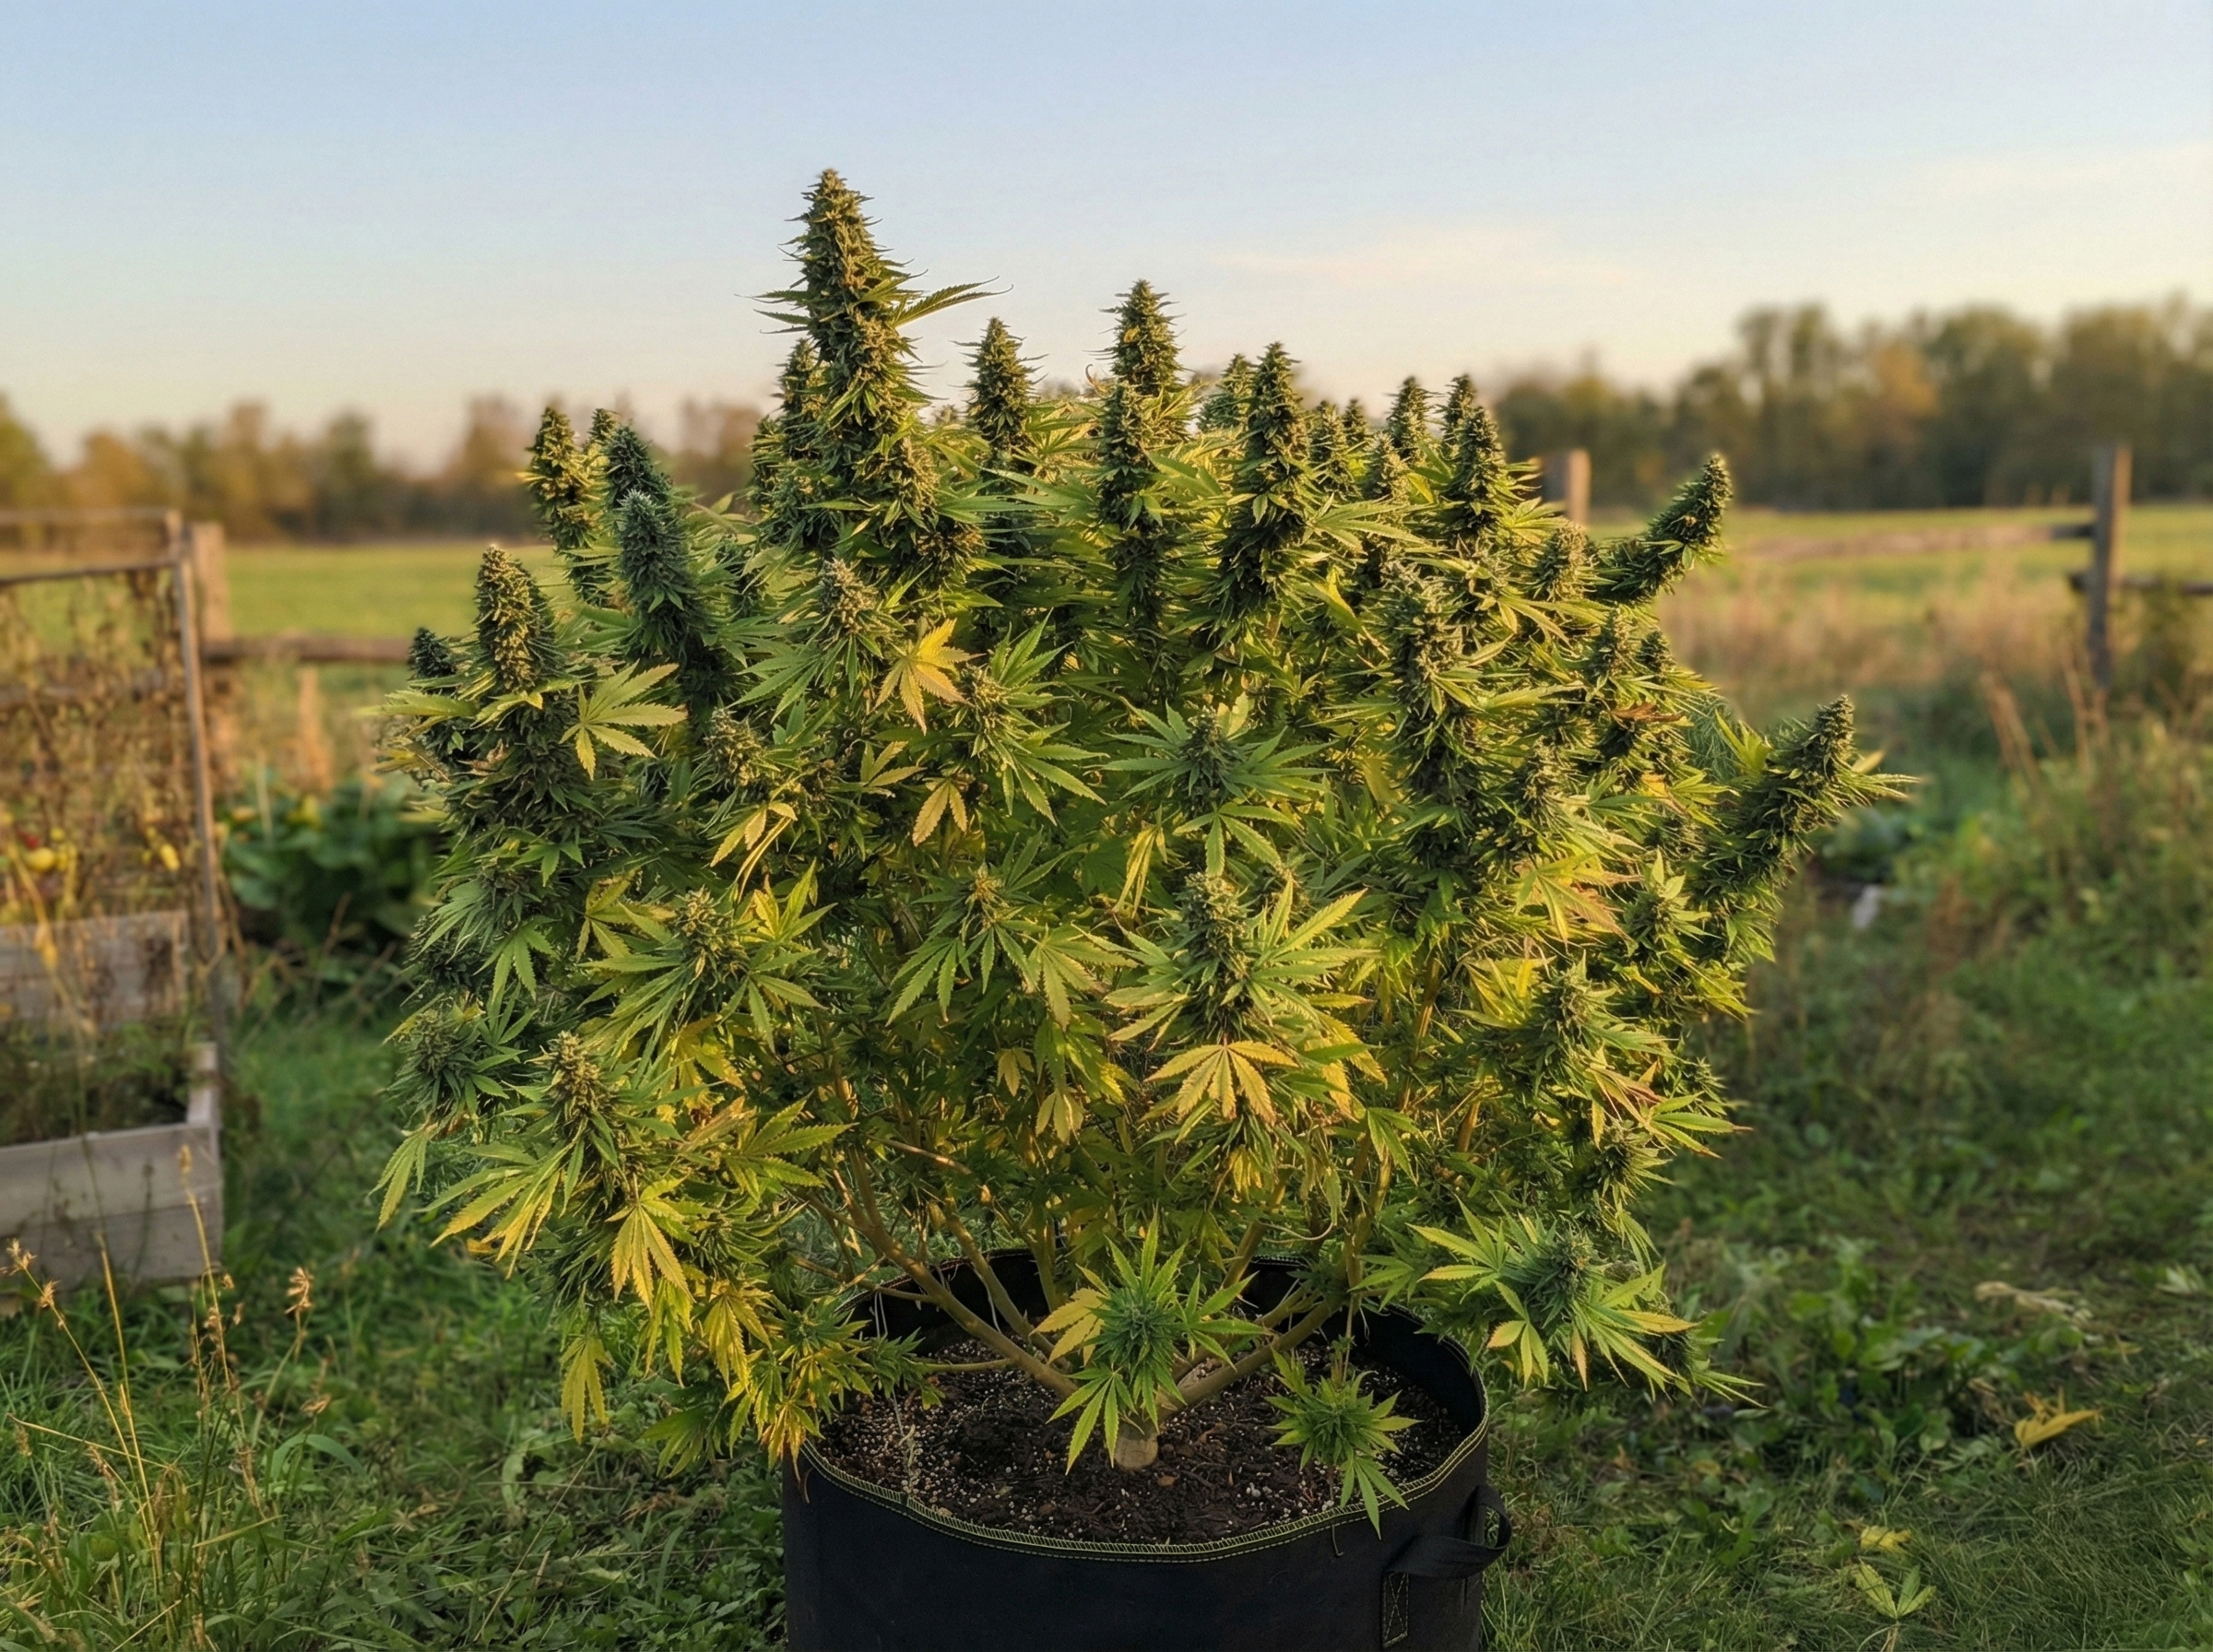
Outdoor Cannabis Grow Journal: Weather, Watering, Symptoms, Yield, and Season Review
A cannabis plant can look impressive in a September photograph and still leave its grower unable to explain what happened. Perhaps a lower branch wilted after a rainy week, one container needed twice as much irrigation as the others, or the harvest appeared enormous until the flower was dried and trimmed. Without dates, locations and comparable measurements, each event becomes a story reconstructed from memory. A useful outdoor grow journal preserves the evidence needed to tell a weather event from an irrigation fault, a genuine symptom from a temporary response, and a large wet harvest from a good usable dry yield.
You do not need laboratory equipment or a complicated app. You need plant IDs that survive the season, a brief baseline, a few measurements collected the same way, photographs that show change, an intervention log and a harvest record with clearly defined weight categories. A grow journal is not meant to produce a perfect explanation for every yellow leaf. Its value is that it makes an explanation testable. If symptoms began before a fertilizer change, the change cannot have caused their original appearance. If a supposedly watered plant sits beside an emitter that delivered half its normal flow, the irrigation system deserves attention before adding nutrients.
This resource is for lawful outdoor cultivation in ground soil, raised beds and containers. It explains a practical recordkeeping system and how to turn observations into a defensible season review. It is not a full irrigation prescription, a plant-disease encyclopedia or a cultivar-trial protocol. For the complete seasonal cultivation framework, see Weedth’s outdoor growing guide. We will use a journal to connect the decisions made within that larger process.
Give Every Observation a Question and a Baseline
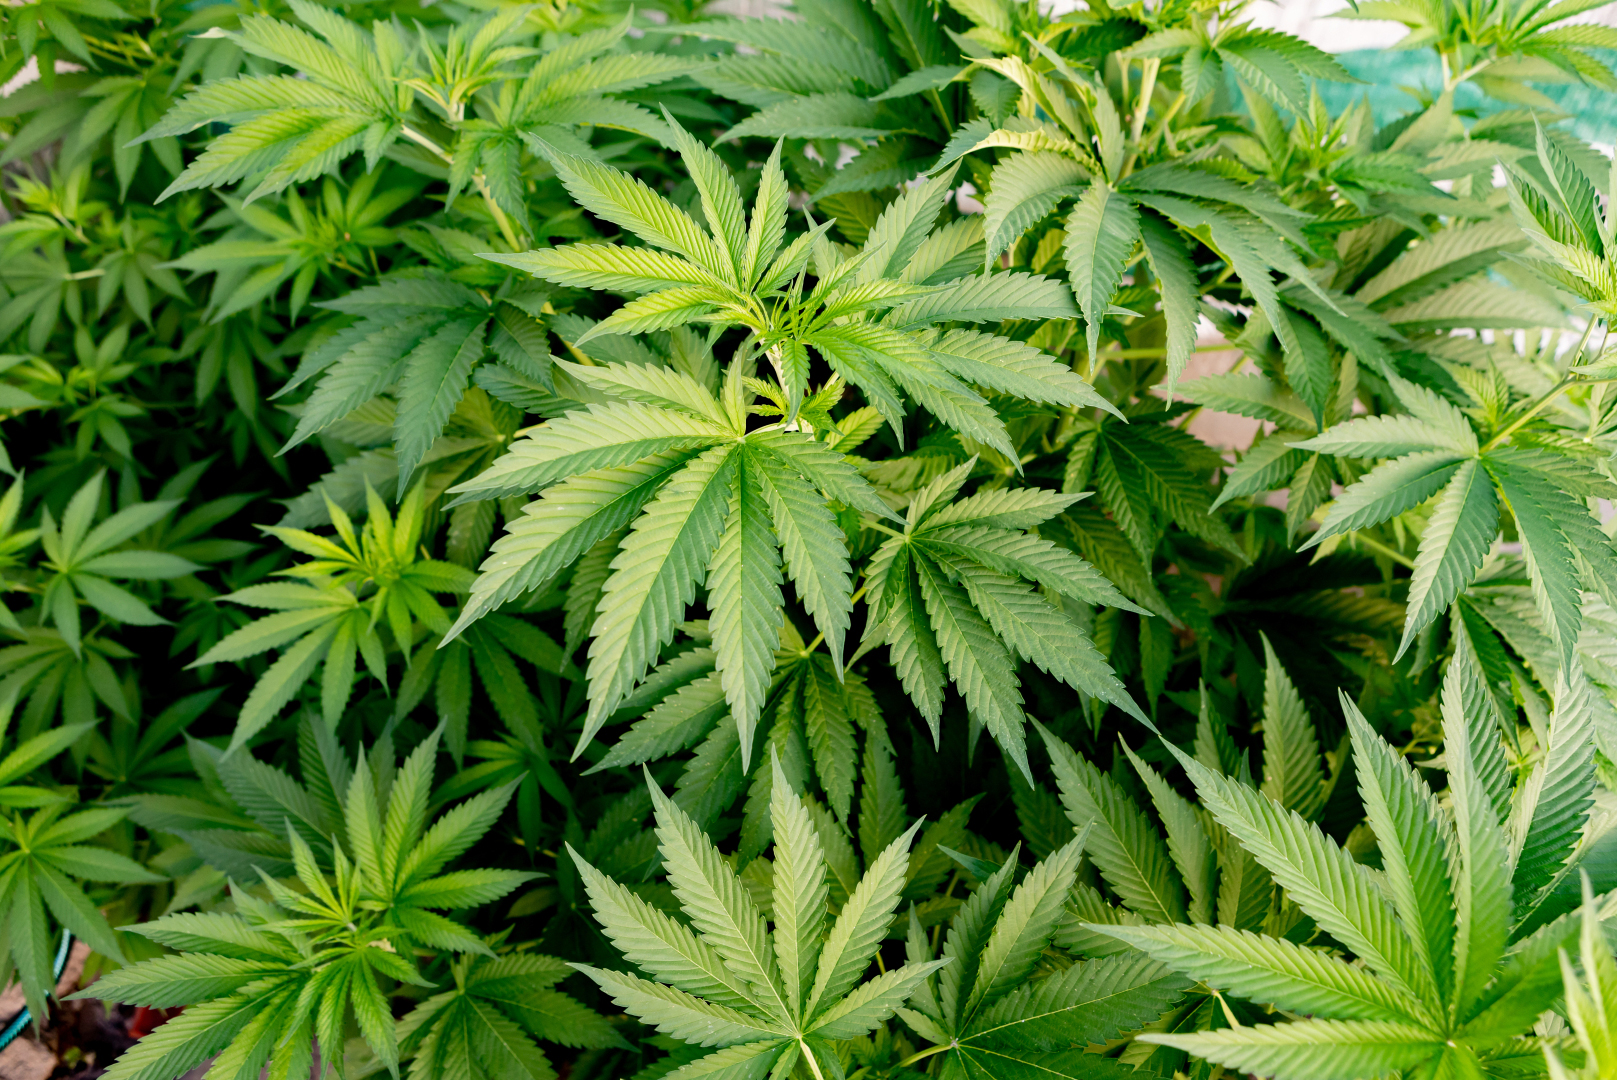
Before making the first daily entry, decide what the record must help you answer. For one garden, the main question may be whether a certain container size supports a mature plant through hot afternoons. For another it may be whether a shaded corner stays wet longer and repeatedly develops flower disease. A journal can document both, but only if its records connect a particular plant to a particular position, date and management event. An anonymous note such as “watered everybody, leaves droopy” loses almost everything you need for diagnosis.
Choose the unit you will follow all season
Use a unique plant ID for observations on individuals, and separate location or irrigation-zone IDs for observations shared across several plants. A tag such as P01 should refer to the same plant from transplant through final weighing, even if you move its container. The physical position can be B2, while the irrigation valve or hose zone is Z1. In a ground bed, identify fixed bed sections and representative plants rather than pretending one soil probe describes the whole site. In a large garden, the journal can contain both zone-level and plant-level data. Keep the distinction visible.
Record the source and claimed cultivar identity as supplied, including seed lot or clone source where available. A seed-grown plant is an individual, not an identical replicate of every other seed with the same label. Label a failed transplant, replacement or plant moved from a neighbor’s plot as a new or revised record. Do not reassign the retired plant’s ID and silently join the two growth histories. If a label disappears and identity cannot be reconstructed reliably, mark the identity unknown; a guessed ID is worse than an honest missing value.
Capture the baseline before the plants become large
Draw a rough map showing north, permanent structures, slope, access paths, water source, irrigation zones, prevailing exposure and every plant position. Mark obvious shade boundaries, reflected heat, low drainage points, overhead runoff and the nearest weather sensor. Record the baseline medium, container size or bed dimensions, amendment history, source-water type, irrigation method, planting date and initial health. For movable containers, record the date and reason whenever a pot changes position. This allows you to distinguish a plant response from a change in its surroundings.
Make the first photographs boring and repeatable: one full-garden view, one whole-plant view from a fixed side, a label visible in the frame, and close-ups only when needed. Note the camera position and approximate distance. Photograph the plants against the same landmarks. A spectacular low-angle photograph can flatter growth, but it cannot support a reliable comparison of canopy spread or symptoms.
Define the terms before they become columns
Write down what counts as transplant recovery, first flowering, a symptom event, a treatment, a normal harvest and a forced harvest. One workable flowering definition is the first date when multiple branch sites show sustained flower development under the same inspection method; isolated preflowers are recorded separately. Keep that definition for every plant. If you change it midseason, note the change and do not combine the two time series without qualification. Record phenotype descriptions as observations rather than asserting that a breeder name predicts identical behavior.
Distinguish an observation from an interpretation and an action. “Leaves drooped at 14:00” is an observation; “drought stress” is a hypothesis; “checked three soil depths and measured emitter output” is an investigation; “adjusted one blocked emitter” is an action. A journal that gives each its own field prevents a theory from quietly becoming an established fact. This habit is consistent with university extension scouting guidance, which recommends recording conditions, symptoms, actions and their results rather than guessing from appearance alone.
Baseline, observation and verification
A baseline is a known starting condition measured by a specified method. An observation describes what was actually seen or measured. Verification repeats the relevant observation after a defined interval or intervention to establish whether the suspected problem and its cause have changed. None of these alone proves causation.
Decide which records are necessary, optional or confidential
The core record needs a date, plant or zone ID, stage, meaningful weather, measured irrigation where relevant, observed health and any action. Optional detail includes canopy dimensions, calibrated soil-water readings, laboratory results, insect counts and labor hours. More columns are useful only if you can collect them consistently. A sparse but reliable journal is more informative than a sophisticated form filled with estimates and missing dates.
Protect personal information and lawful site security. A public photograph or online sheet does not need a precise home address, geotag, access code or identifiable neighbor. Maintain any legally required commercial traceability separately and follow the relevant local retention and reporting rules. This article’s example log is an educational record format, not a substitute for a regulated inventory, pesticide-application or compliance record.
Field Advice: Before the season, write three decisions you want your journal to support. Every column should serve at least one of them. If you cannot explain why you measure something, put it in an optional field rather than sacrificing the records you actually need.
Build an Outdoor Grow Journal Template You Can Actually Maintain
A strong journal has several connected sheets or notebook sections rather than one enormous daily row. The site sheet changes rarely; a plant register changes when plants are added or moved; an event log records weather, irrigation, symptoms and interventions; and a harvest ledger connects each plant to finished material. A short dashboard or weekly summary can pull the main patterns from those records. Keeping the original measurements in separate event rows means a correction does not overwrite evidence of the problem.
Outdoor Cannabis Grow Journal Template
Use the following schema in a notebook, a spreadsheet or a local form. These are fields to fill in, not imaginary results from a real garden. Record units in column labels and enter an explicit “not measured” or “not applicable” where necessary; a blank cell is ambiguous. For weather or irrigation entries applying to a zone, identify that zone once and do not duplicate a reading as though several independent plants were sampled.
| Register or sheet | Fields worth keeping | Update trigger | Question answered |
|---|---|---|---|
| Site and season | Season ID, locality or climate context without public address, site map, slope, exposure, water source, date range, legal constraints | Once; update on material change | What environment produced the observations? |
| Plant register | Plant ID, position, cultivar claim and lot, seed/clone status, transplant date, container or bed, starting size and health | Start and whenever identity or placement changes | Which plant did the event affect? |
| Weather and stage | Timestamp, observation window, local or station source, rain, temperature and humidity, wind event, leaf wetness or dew observation, stage | Fixed regular interval and after significant events | What exposure preceded a response? |
| Water and root zone | Plant/zone ID, date and time, measured source volume, actual output or runtime, pre/post moisture and depth, rainfall, drainage, water-source change | Each irrigation and relevant rain | Was water available and delivered where intended? |
| Symptoms and scouting | First seen, distribution, organ and position, incidence or defined severity, evidence, photo ID, comparison plant, candidate causes | Each new or changing symptom | What changed, and what else could explain it? |
| Action and verification | Action ID, hypothesis, baseline, single changed variable, product or process used where lawful, recheck time, outcome, remaining uncertainty | At intervention and every scheduled recheck | Did the correction work? |
| Harvest and postharvest | Plant/batch ID, harvest date and reason, fraction and trim basis, fresh mass, drying dates, dry mass, discard and trim categories, final usable mass | Each harvest, weighing and exclusion | What finished yield was actually produced? |
| Season review | Primary question, comparisons, recurring failures, costs and inputs, confidence, next-season actions and open questions | After postharvest accounting | What should change next year? |
Use one event per row, even when several events occur on one day
Imagine a morning rain, a midday wilt, an afternoon emitter inspection and an evening correction. Putting “rain, wilt, fixed” into one cell conceals the order. Four timestamped entries reveal that the plant wilted after rain but before the emitter was tested. Keep separate IDs for an irrigation event (W-014), a symptom (S-006), an intervention (A-006) and its follow-up (V-006). Link each action to the original symptom without altering the original note. If an observation turns out to be erroneous, mark it as corrected, retain the original where practical and explain the reason.
Time zones, date formats and units matter when records are shared. Use a consistent calendar format such as YYYY-MM-DD and local time with a recorded timezone. Do not mix gallons with liters, centimeters with inches, Celsius with Fahrenheit or soil-water percentage with a tension reading unless the column identifies the unit. A conversion belongs in a separate calculated field, and the original instrument value should remain available for audit.
Design a three-level schedule for the real workload
The fastest useful entry is the visit log: confirm plant IDs, inspect for new safety or health concerns, record meaningful rain or irrigation, and note any action. A longer weekly record repeats defined measurements such as height or two canopy widths, takes consistent photographs, checks designated soil positions and reviews unresolved symptoms. At stage changes and after major storms, add event-specific data: flowering onset, support damage, disease pressure, water-system failure or a forced harvest decision. These are suggested workflow intervals, not validated universal scouting frequencies. Increase the inspection frequency when fast-changing symptoms, heat, wind, wet flowers or system faults justify it.
Use a reminder in the system you already maintain rather than a new app that may be abandoned. A waterproof notebook and pencil can be more reliable at a wet remote plot; a spreadsheet makes trends and calculations easier; a photograph folder stores visual evidence. The strongest choice is one that preserves dates, identities and unedited originals and remains accessible when a device fails.
Give photographs and samples an index, not just a folder
A filename such as S006-P03-2026-08-14-upper-leaf.jpg is more useful than IMG_0427.jpg. Connect the filename to the journal row. If several angles show the same lesion, retain their shared event ID. Label a hand-lens image with magnification and inspected surface. If a laboratory sample is taken, record collection date, plant and tissue position, handling, laboratory name, method, result and report identifier. An uncertain, negative or inconclusive result must retain its limitations rather than being simplified to “no disease.”
Back up the journal without publicly revealing the location or personal details of the cultivation site. If a cloud service is used, review access permissions and remove embedded photo geolocation before publishing a picture. If two people keep records, agree on definitions and who is responsible for each sheet; otherwise two observers may turn “some spots” into incompatible severity scores.
“I have only four plants. Do I really need separate IDs and a spreadsheet?”
Question sent by: Connor Blake, via contact form.
Four durable plant tags and one page per plant are enough to start. Add a site sketch and a shared weather page. The point is not software; it is knowing which plant received an intervention, which position was wetter and which harvested batch produced the final dry weight. A small notebook with honest dates beats an elaborate file that is never updated.
Make an example entry that proves the template can be filled quickly
Here is a fictional demonstration of the field format, not a report of actual cultivation: “2026-08-14, 07:30 local, P03/B2/Z1; 7 mm rain in the preceding observation window; near-surface soil damp, deeper sensor not measured; three lower leaves show new yellowing; P04 in the adjacent position remains green; photograph S006-A; no fertilizer change; inspect irrigation output and root-zone depth before next watering; recheck at the next visit.” The entry contains measured and missing fields, a comparator and a future action without announcing a diagnosis it cannot support.
If you revisit the same symptom, add another row. “2026-08-16: S006 spread to two more leaves; emitter output matched baseline; deeper soil remained wet; cause still uncertain.” That follow-up changes the evidence. It does not require rewriting the first observation or pretending that the correct explanation was obvious from the start.
Record Weather, Plant Stage and the Exposure That Actually Reached the Garden
Weather records are most useful when they are tied to an interval, a source and the part of the garden exposed. A statement such as “humid yesterday” does not tell you whether flowers stayed wet overnight, whether only one corner was sheltered from wind or whether the nearest regional station measured conditions several kilometers away. Distinguish regional context from on-site exposure and note exactly what each instrument represents.
How to Record Weather, Watering, and Symptoms
Start with a repeatable observation window. A daily rain reading taken each morning, for example, represents the rainfall accumulated since the previous reading; label the ending time. A thermometer’s current temperature, daily maximum, overnight minimum and an hourly average describe different things. Do not combine them under a generic “temperature” heading. A weather application may report a forecast, a regional station observation or a model estimate; none becomes an actual garden measurement just because it appears on a phone.
For a simple journal, log rainfall amount and observation period, daily or visit-time temperature, notable heat or cold events, humidity or overnight wetness when available, wind exposure and any major storm damage. More advanced growers can add canopy-height temperature and relative humidity, soil temperature, reference evapotranspiration and leaf-wetness data. These are context variables, not a requirement to install an entire weather station. The goal is to capture exposures that could explain a specific growth, irrigation or disease event.
Separate a reliable rain measurement from what reached the roots
Use a rain gauge in a repeatable location and follow its maker’s placement and reading method. National Weather Service guidance emphasizes that nearby obstacles and wind can bias precipitation capture, while an exposed roof is also a poor gauge location. Keep the gauge away from overhanging foliage and obvious splash, place it level, and document any relocation. If the gauge is tipped, blocked or overflowed, mark the measurement uncertain rather than enter a false zero. The observation should say whether it is a manual total, tipping-bucket logger or nearby official station report.
Recorded rainfall is not the same as water stored in the plant’s active root zone. Some water is intercepted by foliage or mulch, some runs off a sloping or compacted bed, some evaporates, and some drains beyond roots. The Food and Agriculture Organization distinguishes total precipitation from effective rainfall, the portion available for crop water use. In a journal, write the measured rain first and assess its effect by checking actual moisture and infiltration later. Do not simply subtract the gauge total from the next irrigation volume without a local basis for doing so.
A container placed beneath a roof edge may receive concentrated roof runoff, while one sheltered beneath an overhang may receive almost none of a storm recorded by the garden gauge. A fabric pot can absorb rain through its exposed top yet drain rapidly through its sides and bottom; a native bed may retain water more deeply after a slower soaking event. If you track several water environments, give each an exposure class and place representative measurement points accordingly.
Log the weather sequence that matters to disease
For flower or foliage diseases, the duration and timing of wetness may be more informative than a single high-humidity reading. Record when rain began and ended when known, whether morning dew persisted, whether flowers remained wet after the surrounding foliage dried and whether the canopy was unusually sheltered from wind. If a logger records continuously, summarize the period using a transparent rule and retain the raw file when practical. “Flowers wet at 07:00 and dry at 11:30” is a bounded observation; it does not prove they remained wet for the entire interval if no intermediate check was made.
Weather can coincide with disease without proving a pathogen. A yellow leaf appearing after three damp days may result from a saturated root zone, restricted uptake, pest damage, disease or normal lower-leaf aging. A sustained pattern across similarly exposed plants, direct signs of a pest or pathogen, root-zone examination or diagnostic testing strengthens a conclusion. Use the journal to create the timeline, not to award a diagnosis to a weather event.
Track wind, frost, smoke and unusual events as incidents
Wind direction and an isolated gust are difficult to infer from a basic handheld meter. If you lack continuous data, record observed damage and a qualitative exposure description without inventing a wind speed. Photograph broken branches, displaced stakes, torn netting and leaning containers with location labels. Mark official weather warnings and whether your property was included in the warning area. Keep forecast warnings separate from observed damage. If wildfire smoke, ash, floodwater or questionable spray drift reaches the garden, record time, source if confirmed, visible deposition and affected locations. A visual log cannot certify the crop is free from contamination; relevant sampling or professional guidance may be required.
For cold nights, note whether a plant sat in a low pocket, beside a wall or on a raised terrace. A regional minimum may not capture the temperature of a garden hollow. Record whether frost was actually observed on leaves and flowers, not just forecast. In a long-season journal, it is useful to distinguish the first forecast frost, first observed frost and the first frost event that caused confirmed tissue damage.
Use stage-based checkpoints instead of a calendar that pretends every plant is identical
Record transplant establishment, rapid vegetative growth, first sustained flowering, flower development, late maturation, harvest decision and postharvest outcome as separate stages. Mark the date each plant reaches a defined transition. Photoperiod response varies among Cannabis genotypes and environments, so one plant’s flowering date must not be copied into another’s row. Outdoor trial records published in cannabis research measure phenology repeatedly for this reason. A cultivar description or advertised flowering duration belongs in an expectation field, never in the observed-date field.
At stage changes, photograph the whole plant and at least one marked representative branch. Note whether disease, support workload, irrigation demand or plant height changed abruptly. When a plant finishes early because of weather or illness, mark the harvest as forced and record the stated reason. A later season review needs to know which plants reached a comparable maturity and which did not, especially when the final mass looks superficially similar.
Remember: A weather station describes its own location and instrument. Your plant experiences the conditions at its own canopy and root zone. Keep both records when the distinction changes the decision.
Keep forecast decisions separate from historical observations
A forecast is valuable for planning branch support, rain protection, irrigation access and a potential harvest decision. Record the forecast issue time, predicted hazard, action chosen and actual observed outcome. Do not overwrite a forecast after the event with the weather that actually occurred. The difference shows whether your response plan was sensible given the information available at the time. A forecast-driven early harvest may still be reasonable even if a predicted storm later misses the property; mark the decision and its uncertainty rather than rewriting history as a mistake or a success.
Regional historical climate data can help you interpret whether a season was unusually hot or wet, but compare the same date window and measurement definition. A monthly rainfall total cannot describe the number of consecutive flower-wet mornings. Conversely, three selected photographs of rainy days cannot establish that the whole autumn was wetter than the long-term average. Use the record whose time scale matches the question.
Record Irrigation, Root-Zone Conditions and Source-Water Changes
Watering records must distinguish what the operator intended, what the equipment delivered, what the soil retained and how the plant responded. A timer completion message documents only that a program ran. It does not confirm that the source tank contained water, the emitter flowed normally or the roots were wetted at depth. The journal should connect the applied water to the plant or zone and then verify the wetting pattern. For the full biological demand calculation and irrigation procedure, use Weedth’s outdoor cannabis water-demand guide.
Use the correct unit at the correct scale
For hand watering, measure the delivered liters or gallons using a marked container rather than relying on how long the hose was open. A zone flow meter can record total volume for a multi-plant drip system; record the zone ID and how many outlets operated, not automatically the same volume for every plant. For drip, actual outlet delivery follows flow and duration, but a printed emitter rating is only a nominal starting point at specified conditions. Measure representative output at a known operating pressure. If the garden uses rainwater tanks, record the tank level before and after a large event only when the tank geometry and withdrawals are known well enough to infer a volume.
One millimeter of water spread across one square meter is equivalent to one liter. That relationship is useful for translating depth-based weather or irrigation records into an area-based water budget, but the area represented by one cannabis plant must be defined. A 4 mm estimated demand over 2 m² would represent 8 L over that managed area in a hypothetical calculation, not a universal 8 L daily watering recommendation. Log the assumed wetted footprint and whether it changed with canopy size.
Measure before, after and at the next decision point
A root-zone sequence is more informative than an isolated reading. Measure the designated position and depth before irrigation, repeat after an appropriate redistribution period, then observe again before the next irrigation decision. Soil water content expressed as a percentage and soil-water tension expressed in centibars or kilopascals are different quantities. The same numerical value cannot be compared across them. Note sensor model, serial or unique ID, depth, distance from the emitter or stem, medium type and relevant calibration method.
Recent extension guidance explains that soil texture, salinity, temperature, physical installation and sensor drift can bias field readings. Some probes need site-specific calibration; where a grower uses them only as relative indicators, the record should state that limitation and retain a local wetting/drying baseline. Confirm doubtful readings with a consistent physical examination at more than one depth or with an appropriate reference measurement. A surface that looks dry can conceal a wet lower profile; a wet surface can sit above a dry root ball when water has channeled around it.
Make the water-source ledger distinct from the fertilizer ledger
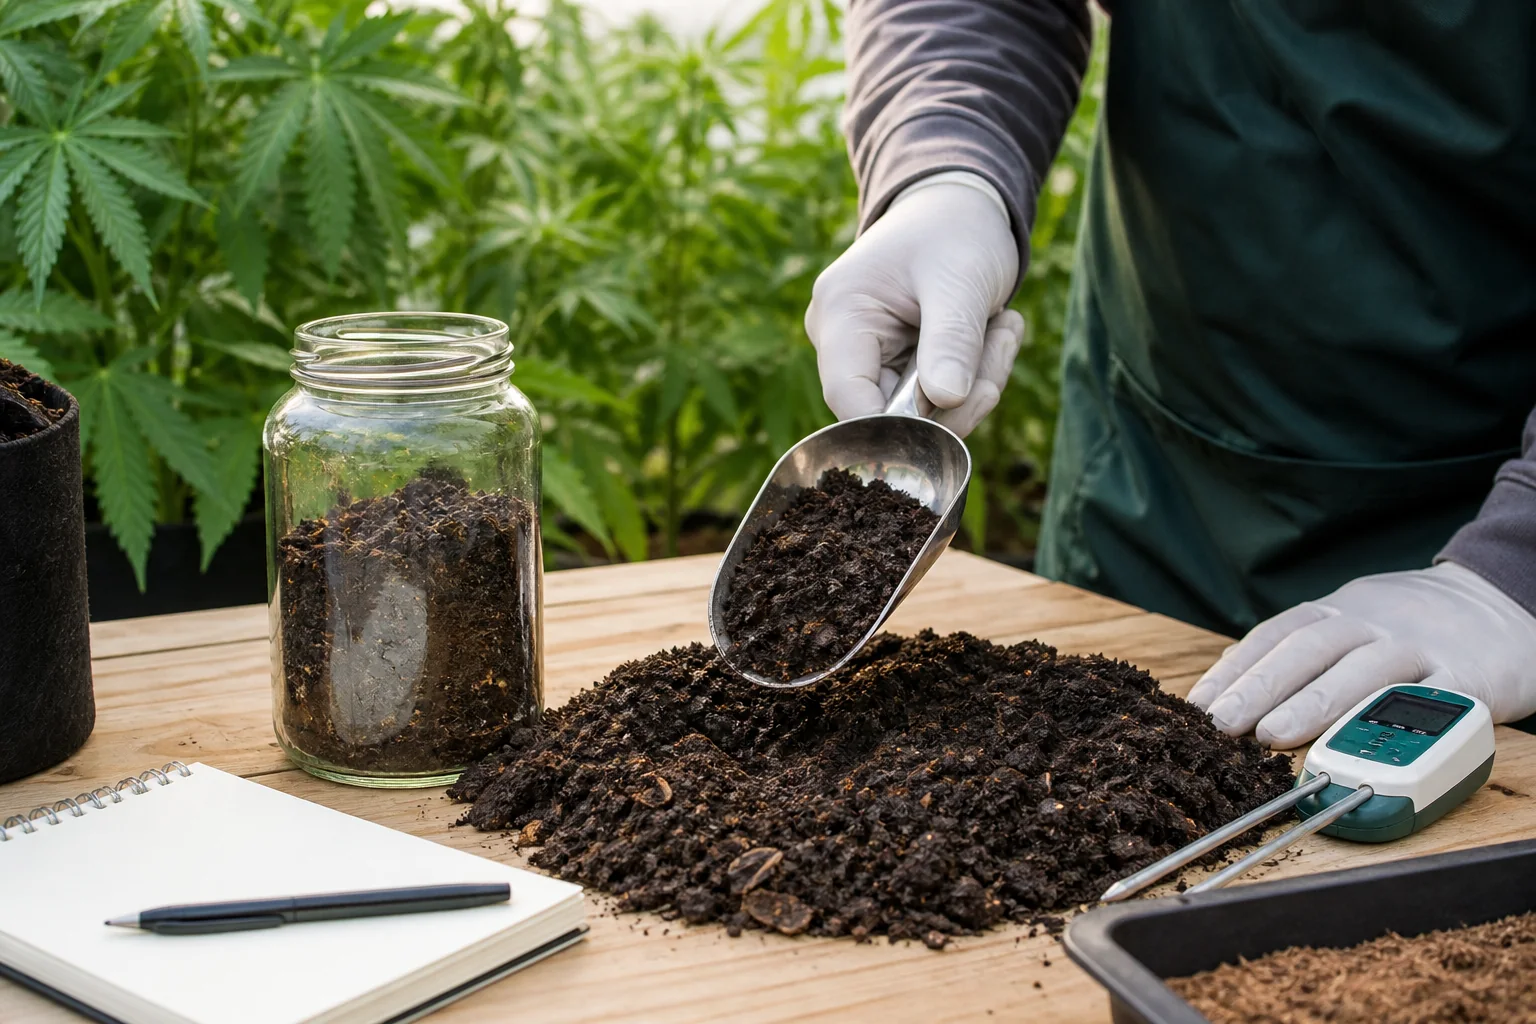
For a stable municipal source, baseline water analysis and a note of any reported supply change may be sufficient. For a well, reservoir, pond or rain tank, changes in sediment, temperature, salinity and chemistry may justify more frequent checks. Record water-source identity, sampling point, collection time, instrument or laboratory method, and any pH, electrical conductivity, alkalinity, sodium or chloride result that directly affects the garden’s decisions. Do not equate a normal pH or EC with microbiological safety or absence of pesticides and metals. If source contamination is suspected, stop treating the issue as a nutrient-adjustment problem and use an appropriate laboratory or authority response.
Keep source-water EC separate from the EC of a fertilizer mixture and from a soil or substrate extract. An increase in root-zone soluble salts may reflect applied fertilizer, source water, evaporation, inadequate leaching or an invalid sampling method. Different extraction techniques yield different numbers; write down the method, dilution, units, sample depth and instrument condition. One runoff reading should not be treated as a complete profile of a container, especially if water bypassed dry material. This journal records the evidence; detailed chemistry correction belongs in a dedicated water or root-zone resource.
Audit emitters by location and actual output
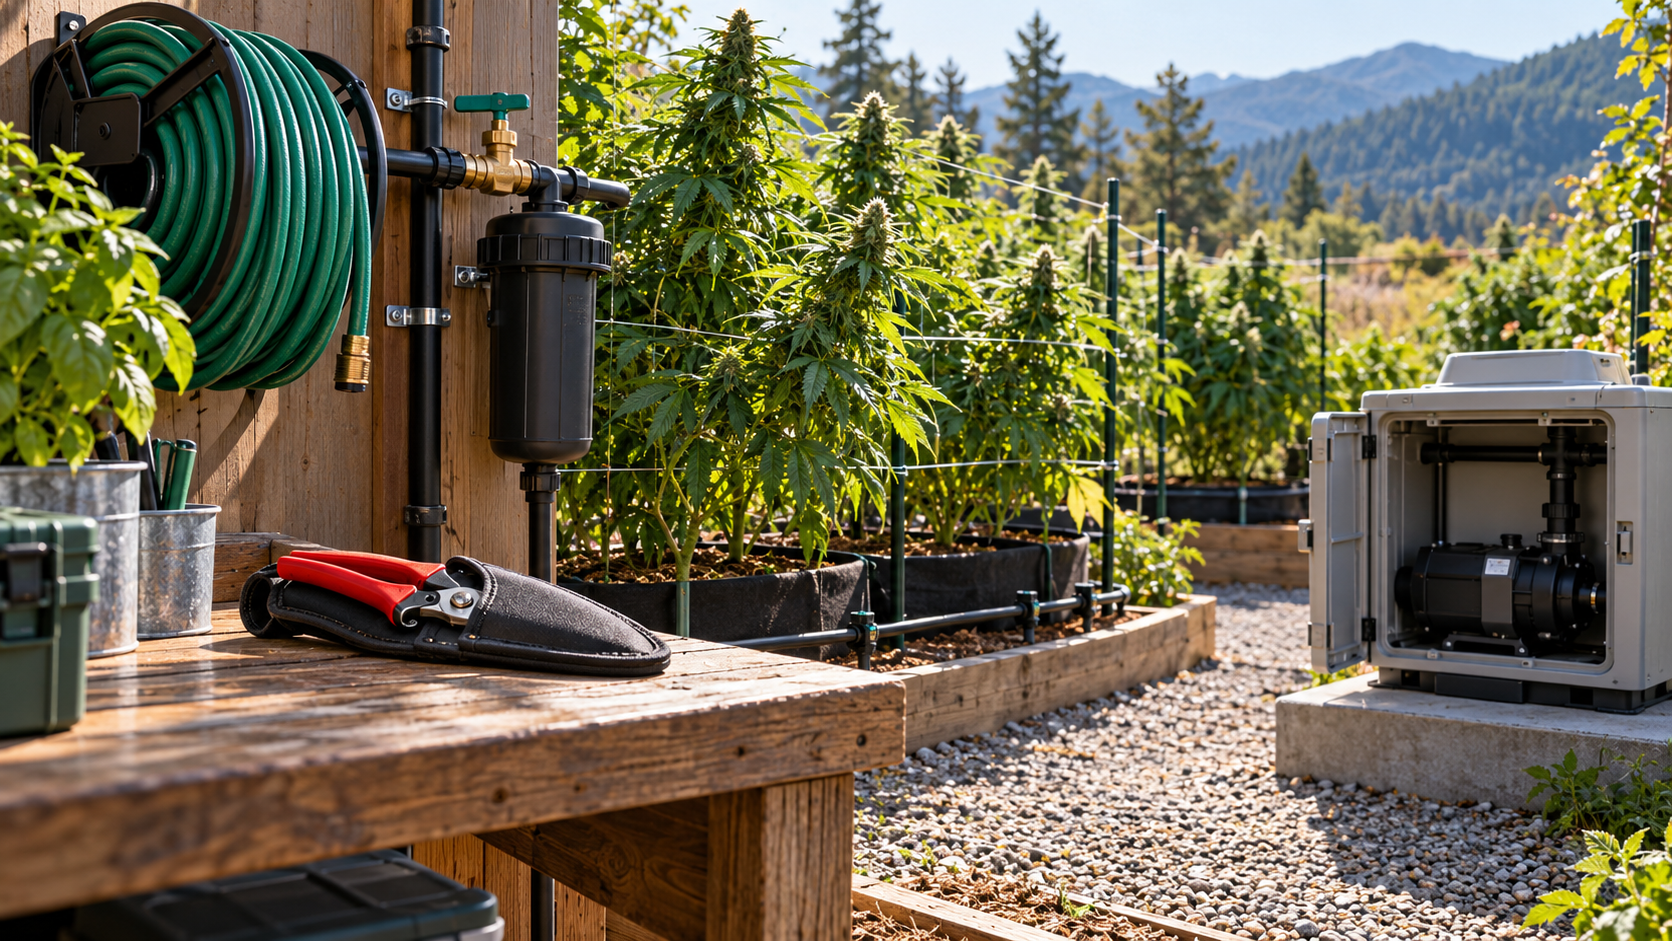
Map the first, middle and far sections of each irrigation zone and choose repeatable representative outlets. Collect output for the same timed interval in clean graduated containers while the system is operating under normal, safe conditions. Calculate output per hour where useful, compare to the earlier baseline and document operating pressure when equipment allows. University of California microirrigation guidance uses mapped emitter sampling because average flow alone may conceal clogged downstream sections or pressure-related variation. A repaired emitter deserves a fresh measured flow reading and a root-zone wetting check, not just a visual glance at water dripping.
Do not turn the journal into permission to disassemble pressurized equipment. An unsafe leak, energized wet connection or suspect chemical injector takes priority over plant measurements. Isolate the system safely according to its documented procedure and obtain qualified help when needed. The separate drip irrigation design resource covers hydraulic choices. The journal’s job is to preserve the commissioned baseline, record deviations and prove the repair restored the intended operation.
| Reading or observation | What to record | What it cannot prove alone | Verification step |
|---|---|---|---|
| Rain gauge total | Depth, end time, gauge location and reliability | Water retained within the active root zone | Check infiltration and moisture at the established points |
| Irrigation timer | Program, actual runtime, zone and interruptions | Actual flow from every emitter | Check zone total and selected outlet output |
| Flow or collection volume | Liters or gallons, collection time and sampled position | Even wetting or adequate oxygen throughout the medium | Check root-zone depth and distribution afterward |
| Moisture sensor | Device, depth, position, units, calibration and temperature context | Every plant’s moisture or exact crop demand | Compare with a second depth and physical observation |
| Water-source EC | Sample source, date, units, meter and calibration status | Specific ions, microbial contamination or root-zone salt content | Use a suitable source or laboratory test for the suspected problem |
| Runoff EC | How runoff was generated, when sampled, units and method | The entire root zone’s salt distribution | Use a consistent substrate-specific sampling protocol |
Review wetting failures as patterns across a zone
When one plant wilts after a nominally successful irrigation, ask whether the failure follows a position, emitter, soil type, container geometry or cultivar rather than immediately diagnosing drought. A row of weak outlets near the far end of a line suggests a distribution issue; one anomalous container may have a kink, a hydrophobic pocket or a different plant demand. Saturated roots can also cause wilting, so leaves alone cannot tell you whether to add water. Compare the affected plant with a healthy neighbor at the same time of day and measure at equivalent depths.
Log any maintenance that changes the system baseline: filter cleaning, regulator adjustment, emitter replacement, tank refill, line relocation, addition of another outlet, switching water sources or changing mulch. A suddenly lower irrigation volume after an apparently successful “upgrade” might represent conservation, but it might also be a newly under-watered far end. Follow with comparable measurements before counting the change as an improvement.
A moisture number cannot clear an unsafe water source
A wet root zone does not establish that irrigation water is chemically or microbiologically suitable. If floodwater, sewage, spray drift or an unknown industrial source may have contaminated a growing area, record the exposure, avoid guessing from pH or EC and seek appropriate testing or local authority guidance. Do not represent the crop as safe on the basis of a normal-looking plant.
Turn Symptoms Into a Verification Sequence, Not a Guessing Game
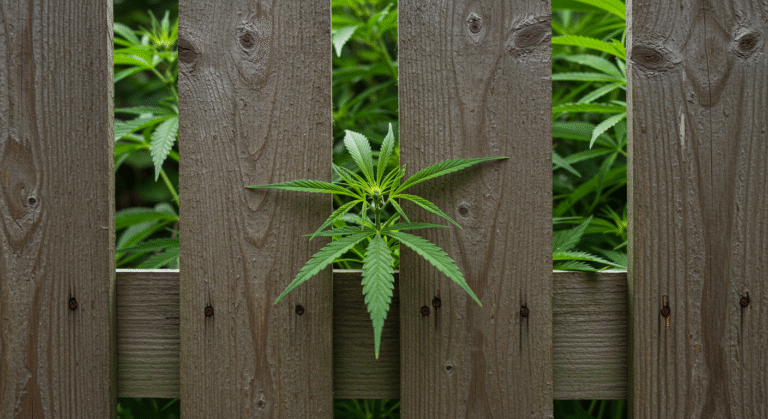
When a symptom appears, the first challenge is to describe it without naming its cause. “Nitrogen deficiency on P07” is already a diagnosis. “Older leaves on the shaded lower third of P07 are uniformly pale; seven of approximately thirty inspected leaves affected” is an observation. The second entry can be checked later, compared with neighboring plants and supplied to a diagnostic laboratory. University plant clinics ask for the site, symptom history, affected and healthy comparisons and multiple photographs precisely because appearance without context often leaves several explanations possible.
Record onset, distribution, position and progression
For each symptom event, identify when it was first noticed and the last time the tissue looked normal. Those two dates define a window; do not invent an exact onset time when you visited only every three days. Note whether symptoms first appeared on older or younger foliage, on leaf edges or between veins, on upper or lower canopy sites, or on one branch versus the entire plant. Record whether neighboring plants share the pattern and whether affected plants share a water line, fertilizer batch, soil bed, spray exposure or low-lying position.
Distribution often separates competing hypotheses better than the color of one leaf. Similar damage across windward edges after a neighboring spray event raises a different question from isolated lesions inside several wet flowers. Symptoms following one drip lateral suggest delivery, source or line-position effects; damage spread randomly across several beds may require a different investigation. None of these patterns proves a cause. They tell you where to inspect next.
Specify which plant structures are involved. Check leaf undersides for pests and eggs, stems for wounds or discoloration, the crown for damage and the root zone for saturation or restriction when examination can be done without unnecessary injury. For flower symptoms, record which branches and tissue are affected, whether wet weather preceded the discovery and whether visible mold or decay is present. Do not cut around visibly moldy material and label the remaining flower safe; safety and disposal decisions require a separate product-risk assessment. The journal should flag a suspect batch for isolation, not turn visual inspection into a food or inhalation safety certificate.
Make a consistent symptom scale without pretending it is universal
A simple local score can make successive visits comparable. Define 0 as no visible symptom on the inspected unit, 1 as one isolated site, 2 as several localized sites, 3 as broadly distributed signs and 4 as substantial tissue failure or unusable material. Alternatively, count affected leaves among a predefined number inspected or record the number of affected branches out of those present. Write down your denominator. “Five symptomatic leaves” means something different when ten leaves were inspected versus a hundred.
Do not mix incidence and severity. Incidence answers how many sampled units are affected, such as three of eight inspected branches; severity describes how badly each unit is affected. A single large necrotic lesion can have high severity in one unit and low incidence across the canopy. An informal scoring system is useful for comparing the same plant over time but should not be described as an independently validated cannabis pathology scale. If multiple people scout, compare a few reference photographs and agree on how each category is used.
Build an evidence packet around each new symptom
Take an orientation image of the whole garden or bed, a clear whole-plant image showing where the problem sits, a mid-range image of the affected branch and a sharp close-up with a scale reference where possible. Add leaf underside or stem and root-zone views when relevant. Keep one photograph of an unaffected comparator. Iowa State’s diagnostic photography guidance and several university clinics make the same practical distinction between field pattern, whole-plant view and close-up evidence. A beautifully detailed spot alone cannot reveal whether all plants on one irrigation line are affected.
Use similar lighting and camera distance at follow-up. Inconsistent white balance can make two normal leaves appear very different, while flash can exaggerate reflective leaf surfaces. Keep the original image alongside any cropped copy and never edit out surrounding tissue when the purpose is diagnosis. Include the photographed organ and precise plant position in the event row; otherwise a new spot may be mistaken for an enlargement of the original one.
Check common look-alikes in a fixed order
First ask whether the environment or water delivery changed. Review the preceding rain, heat, wind, irrigation and equipment entries, not simply the most recent one. Next inspect the actual wetting profile and any relevant source or substrate tests. Examine plant surfaces for direct pest evidence, then check whether symptoms resemble a localized disease or mechanical injury. Review fertilizers, sprays, cleaning agents, drift and handling events. Consider growth stage and the possibility that older leaves are senescing naturally. These checks narrow hypotheses; they do not justify applying several treatments in sequence until something happens.
| Journal pattern | Possible explanations to keep separate | Next discriminating check | What to record afterward |
|---|---|---|---|
| Leaves droop in one zone after a timer run | Blocked outlet, dry center, standing water, root damage, afternoon response | Actual emitter volume, two-depth moisture and healthy comparator at same hour | Delivery finding, root-zone condition, timing and next-day posture |
| Leaf margins scorch after a hot windy day | Water deficit, salt stress, spray drift, direct wind or light exposure | Source and medium history, distribution, underside and position pattern | First onset window, weather exposure and verified measurements |
| Lower leaves turn yellow gradually | Normal aging, nitrogen or other nutrition issue, wet roots, low light | Age and distribution, medium condition, adjacent plant comparison and appropriate test | Progression and evidence that supports or weakens each hypothesis |
| One branch becomes spotted after handling | Mechanical abrasion, pest feeding, infection, localized spray exposure | Trace injury and tool history; inspect both surfaces and nearby plants | Lesion dimensions, new sites and confirmation status |
| Dense flowers discolour after repeated wet mornings | Botrytis or other rot, physical damage, maturation or environmental discoloration | Inspect safely for signs, extent and neighboring material; obtain diagnosis if needed | Isolation and discard decisions, affected batch and inspection dates |
| Several plants develop the same symptom after one input | Input concentration, water chemistry, application error, shared weather or coincident pest | Verify application log and calibration, sample unaffected zone, inspect direct signs | Actual input, exact timing, comparator and follow-up trend |
Do not mistake association for a confirmed cause
Suppose P04 receives fertilizer on Monday and yellowing is noticed on Tuesday. It is tempting to say the fertilizer caused the damage. But the prior photograph may show the first yellow patch on Sunday. In that case the fertilizer cannot explain initial onset, although it could have worsened an existing condition. Conversely, a newly clogged emitter found Wednesday does not prove it was clogged before Monday unless the flow or moisture history shows when delivery changed. Time ordering is necessary but seldom sufficient to establish causation.
Use a working diagnosis field with a confidence description: suspected, supported by observations, laboratory-confirmed where applicable, or unresolved. Record negative evidence as well. “No pests found on eight examined leaf undersides at this visit” is useful, but it is not the same as “pest-free plant.” Small or hidden organisms may remain undetected, and a negative assay can be limited by specimen choice, test sensitivity and sampling time. Keep method and scope attached to every result.
Escalate to specialized identification when the result changes the decision
If the apparent disease could affect a whole harvest, spread between plants or justify discarding valuable material, do not rely entirely on a photo-matching website. An extension plant diagnostic service, qualified agronomist or competent laboratory may be appropriate, subject to local legality and sample-submission rules. Ask the service what tissue, stage and packaging it requires. The best sample may show early and intermediate symptoms rather than only dead material. If a lab requires symptomatic and healthy tissue, follow its current instructions and keep separately labeled chain-of-custody notes where relevant.
Plant symptoms are not evidence that harvested flowers are safe for consumption. A healthy-looking companion plant, ordinary household moisture meter or negative test on a single unrepresentative fragment cannot certify an entire batch. When there is visible mold, suspected contamination or another genuine safety concern, isolate questionable material and follow appropriate disposal and testing requirements instead of documenting a presumed rescue.
“The leaves looked better after I watered. Can I enter ‘drought confirmed’ in the journal?”
Question sent by: Maya Thompson, via E-mail.
Record the improvement, but keep the cause provisional until other evidence supports it. Water may temporarily change leaf posture even when poor aeration, heat, root damage or a delivery fault contributed. Compare the pre-watering moisture profile, delivered volume, similarly exposed plants and the next day’s condition. A response to an intervention is evidence, not automatic proof of the diagnosis.
Preserve serious incidents instead of folding them into a symptom score
Maintain separate incident flags for confirmed mold, major pest outbreak, pesticide drift, floodwater exposure, structural collapse, power or irrigation safety failure and forced harvest. Document immediate containment and any professional advice, and do not wait for a weekly photograph when an urgent health or safety concern arises. If an event makes a portion of the harvest unsafe, keep the loss in the harvest ledger; do not erase that material from the season history merely because it was discarded before the final weighing.
Track Corrections Without Losing the Evidence You Need
A journal is useful only when the next decision changes because of what you recorded. The safest general sequence is observe, verify, make one justified change, allow a relevant response interval, and measure again. This is not a universal instruction to delay urgent action. A ruptured irrigation line, suspected contamination or visibly diseased flower requires immediate containment or competent assistance. The one-variable principle applies to controlled troubleshooting after urgent risks are managed.
Write the hypothesis before choosing the correction
For every nonurgent problem, make a short causal statement that could be contradicted: “P02’s lower leaves are wilting because its far-end emitter delivers less water than the commissioned baseline.” Then identify the measurement that would support or reject that idea: outlet volume collected over the same interval, pressure at the established point and moisture at comparable depths. If the emitter tests normally and the lower soil profile is saturated, do not keep the same diagnosis merely because you initially believed it.
Record the exact action and its scope. “Changed irrigation” is too vague; “replaced the visibly blocked emitter serving P02 with the same rated model after safely isolating the line; measured restored output under normal pressure” is repeatable. For a nutrient change, document product identity, concentration, actual application volume, date, affected plants and any regulatory or label constraints. Do not combine fertilizer, pest spray, pruning and new irrigation settings into an anonymous “rescue treatment” and later claim to know which one worked.
Define the verification point before the action starts
A mechanical correction can be checked during controlled recommissioning: pressure, outlet flow, leaks and actual wetting. A leaf symptom often needs another inspection after a physiologically meaningful interval, and old necrotic tissue may not become green again even when the cause has been removed. Instead of expecting damaged tissue to reverse, measure whether new injury stops, whether new growth appears healthier, or whether a defined count of affected units stabilizes. Set the follow-up timing from the suspected mechanism and urgency rather than copying an arbitrary number of hours.
Some observations require the same time of day. Leaf posture at dawn and midday cannot be compared as if atmospheric demand were unchanged. A flower disease needs repeated inspection after the relevant wet period, not a single moment after sunlight returns. A changed soil amendment may need longer before a measurable response, and the interval depends on material and biology. Record “too early to judge” when that is the truthful outcome. A permanent-looking improvement from one photograph is not verification.
Give the correction a decision and a remaining uncertainty
At recheck, describe the measurements and choose one operational status: resolved at measured points, improving but not confirmed, unchanged, worsening, or inconclusive because the measurement failed. A status is not a claim of universal health. If the emitter is back to its baseline but leaves are still wilting and soil remains saturated, the delivery issue may be resolved while the plant-health question remains open. Create a new hypothesis rather than rewriting the original action as a total success.
Keep interventions that failed. An unsuccessful correction can be more informative than a successful-looking one because it eliminates or weakens a hypothesis. Do not delete a mistaken irrigation adjustment from the record. Note who made it, what was changed, what it cost, why it was reversed and what the next measured condition showed. This is particularly valuable when multiple people manage the same garden or when seasonal labor changes.
Use a controlled comparison when possible, without risking plants
A healthy neighbor or unaffected zone provides context, but only if the conditions are reasonably comparable. A shaded plant in native soil is a poor comparator for a sunny container on pavement. In a legitimate cultivar trial, the purpose and experimental unit need to be defined before assigning positions and management. Weedth covers the design, replication and confounding problem in Outdoor Cultivar Trials. Here, use comparators to interpret events and refrain from universal cultivar claims after a single season.
Do not withhold necessary water or disease control to create a “control plant” merely for curiosity. In a small garden, repeated measurements of one plant can reveal progression but they are not independent biological replicates. If a difference between two plants could be explained by their positions, age, genetics or root volume, record those confounders. A journal is an observational tool; it becomes an experiment only when the design supports an experiment.
Keep the original diagnosis testable
Preserve the symptom, measured baseline, candidate cause, actual correction and timed follow-up as separate linked records.
Rewrite the story after the plant improves
Do not erase unsuccessful actions, assume every simultaneous intervention worked or label an uncertain response as a confirmed cause.
A worked troubleshooting example with honest uncertainty
Consider a hypothetical garden with two similar containers in the same exposure zone. On Monday, P05 appears wilted at midafternoon while P06 does not. The operator records leaf posture and measures surface and deeper moisture in both. P05 is unexpectedly dry at the designated middle depth despite an automated cycle; P06 shows the usual post-irrigation moisture. The operator collects comparable emitter output and finds P05’s outlet substantially below its previously measured baseline. After safely isolating and replacing the faulty component, the operator repeats the timed output test and confirms that the root zone now rewets more evenly.
At the next same-hour inspection, P05’s leaf posture improves. The record can now support a local delivery failure as a plausible contributor, verified by restored flow and wetting; it still cannot prove that the emitter was the only cause or that every root recovered. If new leaves continue to discolor, the event remains open for separate investigation. The value of the worked example is its audit trail, not a claim that every wilt will follow this path.
Review unresolved events weekly
At the weekly checkpoint, scan every symptom or action without a verification entry. Assign a recheck, escalate it or close it explicitly as unresolved because evidence is unavailable. A symptom that stops progressing is different from one that has never been revisited. Group recurring events by irrigation zone, location, stage and weather pattern. Three separate complaints about P05’s dry root zone after timer operation may indicate a chronic equipment or geometry issue rather than three unrelated plant problems.
When a treatment or input is legally regulated, retain the relevant legally required application record, label and preharvest interval separately. The journal can cross-reference the formal record, but must not quietly replace it. Do not publish detailed private garden-location data or identifiable test documents without appropriate consent and legal review.
Master Advice: An action is not complete when you perform it. It is complete when you have checked the relevant outcome, documented what remains uncertain and decided what the next observation must answer.
Wet Weight vs Dry Weight vs Usable Yield: Keep the Harvest Ledger Honest
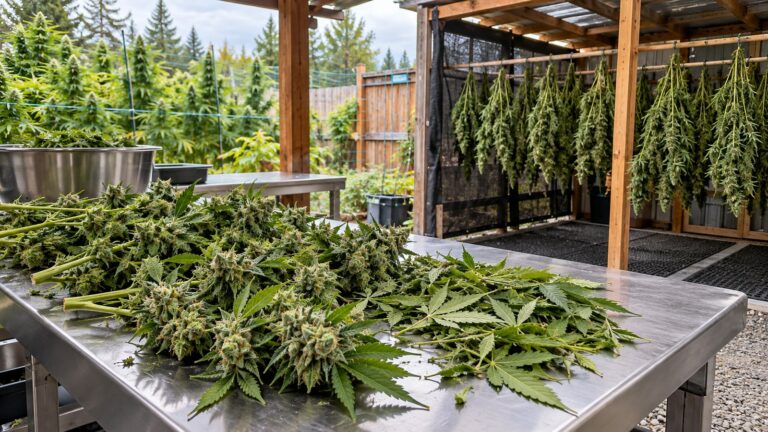
Harvest is where a journal can turn months of careful observation into a misleading single number. Whole fresh plants, freshly separated flowers, untrimmed dried flowers, trimmed dried flowers and the final usable batch are different materials. They contain different amounts of water, stem and leaf tissue, and sometimes rejected flower. Never place their weights in one column labeled “yield” without defining the material, processing stage, measurement method and inclusion rule.
Wet Weight vs Dry Weight vs Usable Yield
Wet weight is the mass of material when it is collected, but the phrase is incomplete without a material definition. Whole-plant fresh mass includes stems and leaves that never become usable flower. Fresh trimmed inflorescence mass has a narrower boundary. Commercial dry flower mass still contains residual moisture: it is not the same as scientifically oven-dried material at approximately zero moisture. Usable yield is the dried flower that remains after a predefined trimming standard and safety or quality exclusions. Material diverted to another lawful, appropriately evaluated product is a separate category, not automatically usable flower.
Peer-reviewed Cannabis studies demonstrate why the distinction matters. A 2025 controlled cultivation experiment separately reported commercial flower dry mass at roughly 10% residual moisture and oven-dried mass measured after additional drying. A 2024 trimming study reported approximately 75% fresh-to-dry weight loss in its particular experimental material and a final water content around 10%, but that observed ratio cannot be converted into a universal rule for every outdoor plant, trim style or harvest. An international forensic methods publication likewise cautions that a fixed conversion among wet, dry and saleable material is not meaningful across the wide variation in cultivation and processing. Your own measured batch ratio is the only ratio belonging in your final report for that batch.
| Mass category | Precisely what is on the scale | When to weigh | Do not confuse it with |
|---|---|---|---|
| Whole-plant wet mass | Fresh cut plant or designated aboveground parts; identify inclusion of stems and leaves | Immediately after cutting under a consistent protocol | Fresh flower yield |
| Fresh flower mass | Separated fresh flowers with a declared wet-trim and stem standard | After separation, before meaningful drying | Whole-plant wet biomass |
| Dried flower before final sorting | Dried batch in a defined trim condition, before final rejected material is deducted | After the established drying endpoint | Oven-dry matter or final usable output |
| Dry trim and discard | Leaf and stem removed at final trim, contaminated or damaged flower, spills; separate categories | At each removal event, with the batch ID | Safe or saleable flower |
| Usable dry flower | Dried and trimmed material meeting the stated quality and safety criteria, with stable defined measurement basis | At the declared final weighing checkpoint | All harvested biomass or all cannabis material produced |
| Scientific dry matter | Mass corrected to zero water or measured by a validated lab drying method | In research or an appropriate laboratory | Ordinary commercial dry flower mass |
Assign a batch ID before different harvest fractions get mixed
A single plant may be harvested in several passes, or several plants may be dried in one room. Link each harvest event to a plant ID and a batch ID: for example P03-H1 and P03-H2 for two passes, with a defined batch ledger if later combined. If you combine flower from several plants, record the input masses and identities before mixing. If an unlabelled mixed lot is weighed at the end, you cannot later reconstruct an individual plant’s usable yield reliably. Do not allocate a mixed batch evenly by assumption merely to fill missing plant rows.
Keep the tare weight of trays, bags, baskets and containers separate. Calibrate or check the scale by its maker’s procedure, weigh on a stable level surface within its rated capacity, and record resolution. A kitchen scale that increments by whole grams may be adequate for a large batch but unsuitable for tiny loss categories. Weigh comparable material at a defined processing stage, not immediately after one plant has been sprayed or exposed to rain while another has already drained and dried.
Calculate loss without pretending all lost mass was water
Consider a purely hypothetical and internally consistent ledger. P01 produces 1,000 g of freshly trimmed flower collected at harvest. After drying, the same tracked batch weighs 265 g before final sorting. Inspection excludes 20 g of damaged material, and a consistent final trim removes another 15 g of leaf and small stem. The final usable dry flower is 230 g. Its usable-to-fresh ratio is 23%, but that ratio belongs only to this batch and its wet-trim standard. The 735 g difference between fresh and pre-sort dried mass is not a direct measurement of water alone unless all non-water losses have been quantified; handling, volatilization and removed fragments may also affect the ledger.
Do not count the same rejection twice. If damaged material was removed before the initial fresh weigh, it cannot be subtracted again from that weighed batch. If the initial wet mass included branches but the dry mass excluded stems, the wet-to-dry comparison includes deliberate removal of tissue, not just evaporation. When the processing paths differ, label the comparison as a combined process yield and use a matched sample if the goal is to estimate water-related mass change.
For a scientific comparison, percentage moisture on a wet basis is the water mass divided by total material mass. A hypothetical 100 g sample at 12% moisture contains 88 g dry matter. If that same conserved dry matter later measures 10% moisture, its total mass would be approximately 97.8 g. Its mass changed even though dry matter stayed constant. This arithmetic explains why commercial weight can shift with moisture without demonstrating an increase or loss in actual dry biomass. It is a conceptual example, not a recommendation to dry flower to either chosen percentage.
Weigh only when the batch has reached the defined endpoint
A lighter batch is not automatically a better-dried batch. Record the drying start, room or batch context, chosen readiness assessment, final weight date and any later rebalancing or moisture change. ASTM D8197 describes a water-activity specification of 0.55 to 0.65 for dry cannabis flower; water activity differs from moisture percentage and is not established by squeezing a bud or reading room humidity. A water-activity result within a storage specification does not destroy existing contamination or certify the absence of mold. Use a consistent, appropriate endpoint for a lawful batch and keep the full readiness assessment in the separate postharvest resource.
If you revisit the scale after curing or storage, create a new weight event rather than silently replacing the first dry number. State whether the second weighing used the same containers, trim status and retained batch fraction. An apparent increase could be moisture uptake, an added fraction, changed tare or scale variation. It cannot establish that curing synthesized additional usable flower or increased the underlying plant yield.
Separate quality rejection from a simple trimming preference
Predefine what counts as usable flower, small but usable flower, trim, damaged flower and unsafe material. A preference for larger buds is not the same as microbial or chemical safety. Record visible disease, contamination concern and rejected mass by batch; comply with the appropriate testing and disposal obligations. When uncertainty makes a batch unfit for the intended use, flag it explicitly. Do not calculate “yield recovered” by cutting around mold or blending unsafe material into another lot.
If a flower fraction is lawful to process into a separate product, do not add it to usable dried flower while simultaneously reporting it as process input. A commercial producer may require additional compliant inventory and reconciliation fields, while a home garden can use a simpler category ledger. In both cases, a final total must state whether it is flower only, total usable cannabis products or all harvested biomass. The terms are not interchangeable.
Use denominators that explain rather than advertise
Usable dry flower per plant is helpful only when the plant count and partial harvests are recorded. Yield per canopy area may help compare gardens with very different plant sizes, but the canopy footprint must be measured by a consistent method and time. Yield per square meter of entire property is a different metric. Yield per unit of irrigation water can reveal efficiency only when volumes are measured and the numerator uses the same final usable category; it also requires rainfall and boundary limitations to be explained. A high ratio based on missing irrigation records is not evidence of low water demand.
For plant-by-plant comparisons, preserve individual values and ranges instead of hiding every difference behind an average. If one plant was lost before harvest, state whether your denominator is all planted individuals, all surviving plants or all harvested plants. Each answers a different operational question. The outdoor-specific planning context and the uncertainty of plant-level yield estimates are covered in Weedth’s outdoor yield guide; the journal supplies the actual observed numbers.
“I weighed 900 grams of branches on harvest day and 180 grams of trimmed flower later. Can I report an 80% water loss?”
Question sent by: Lucas Bennett, via X.
No. Your fresh number included branch and leaf material excluded from the later flower weight. You can report a combined fresh-branch-to-usable-flower recovery of 20% if the two measurements refer to the same complete batch, but not a measured water-loss percentage. For a water comparison, weigh the same defined fraction before and after drying and account for material deliberately removed along the way.
Link yield to weather and actions, but resist the single-cause story
The final ledger should retain harvest date, cultivar claim, maturity basis, normal or forced finish, wet-weather exposure, disease and discard mass, irrigation-zone failures and significant plant damage. A plant with lower usable yield after an autumn storm may have lost flowers to rot, been harvested early, suffered branch damage or entered the storm smaller. The journal can show the sequence and the size of measurable losses. It cannot infer how much extra flower would have developed in a hypothetical storm-free season unless a defensible comparison was designed in advance.
Important: Report final usable dry flower separately from fresh biomass, commercial dry mass before trimming and scientifically zero-moisture dry matter. The label beside the number is part of the measurement.
End-of-Season Outdoor Grow Review: Turn Records Into Next Year’s Plan
Once the harvest has been weighed and safely sorted, review the season by returning to its original questions rather than choosing whichever metric looks most impressive. A journal should help you change a practice, reject an unsupported theory or identify the next question worth testing. Begin with the complete plant register, including failed transplants and zero-yield plants. A season summary that keeps only the survivors changes the denominator and hides the cost of establishment failures.
End-of-Season Outdoor Grow Review
Open a one-page review for the whole garden and, when meaningful, a separate one for each plant, cultivar claim or irrigation zone. Summarize planting dates and initial conditions; the number planted, surviving and harvested; stage transitions and harvest reasons; significant weather events; actual recorded water inputs; unresolved plant-health events; interventions and their verification outcomes; and finished usable yield with its precise category. Retain links to the original entries. A statement such as “P07 struggled in August” should lead back to dates, photographs and measured changes instead of living only in the final summary.
Find a recurring failure before proposing a solution
Sort symptom events by location and date. Perhaps the same low corner showed standing water after three separate storms, while otherwise comparable plants did not. That repeated pattern justifies reviewing site drainage and soil structure before adding nutrients. Perhaps two plants on the far end of Z2 required emergency hand watering after normal timer runs. Investigate zone delivery and maintenance records before concluding that those genotypes always need more water. If every plant experienced the same decline during a heat wave, look at the shared exposure before assigning a cultivar-specific deficiency.
Do not use an apparent relationship if most relevant measurements are missing. If rainfall was recorded but root-zone readings were skipped throughout September, the review can report wet weather and observed problems but cannot quantify how much rain became available to roots. If a fertilizer adjustment coincided with improvement but pruning and irrigation were also changed, label its independent effect unknown. This restraint keeps the journal useful instead of turning it into a collection of plausible but unfalsifiable explanations.
Compare like with like and record why a comparison is limited
Outdoor comparisons are confounded by plant genetics, starting age, canopy area, root-zone volume, position, weather exposure and management. Even two plants with the same cultivar label may be genetically distinct when grown from seed. Compare plant histories using the same stages, measurements and harvest definitions. If one plant was forced to harvest early, report its finished yield but do not treat that result as evidence of its yield potential at normal maturity. If one container moved into shade in midsummer, note the change before interpreting differences in flower finish or water demand.
A home journal is mostly observational. A repeated correlation can generate a strong next-season question, but it is rarely a causal trial. Formal cultivar comparisons need intentional design, replication and control of major site gradients. Where local law, space or plant numbers prevent replication, present a season-specific observation rather than a general conclusion about the genetics. Repeat the method in another season when the choice is consequential; a wet year and a dry year may test very different constraints.
Summarize resource use without false precision
Record measured irrigation volume separately from rainfall, tank refill and water purchased. If some hand watering was not measured, do not fabricate a complete seasonal water total from memory; show the measured subtotal and a clearly labeled gap. Keep costs as actual invoices or recorded estimates, and separate one-time equipment expenditure from consumables. Labor can be recorded in broad but consistently defined categories: inspection, watering, repairs, support, harvest and postharvest. Cost and effort per gram of usable flower become interpretable only when these categories and denominators stay consistent.
For sustainability questions, a lower recorded irrigation volume does not by itself prove lower environmental impact. Water source, seasonal scarcity, runoff, fertilizers, energy and how much product was safely usable can change the assessment. The journal provides evidence for a water budget and for next-year conservation decisions, not a complete life-cycle assessment. Similarly, recording fewer pesticide interventions is meaningful only when actual pest pressure and application records are comparable.
Write a limited, testable plan for next season
Choose a small number of changes directly linked to observed failures. For example, “Measure flow from selected first and far-end Z2 emitters before planting and weekly during peak demand” follows from a documented distribution issue. “Move the rain gauge away from the overhanging branch and document the new position” follows from a measurement problem. “Compare two moisture depths in the low bed after the first substantial storm” follows from suspected saturation. Each planned change needs a success check, not just an intention.
Separate what should remain unchanged. If a simple labeling method prevented every batch mix-up, keep it. If morning photographs were consistently taken but the midday ones were skipped, adjust the schedule rather than blaming the people maintaining it. Retain the baseline and the original full-season data so future revisions can be compared against actual history rather than a polished retrospective.
Before you close the season, confirm every link in the evidence chain
- Each plant and harvest fraction has a stable ID, with replacements and moves recorded.
- The site map, root-zone system, starting condition and measurement methods are retained.
- Weather entries distinguish measured local conditions from station reports and forecasts.
- Rainfall, irrigation delivery and actual root-zone response have not been treated as identical.
- Symptoms show onset windows, affected positions, comparable healthy tissue and labeled photos.
- Every major intervention has a linked follow-up or an explicit unresolved status.
- Serious safety, contamination and disease incidents retain appropriate exclusion or disposal records.
- Wet and dry masses refer to defined materials, stages, units and batch identities.
- Usable flower excludes recorded rejects without counting the same loss twice.
- Yield denominators identify plants planted, surviving or harvested as appropriate.
- Apparent causes are separated from evidence, confounders and untested hypotheses.
- Next year’s changes have a named problem, measurement and verification checkpoint.
Final decision: what has the journal actually established?
At the end, classify each major conclusion by what the record supports rather than assigning every claim a confidence score. Some statements are direct measurements: “P03 produced 230 g of usable dry flower under the stated trim and weighing method.” Some are supported local interpretations: “The far-end drip output repeatedly fell below baseline and recovered after repairs.” Others remain hypotheses: “This cultivar may need a longer dry autumn to finish without loss.” A year with no meaningful pest or disease pressure cannot establish broad genetic resistance, just as one storm cannot define a cultivar’s behavior in every climate.
Keep the unresolved questions visible. The purpose of a journal is not to manufacture certainty. It is to leave the next season with fewer untested assumptions, more reliable measurements and a clear explanation of what changed. The strongest outdoor record links exposure to a particular plant, a symptom to a timed observation, an action to its verification, and a harvest to an honestly defined usable dry mass. With those links intact, the next decision can be based on evidence instead of the most memorable photograph.
Share this article
A quick overview of the topics covered in this article.
- Give Every Observation a Question and a Baseline
- Build an Outdoor Grow Journal Template You Can Actually Maintain
- Record Weather, Plant Stage and the Exposure That Actually Reached the Garden
- Record Irrigation, Root-Zone Conditions and Source-Water Changes
- Turn Symptoms Into a Verification Sequence, Not a Guessing Game
- Track Corrections Without Losing the Evidence You Need
- Wet Weight vs Dry Weight vs Usable Yield: Keep the Harvest Ledger Honest
- End-of-Season Outdoor Grow Review: Turn Records Into Next Year’s Plan
Follow us
Latest articles
October 24, 2026
October 24, 2026
October 24, 2026