
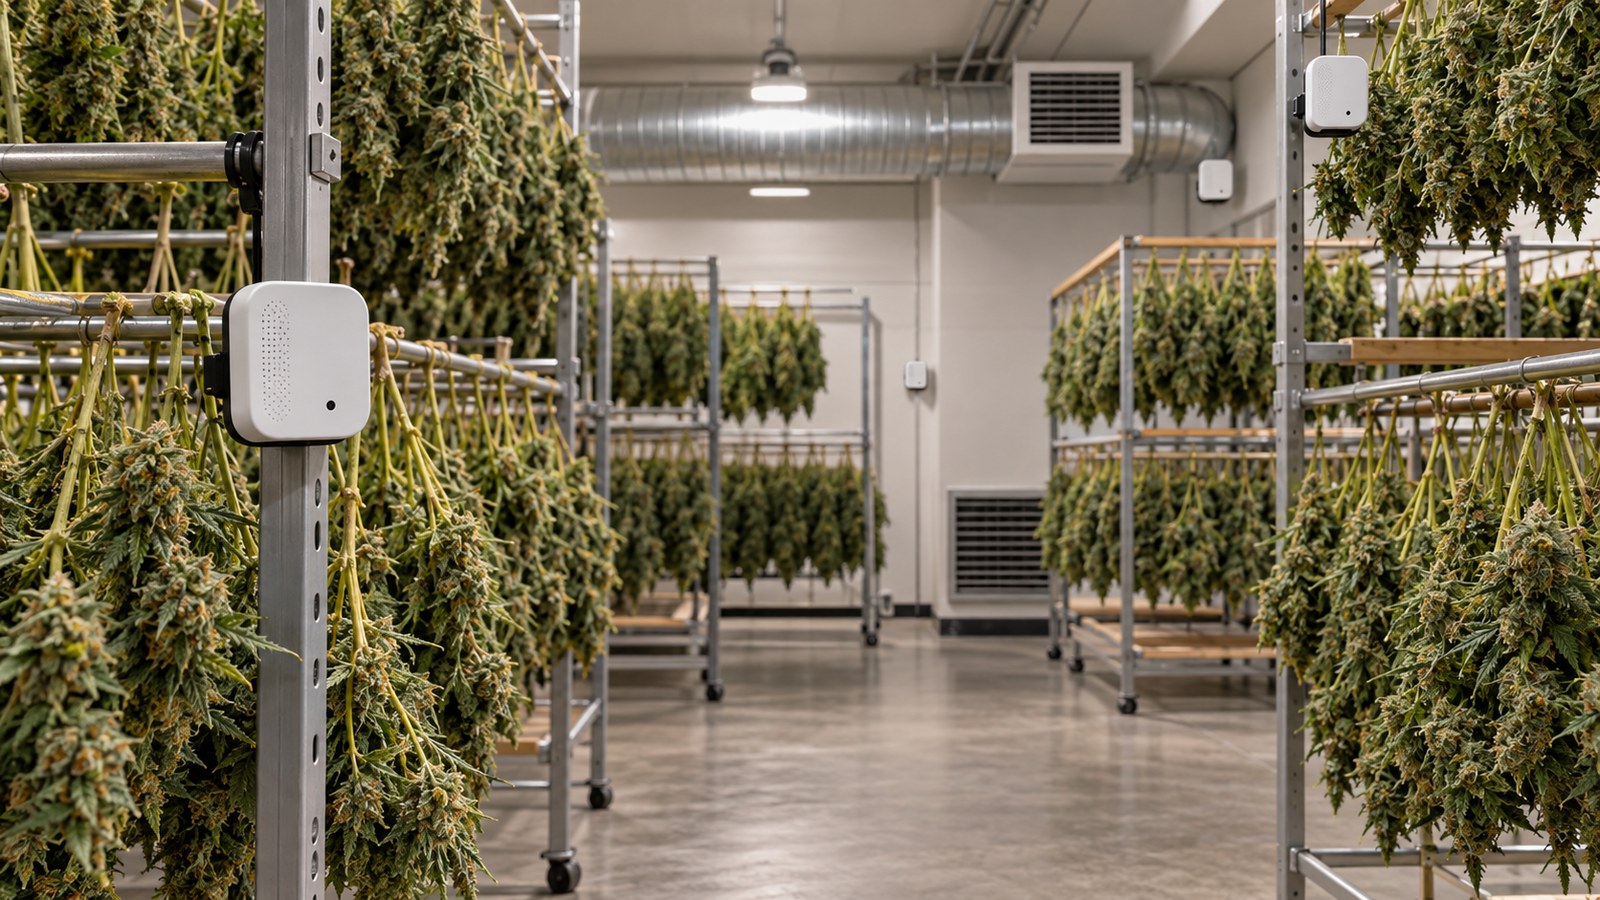
Sensor Placement and Drying-Room Microclimates
A drying room can look perfectly controlled on its wall display while the flowers nearest a supply vent turn brittle and densely packed branches at the back remain damp. The display describes conditions at one location. It cannot show what the rest of the room is doing, whether the instrument is biased, or whether moisture is still moving out of a particular flower. Sensor placement is a sampling decision before it is an equipment decision.
Place one reliable temperature and relative-humidity (RH) sensor where it represents the main occupied drying zone, then use independent loggers to challenge that assumption at plausible wetter, drier, warmer and colder locations. Compare synchronized trends, investigate differences that persist beyond instrument uncertainty, make one targeted change and repeat the comparison under a representative harvest load. Verify flower condition separately before storage. This is a procedure for mapping and monitoring microclimates, not a fixed drying-temperature recipe or a substitute for microbial testing.
The method works for a small lawful home space and can be expanded for a licensed facility. Larger operations may have formal mapping, calibration, batch release and record-retention obligations; confirm the requirements that apply locally rather than assuming an article supplies a universal regulatory protocol. For the broader discussion of environmental targets, see the 60/60 drying rule and its limits.
Define the Decision: What a Drying-Room Sensor Can Actually Tell You
The useful question is not simply, “Is the room at its target?” It is, “Does the air surrounding the real harvest remain within the chosen operating envelope, and are there unmeasured locations where the product could behave differently?” This distinguishes a set point from performance. A controller might report a steady value because its probe is sheltered from wet flowers or placed in an equipment return path. The room can still have an overlooked pocket with slower moisture removal.
Separate a control reading, an independent logger, and a flower test
A control probe supplies feedback to the heating, cooling or dehumidifying equipment. An independent logger records air temperature and RH at a designated position, ideally without depending on the same controller electronics. A flower sample provides information about the material itself: condition, mass-loss trajectory, laboratory result, moisture content or measured water activity as relevant. They answer three different questions. Good room air does not certify dry flower, and a satisfactory flower sample does not prove the room has no blind spots.
Record the operating limits and product criteria separately. A room RH target is a process variable. A water-activity specification is a product requirement determined on a sample using an appropriate method. A drying-room wall display cannot be turned into an ASTM water-activity measurement merely by dividing its RH reading by 100. The relationship between water activity and equilibrium headspace RH applies under defined equilibrium and temperature conditions, not automatically to an actively drying flower suspended in a room.
Four measurements, four different jobs
Air temperature describes local thermal conditions; room RH expresses water vapor relative to saturation at that air temperature; air movement influences external moisture transfer; flower water activity describes water availability in a tested material sample at measurement conditions. None is a direct substitute for the others.
Use a risk map rather than an invented sensor-per-square-meter formula
A compact tent with one rail and a small uniform load may need a reference plus a movable check point. A tall room with several racks, active supply air and a wet first harvest may need many simultaneous locations. Sensor count should follow spatial complexity, product placement, the consequences of missing a deviation and the evidence collected during mapping. There is no validated universal cannabis ratio of one logger to a specified room area or flower mass.
Before buying equipment, draw where the flowers will actually hang, where the air enters and returns, how workers use the door, and where walls or obstacles can create isolated zones. Include the height of occupied product, not merely the floor plan. A single central sensor can be acceptable as a controller only after distributed checks show it adequately represents the conditions that must be controlled.
Define your stop, hold, and investigate decisions in advance
Use three operational categories. Continue monitoring when mapped positions agree sufficiently for the chosen quality requirements and the product is progressing as expected. Investigate when one location persistently diverges or a reading conflicts with observed flower condition. Stop affected handling or put suspect product on hold when condensation reaches product, equipment safety is compromised, there is a credible sign of mold, or monitoring fails so badly that the condition of an at-risk lot cannot be demonstrated. The exact environmental alert band and excursion allowance require a site-specific procedure, not a borrowed cannabis-wide cutoff.
Important: Set alarm criteria and responsibility before drying begins. An alert only helps if someone can verify the reading, inspect the affected zone, document the event and carry out a permitted corrective action.
Map the Room and Select Representative Sensor Locations
A good map includes a representative position and deliberately difficult positions. The goal is not to prove that every spot has an identical temperature or RH. It is to find whether the actual drying positions experience meaningfully different conditions that require monitoring or correction. Mark each candidate position on a plan with a stable identifier such as C1 for the main occupied zone, H1 for a suspected humid pocket and D1 for a supply-air-exposed zone.
Start with one product-level reference position
Place the primary monitoring reference in freely exposed air near the typical drying material, protected from physical contact with flowers and from direct wetting. A central position may be appropriate if the occupied layout is reasonably balanced, but the middle of a walkway is not automatically representative of a rack interior. Use a mounting method compatible with the sensor design and leave enough clearance for air to reach its sensing element. Record both horizontal location and height so the same placement can be restored.
Avoid treating the convenient wall beside the control panel as the default reference. Exterior walls can be thermally different from the room air; doors, nearby equipment heat, sunlight, supply jets and humidifier droplets can bias readings. A portable logger hanging directly against a moist branch may be measuring contact or a highly local boundary layer rather than the surrounding free air. Distinguish these deliberate local investigations from the fixed sensor intended to control the whole zone.
Choose challenge points at likely wet and dry extremes
Inspect the return-air side, sheltered back corner, thickest hanging cluster, tightly occupied shelf, top and bottom product heights where relevant, and areas behind ducts or structural obstructions. Pair those with the first rack facing a supply jet, a warm equipment-adjacent area and a door or exterior-wall edge if they could dry material more rapidly. A mobile logger can be moved for exploratory checks, but simultaneous measurements are stronger when door traffic, control cycling or moisture release changes quickly.
A sensor at the fan discharge is useful for diagnosing the fan and can reveal a locally dry or cold jet. It is usually a poor stand-in for the entire room. Likewise, a sensor tucked into a densely packed flower cluster may help investigate a pocket but should not routinely touch product, damage resin or create contamination. If invasive product-adjacent sampling is needed, apply the facility hygiene and sampling procedure and use an instrument suitable for the task.
Map three dimensions when the harvest occupies three dimensions
Multi-level trays, hanging rails and tall racks may differ by height because of air delivery, temperature stratification and obstacles. Check upper, central and lower occupied elevations when the layout creates those distinctions. There is no reason to install three elevations in a shallow, single-level chamber simply to mimic a warehouse mapping diagram. The test is whether the selected points represent real product exposure, not whether a visually symmetrical grid looks impressive.
Every logger should be mapped to an actual product zone and a question. For example, “Does the back-lower tray recover from the first-day moisture peak as promptly as the central tray?” is testable. “Sensor at rear” is less useful because it neither defines the risk nor tells another operator where to reinstall the instrument. Record rack position, height, orientation and nearby obstacles before the first harvest is loaded.
| Sensor position | Question it answers | Placement caution |
|---|---|---|
| Primary occupied-zone reference | Do typical product locations track the operating envelope? | Keep out of direct discharge, wall conduction, sun and wetting |
| Sheltered or densest-load position | Is a wet pocket slower to dry or recover? | Keep the sensing element clear of contact and product debris |
| Exposed supply-side product position | Is one row experiencing unusually dry or cold air? | Distinguish product-level exposure from the discharge jet itself |
| Upper and lower occupied heights | Does vertical variation matter for these racks? | Only add heights occupied by material or tied to a real risk |
| Door or exterior-wall edge | Do traffic and wall effects produce relevant excursions? | Measure the occupied edge, not an arbitrary wall surface |
| Controller or return-air reference | Is the control point missing a product-zone deviation? | Do not assume mixed return air represents the worst position |
Cross-check the instruments before interpreting room differences
Put the loggers and controller probe close together in a stable, representative environment, following instrument instructions. Allow sufficient equilibration and compare temperature and RH at the same time and location. Record device IDs, displayed resolution, stated accuracy, offsets, logging interval and the comparison conditions. If a device disagrees substantially with a suitable reference, investigate or recalibrate before interpreting that difference as a room gradient. A pair of low-cost loggers agreeing with one another is reassuring but is not traceable calibration.
A field comparison at one humidity and temperature point does not establish accuracy over an entire operating range. Use a documented calibration method or service when the required confidence, regulatory setting or product value demands it. A salt-reference check must be performed with the correct temperature, equilibration, materials and manufacturer procedure; a casual sealed bag with table salt is not proof of certified accuracy. Avoid mounting electronic housings in an orientation that causes their own heat to distort the sensing element.
“My wall hygrometer says the room is fine. Why is the back rack still damp?”
Question sent by: Ethan Brooks, via email.
Verify the wall sensor against a second instrument, then compare the wall location and the back-rack product zone at the same times. If the back stays more humid during an actual wet load, investigate spacing and the local return path before lowering the target for the entire room. Sample flower condition separately; neither screen alone establishes readiness.
Interpret Temperature, Humidity, and Flower Measurements Together
After placement, treat each device as a time series rather than a photograph. Record temperature and RH together, with synchronized clocks, stable device IDs and a chosen interval fine enough to reveal control cycling, door events and equipment downtime. A twenty-minute interval was used in one cannabis drying experiment, but that is an experimental choice, not a universal logger setting. A room with rapidly cycling equipment may need finer records, while a quiet small space may be monitored differently if excursions can still be detected.
Compare matching timestamps instead of comparing two daily averages
A daily average of 60% RH can conceal a prolonged humid interval balanced by an overly dry interval. Two zones can also have identical averages while one sits persistently high during the wettest part of the load. Plot or tabulate corresponding readings for the same interval. Note the warmest and coolest occupied sites, highest and lowest RH, duration of excursions, and whether differences appear during loading, door opening, defrost or fan cycles. The acceptance criterion is chosen and documented for that process; it is not a universal percentage-point difference endorsed for cannabis.
Record a simple difference between the worst and reference positions, but interpret it in light of each sensor’s accuracy and the expected temperature difference. A two-percentage-point apparent RH gradient may be smaller than the combined instrument uncertainty. Conversely, a repeated large difference that follows the same room location even after instrument positions are swapped is persuasive evidence of a spatial pattern. Trend direction and persistence often matter more than an isolated digit on a display.
Always read RH beside temperature
Relative humidity is temperature-dependent. Two areas can contain similar amounts of water vapor and still report different RH because one is cooler. A cold surface may approach its dew point and accumulate condensation even if a sensor elsewhere looks unremarkable. Compare temperature and RH together, and use dew point or absolute-humidity calculations only when the measurement quality and analysis justify them. Do not infer a water-removal problem solely because RH jumped at the moment the cooling equipment lowered the air temperature.
The relationship can also run in the other direction: air near an active heater or dehumidifier may look dry by RH because it is warmer, not necessarily because it contains much less moisture. If all locations shift together, investigate overall system behavior before rearranging one rack. If only a cold corner repeatedly approaches condensation conditions, inspect that corner, adjacent surfaces, insulation and air distribution before changing the operating band for the full room.
Distinguish mapping, continuous monitoring, and product acceptance
Mapping is a deliberate multi-position comparison to discover where risks occur. Routine monitoring keeps watch at a smaller set of justified fixed locations and may include a portable verification check. Product acceptance tests representative flowers against the applicable lot requirements. An extensive map does not remove the need for routine monitoring, and a clean room trend does not remove the need for product checks. The three activities should share a location map and lot identifiers so observations can be connected.
ASTM D8197-22 describes a recommended 0.55 to 0.65 water-activity range for dry cannabis flower intended for storage. That is a dried-product specification, not a drying-room RH target or universal harvest-release law. ASTM D8196 addresses measuring flower water activity, and explicitly does not treat water-activity control as a microbial kill step. Follow applicable testing and disposition rules; a satisfactory water-activity result cannot retroactively clear a previously moldy batch.
Never release a suspect lot because the room logger looks normal
Visible suspicious fungal growth, progressive decay, abnormal moisture damage or other credible contamination concerns require appropriate isolation, investigation and applicable laboratory/rejection procedures. Lowering the room RH, moving a sensor, airing out the flower or obtaining a storage-range water-activity reading does not make contaminated flower safe.
Pair a sensor trend with a representative flower trend
Tag sample locations that correspond to environmental zones. If the front rack is drying quickly and the back rack slowly, compare flowers with similar size, density, trim condition and starting state where feasible. Track representative sample mass using a clean scale and consistent protocol, or use an approved moisture or water-activity test when the decision requires it. A stable room reading plus divergent flower trajectories may indicate different starting material or material geometry instead of bad sensor placement.
A stem snapping, the surface feeling crisp or a jar hygrometer settling at a particular value are only screening clues. None proves a dense center is safe, and jar headspace is not an ASTM test unless an appropriate measurement method and equilibration conditions are followed. For product endpoint decisions, use the dedicated flower readiness before jarring guide and the applicable lot-testing procedure rather than turning this sensor article into a curing schedule.
Remember: A controller measures where it is mounted. A monitoring map measures where it is installed. Only a representative flower test evaluates the selected product sample.
Adapt Sensor Coverage to the Actual Harvest and Room Layout
Microclimate mapping is only relevant to the configuration actually tested. An empty-room survey can find a warm wall and a supply jet, but it cannot demonstrate behavior when recently harvested material begins losing water. An early harvest load may temporarily exceed the drying system’s comfortable moisture-removal capacity. Record whether every comparison took place empty, partly loaded or at the typical or maximum permitted load. Avoid using an untested maximum load on valuable flower as the first proof-of-capacity experiment.
Whole plants and dense flower groups change the air-side question
Whole plants carry attached stems and leaves and create sheltered spaces between flower clusters. Separated branches and tray material create different air paths and drying rates. When changing from one layout to another, retest the zones most affected by the change. A logger beside a branch row cannot automatically represent dense whole plants tightly grouped on an adjacent rail. The question is which product positions could retain wetter air or receive excessive airflow under the chosen layout.
A 2026 industrial cannabis drying comparison observed different drying behavior for trays and hanging material under its specified conditions, and a 2023 industrial tray study followed moisture loss through controlled processing runs. These provide evidence that load and geometry affect process performance; neither establishes a universal number of sensors, hanging spacing, or acceptable spatial RH gradient for a home or commercial room. Record cultivar, biomass, flower structure, trim style, loading geometry and location as process variables.
A high starting moisture load changes the risk map over time
The air near recently cut material may experience a larger water-vapor load early in drying. As the material loses moisture, the same room can shift from a humid back corner toward an overexposed, fast-drying front row. Sensor placement should therefore be assessed at the beginning, during the changing moisture-release phase, and toward the intended endpoint. Do not certify a room from a single afternoon when almost-dry flowers happen to be emitting little moisture.
Record harvest exposure to rain, transport delays, attached leaf mass and whether wet or suspect material was segregated before loading. The incoming condition can matter more than the difference between two sensor models. An extended wet-load RH excursion across all devices points toward a capacity or control issue; a persistent discrepancy at one rack points toward local flow, layout or instrument error. Separate these pathways before making a corrective decision.
Check door events, HVAC cycles, and equipment interactions
A door event can temporarily introduce warmer or more humid air. An air conditioner may drop temperature and raise reported RH without adding water vapor. Defrost cycles, dehumidifier shutdown, humidifier pulses and changes in the return-air route can generate peaks that a single manual reading misses. Record equipment status and ordinary activity alongside the logger timeline. When an unexplained excursion coincides with a control event, verify the sequence instead of simply moving the affected sensor.
Do not bypass equipment safety controls or electrical protection to flatten a trace. Condensate must drain safely away from flower, cords and walking surfaces. If humidity-control devices fight one another, change-control logic may need professional review. This article helps locate the exposure pattern; complete equipment qualification, capacity tests and formal handover belong in a separate drying-room commissioning procedure.
Change coverage when you change the layout
Moving a rack, adding a second rail, increasing flower density or converting from hanging to trays changes where the worst conditions may occur. Re-map after a substantial modification rather than assuming old sensor positions remain correct. A repeated seasonal humidity problem also warrants mapping under representative incoming air conditions. Keep versions of the plan with dates and lot information so that subsequent records remain interpretable.
“Can I use one sensor for a small drying tent?”
Question sent by: Julia Schneider, via contact form.
One control sensor may be workable if a mobile independent instrument shows that the actual hanging or tray positions track it under a realistic load. Compare the most sheltered and most exposed material positions during early drying and again as moisture release declines. If they behave differently, continue using a second logger or redesign the layout. Tent size by itself does not prove uniformity.
Diagnose Microclimate Failures and Misleading Readings
When a sensor is out of line, the first task is to decide whether the air differs or the instrument is wrong. Next, determine whether the deviation is local or room-wide, temporary or persistent, and whether flowers show a corresponding change. Do not start by forcing every device to report exactly the same number. Sensors that are legitimately near different thermal and moisture conditions may disagree even when both function correctly.
A humid pocket behind a rack
Compare the back logger with the central reference at matching times. Swap or add a verified portable logger at that exact location. If the humid pattern follows the location rather than the device, inspect overlapping leaves, loading density, shelving panels, blocked return-air flow and adjacent cold surfaces. Remove obstructions or redistribute load as appropriate, making sure the change does not introduce a high-speed jet onto exposed flowers. Verify the back position against the same reference after the change, especially during the next high moisture-release period.
A dry supply jet at the first hanging row
Rapidly dropping RH near the first row may reflect direct conditioned-air exposure. Compare the supply-side product zone with the actual center of the jet and the central reference. Inspect comparable flower samples for disproportionate surface drying and mass loss. Redirect or diffuse the airflow within equipment constraints, or reposition material so that it is not hit directly. Recheck the once-overexposed location and confirm the sheltered end did not become more stagnant as a tradeoff.
A wall sensor that disagrees with everything else
Thermal conduction through a wall, a nearby heater, sunlight, improper electronic housing orientation or poor airflow can bias a reading. Confirm instrument agreement when co-located and then compare the wall position with free air at product level. If the wall device is the only controller, changing its location can alter HVAC response. Treat relocation as a documented change: check the system behavior again, update the map and keep the independent logger in operation during verification.
An RH spike that follows cooling rather than moisture accumulation
Examine the temperature trace during the RH change. Relative humidity can climb as air cools while the water-vapor content changes little. A simultaneous air-temperature drop at multiple sensors points toward this mechanism, although it does not rule out a local wet pocket. Check dew-point proximity and condensation evidence where relevant rather than immediately switching on more dehumidification based on one RH number. If condensate is present or product contacts a wet surface, isolate that safety and quality issue independently.
Two units disagree even when sitting side by side
Let both instruments stabilize under the same conditions and use a reference with sufficient accuracy for the decision. Check time synchronization, reporting units, display rounding, batteries, sensor wetting, dirt, drift and sensor recovery after previous condensation. If the comparison disagreement is large or changes over the relevant operating band, investigate calibration or replacement. Do not subtract a convenient fixed offset from every future reading unless your calibration method supports that correction.
| Observed pattern | Likely competing explanations | Verification and response |
|---|---|---|
| Only rear zone remains humid | Sheltered load, blocked return path, biased logger | Co-locate/swap logger; inspect spacing; adjust one obstruction; re-map |
| Only supply-side flowers dry fast | Direct jet, warmer air, smaller flowers | Measure product-level exposure; compare like-size samples; redirect air |
| All loggers spike after fresh loading | Moisture load, insufficient removal, control sequence | Check equipment status, load specification and recovery; do not hide an all-room failure |
| RH rises when temperature drops | Temperature effect, new moisture, local condensation | Review synchronized T/RH and dew-point/physical evidence |
| A single wall logger differs consistently | Wall heat flow, housing heat, sensor drift | Compare in free air and with reference; document controlled relocation |
| Room looks steady but samples diverge | Flower size/starting moisture, unmeasured pockets | Pair sample IDs with zones; enlarge map or separate lots |
| Visible condensation or suspect growth | Wet surface, leak, existing contamination | Hold affected product; resolve water source; follow safety and lab rules |
Make the smallest defensible correction
Do verify the sensor, define the spatial pattern, identify the physical obstruction or control event, change one factor and remeasure. Avoid chasing a single spike, overcorrecting the whole room for one corner, blowing a fan directly onto flowers, or assuming improved RH reverses existing mold.
When the data cannot answer the question
A one-time reading without sensor ID, location or clock time cannot establish a microclimate pattern. Two devices of unknown calibration history cannot support fine distinctions. A controller graph is insufficient if it has no product-level verification during a heavy load. Treat these as missing evidence rather than a positive result. Hold the conclusion, repair the measurement plan and gather another comparable set of observations. A failed measurement is better documented as uncertain than turned into false reassurance.
A Repeatable Sensor-Placement and Correction Procedure
Use this field procedure whenever a new room is put into use, the configuration changes, a lot behaves unevenly or a monitoring device is replaced. Write decisions in a simple worksheet before adjusting equipment. The procedure can be repeated by a second operator without relying on memory or intuitive descriptions such as “the room felt damp.”
Step 1: define the real product zone and operating objective
Record lot ID, harvest condition, wet biomass or approximate load, drying format, occupied rack positions and the site-approved environment and product specifications. Identify who can investigate, correct, stop or release material. Draw a floor-and-height plan showing doors, supply and return paths, HVAC/dehumidifier and humidifier locations, electrical panels, drains and access routes. Decide which consequences matter most: prolonged wet exposure, direct fast-drying air, condensation or equipment failure. Leave final water-activity and contaminant testing to the separate product protocol.
Step 2: verify devices and synchronize their clocks
Log model, device ID, operating range, date and method of the most recent calibration, resolution, logging interval and battery or network status. Place independent units together, allow stabilization and document their agreement with a suitable reference. Make an explicit hold decision for any device that cannot be trusted. Set a common clock or capture a known offset; without synchronized timestamps, a control cycle can masquerade as a difference between zones.
Step 3: install the reference and deliberate challenge positions
Mark the primary sensor at representative product level. Add independent points at the most sheltered wet candidate, the most exposed dry candidate and further occupied heights or edge zones justified by the layout. Use a fixed label and map coordinates or an unambiguous rack reference for every logger. Keep probes away from leaf contact, wetting, unintended heating and handling damage. A movable logger may be used sequentially in a tiny room if conditions remain stable; document why sequential comparison is adequate and repeat during an appropriate load.
Step 4: collect an empty baseline, then a representative loaded trace
An empty-room run is useful for instrument and control checks, not proof of loaded drying performance. Compare readings during an appropriately supervised representative load, especially during initial moisture release. Continue through different drying phases or document which phases are not yet observed. Record normal door activity, changes to controls, equipment cycling, condensation and sample observations. Never use knowingly contaminated flowers merely as a test load, and do not exceed the system’s safety or permitted capacity to see what happens.
Step 5: compare the worst point with the reference
Look at paired temperature/RH graphs, maximum and minimum excursions, persistence, location repeatability and sample trends. Ask first whether the deviation is outside the chosen acceptance criterion or uncertainty; next whether the entire room or just one zone is affected. Verify ambiguous readings with a portable reference or a device swap. A persistent worst location should be monitored until corrected, even if the average is acceptable. Document a conclusion that acknowledges untested positions and seasonal conditions.
Step 6: make one targeted change and retest the affected zone
Correct the actual cause: move or separate material, clear a return path, shield a misleading sensor from external heat, alter an appropriate fan orientation or have equipment repaired. Avoid stacking changes to humidity settings, airflow, load and sensor placement in one untraceable experiment. Repeat synchronized logging with the same reference and a comparable load phase. Confirm that the previously affected location improves and that another location has not become the new worst case.
Step 7: choose permanent monitoring locations and escalation rules
Retain a fixed control probe only where it provides representative feedback. Place independent monitoring at mapped high-risk locations that the control probe does not capture; document when a portable check is acceptable. Assign an alert band, duration or event rule based on the validated room/process specification and measurement uncertainty. State what the operator does when the logger is offline, a sensor becomes wet, a door is left open or a loaded rack differs from its baseline. A phone alert is not a process control plan without a response.
Step 8: check the flower and close the loop
Inspect and test representative material from the previously wettest and driest positions as required. Record whether the actual rate and endpoint are acceptable without assuming the environmental map proves the batch. Document deviations, product holds, investigation results and corrective action. If conditions have changed substantially, repeat the mapping and revise permanent positions. This final verification turns placement into an operational system instead of a photograph of sensors on a wall.
| Check | Record | Pass or investigate decision |
|---|---|---|
| Before loading | Map, device comparison, calibration status, approved envelope | Do not start monitoring with unreliable instruments or unknown risk positions |
| Early wet load | Synchronized T/RH by zone, controls, product state | Investigate common RH overload or a persistently humid pocket |
| Mid-dry trend | Relative changes by zone, sample mass/condition | Confirm wet and dry extremes are not diverging |
| After one correction | Old and new paired traces, same location IDs | Confirm improvement without creating a second failure |
| Before product transfer | Representative flower tests, inspection and lot status | Environmental pass alone cannot release product |
| After room change | Revised map, configuration version and logs | Re-map relevant zones and reset permanent monitoring rationale |
“If I move a fan and both sensors read closer together, have I solved the problem?”
Question sent by: Mason Carter, via Facebook page.
You have a promising room-level observation, not yet proof of a successful correction. Recheck the formerly wet location and the newly exposed flower zone during a comparable load phase, then compare representative material. Confirm that direct airflow has not accelerated surface drying or created a blind spot elsewhere.
Build a Quality-First Monitoring Baseline and Final Checklist
A strong baseline states exactly which room, sensor, material, load and operating pattern were tested. Save a map version, device IDs and calibration status, synchronized traces, approved ranges, documented worst locations, corrections and repeat-test outcomes. Use consistent sample-location labels across future lots. Compare changes in drying time and quality only between reasonably comparable cultivars, flower sizes, trim styles and input conditions; otherwise treat the comparison as a hypothesis rather than evidence that one sensor placement improved quality.
Make the permanent map easy to audit
Every routine logger needs a location label, purpose, normal trend relationship to the control position, alarm response and check interval. Keep an independent way to verify a contested reading. Note locations that could not be instrumented and how they will be checked manually or with a portable device. Update the map after adding racks, changing fan paths, altering fresh load limits, repairs or materially different seasonal air. Store data securely and consistently with site and legal record obligations.
Protect aroma without using sensory quality as a safety test
Uneven warm or high-velocity exposure may lead to quality differences between flower zones, while slow moisture release in sheltered areas can extend wet exposure. Sensor maps help detect these process differences and direct sampling, but aroma alone cannot quantify terpene retention or exclude contamination. A research study comparing cannabis drying atmospheres found cultivar-specific quality outcomes under its experimental conditions; it did not identify a universally correct ambient setting or sensor position. Avoid claiming that a particular logger arrangement guarantees flavor preservation.
If suspect mold or serious abnormality is detected, use the lot hold and appropriate laboratory/disposal pathway. Do not use drying, curing, a reassuring room trace or a water-activity value as a mold remediation claim. Separate quality optimization from product safety and follow applicable local regulations. Indoor climate monitoring protects process visibility; it does not certify a harvest by itself.
Master Advice: Select monitoring positions because they can detect a meaningful failure, then retain them only after a loaded-room comparison confirms their usefulness. Every important change should leave a before-and-after trace and a corresponding product observation.
Sensor Placement and Microclimate Verification Checklist
- Record the actual lot, drying method, load and approved process limits.
- Draw the occupied floor-and-height map with supply, return, doors and equipment.
- Compare loggers under common conditions and document their accuracy status.
- Mark one representative reference and plausible wet, dry and edge zones.
- Log temperature and RH together with synchronized times under a real load.
- Compare the worst locations, excursions and associated flower observations.
- Verify uncertain readings before changing controls; correct one cause at a time.
- Repeat the map after corrections and meaningful layout or seasonal changes.
- Keep product water activity and microbial disposition separate from room RH.
- Save the map, trends, deviations, corrective action and final evidence.
Educational content. Always follow applicable cultivation laws and safety requirements.
Share this article
A quick overview of the topics covered in this article.
Follow us
Latest articles
October 11, 2026
October 11, 2026
October 11, 2026
October 11, 2026